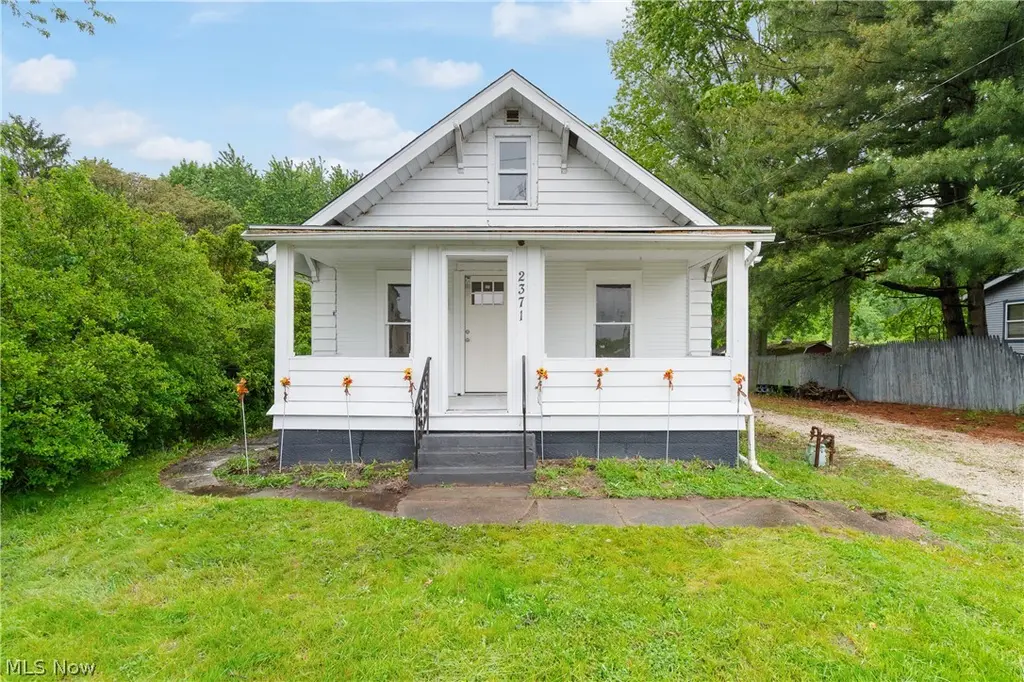
2371 Greensburg Rd · Green, OH
Flood risk 1/10 · Minimal
- FEMA flood zone
- X (unshaded)
- Chance of flooding over 30 yrs
- 0.0%
- Est. flood insurance / yr
- $473 – $860
Fire risk 1/10 · Minimal
- Est. fire insurance / yr
- $713 – $1,323
Heat risk 3/10 · Minor
- Hot days now (above 96°F)
- 7 days/yr
- Hot days in 30 yrs
- 17 days/yr
Wind risk 1/10 · Minimal
- Chance of severe wind over 30 yrs
- —
Air-quality risk 2/10 · Minimal
- Unhealthy air days now
- 0 days/yr
- Unhealthy air days in 30 yrs
- 1 days/yr
Risk factors via First Street. Map © Google.
Why this score? — see what drove the D- grade
The composite is a weighted blend of 9 inputs, each scored 0–100. Each bar is that input's sub-score; the figure is the points it added to the 100-point composite (weight × sub-score).
- Cash flow +9.6/30.0
- ARV discount +7.5/15.0
- Schools +6.4/10.0
- Livability +4.4/5.0
- 1% rule +2.8/10.0
- DSCR +2.7/10.0
- Rent growth +2.7/5.0
- Condition / age +2.5/5.0
- Appreciation +0.0/10.0
$150,000
🖨 Deal sheet (PDF) 📄 Offer letter ✓ Due diligence
Listing remarks MLS
Looking for an investment property in Green Local Schools? Look no further this property has had the renovation process started, now all it needs is a new owner to finish up with their finishing touches. 1 bedroom on the first floor with the option of a second bedroom upstairs. If you're thinking of expanding your portfolio this house could be the one for you. Don't hesitate, schedule your own private showing today.
Key facts
- New furnace
- Beautiful backsplash
- New hot water tank
Tags
Property features AI
Exterior
- Parking: Driveway
- Utilities: Well water; Septic tank
- Home design: Two-story home; Above-grade finished living area about 862 (public records)
- Construction: Aluminum and vinyl siding; Asphalt/fiberglass roof
- Exterior features: Waterfront property; Lot roughly 0.19 acres
Interior
- Bedrooms: One main-level bedroom
- Bathrooms: One full bathroom (main level)
- Heating & cooling: Forced-air gas heating
- Interior features: Full, unfinished basement
Neighborhood map
What this means for you Summary
Snapshot
- This is a 1-bed/1.5-bath single-family listed at $150k.
Deal economics
- At list price, monthly cash flow is $-101 ($-1k/yr) — negative.
- To cash-flow at today's rent, offer at most $132k (11.9% below list).
- To meet the 1% rule (rent ≥ 1% of price), the offer needs to be $117k (22.3% below list).
- Recommended offer: $117k (22.3% below list) — sets the bar for 1% rule.
- Cap rate 5.5% vs local median 2.6% in Green — top-decile yield for the area; either an underpriced asset or a hidden risk that comps aren't pricing in. Stress-test before assuming the spread holds.
Location & tenants
- Location reads 87/100 on livability (#31 in OH, #281 nationally) — a professional / high-income tenant draw. Strengths: amenities A+, employment A+, cost of living A+; Watch: commute F.
- Green Local (suburban): math 75% / reading 74% proficiency, ranked #90 of 656 in OH (top 14%) — strong family-tenant draw, lease renewals of 3-5y typical; only 18% free/reduced lunch — higher-income household profile.
- Zoned schools: Green Primary School (math 79% / reading 72%, grade A, #257 of 1,584 statewide, top 17%, 849 students, 23% FRL); Green Intermediate Elementary School (math 79% / reading 76%, grade A+, #68 of 654 statewide, top 10%, 912 students, 23% FRL); Green High School (math 65% / reading 74%, grade B, #106 of 781 statewide, top 16%, 1,313 students, 19% FRL) — zoned schools at 22% FRL track the district average.
- Market conditions: Rents flat; 226 active listings in the ZIP; 2 comparable units currently listed for rent nearby; solid renter incomes; 1,114 units permitted in Summit County in 2024 (397 in 5+ unit buildings).
- This rent is only 17% of the median local income ($83k/yr) — well below the 30% rent-burden line; pricing power to push rent on renewal without tenant pushback.
Forward outlook
- Local home prices are declining (-3.0%/yr); year-one equity from $1k of loan paydown is wiped out by about $4k of value loss. Plan a longer hold.
- Summit County population projected to shrink 6% by 2050 — rents likely to lag national; underwrite the cash flow, not the appreciation.
Negotiation context
- It's been on market 31 days — a 3% lower offer ($146k) is reasonable based on typical stale-listing flexibility.
- 6 sale attempts since 33y ago with the ask held roughly flat each time — persistent listings suggest the price (not the market) is what's stuck; bring a comps-based counter.
- Current owner paid $75k; list at $150k implies a 100% gain — meaningful room to come down on a strong offer.
Risks & watch-outs
- Watch-outs: built in 1927 — expect roof / HVAC / electrical / plumbing capex.
Questions for the listing agent
- What do current leases actually rent for vs. the listed asking? Can we see a recent rent roll and the last 12 months of T-12 income?
- It's been on market 31 days. Have you received any prior offers? Is the seller open to a 22% concession, seller financing, or rate buy-down credit?
- Built in 1927 — when were the roof, HVAC, electrical panel, plumbing, and water heater last replaced?
- Is there a deadline driving the sale (1031 exchange, divorce, estate, relocation)? That informs how much negotiation room exists.
- Schools are A-rated — typically a magnet for longer-tenancy family renters. What's the average tenant stay here, and is there a school-zone premium baked into asking?
- The area grade is low — what's the realistic commute time and amenity access for the typical tenant pool here? Any planned neighborhood developments (good or bad) we should know about?
- What's the average days-on-market for RENTAL listings here right now (not sales)? A rising rental-DOM trend means longer vacancies and softer asking-rent achievability than the comps imply.
- What's the recent tenant-quality profile in this submarket — average credit score on applications, eviction rate, late-payment / NSF rate, and stable-employment percentage? A property-management company in the area should have these aggregated.
- How much new for-sale + rental construction is in the pipeline within 1–3 miles? Heavy new supply typically softens prices + rents 12–24 months out; constrained supply supports both.
Investment metrics
- 1% rule
- 0.78% ✗
- Cap rate
- 5.49%
- Cash-on-cash
- -2.88%
- DSCR
- 0.87
- GRM
- 10.7
CMA / ARV
No comps found within radius.
Projected returns pro-forma
-3.0% appreciation · 0.82% rent growth · sell at horizon
- IRR
- -23.5%
- Equity multiple
- 0.21×
- Total profit
- $-33,218
- Equity at exit
- $22,365
- IRR
- -25.4%
- Equity multiple
- -0.12×
- Total profit
- $-46,986
- Equity at exit
- $12,969
Cash invested: $42,000 (down + closing). Projections, not guarantees.
Landlord ↔ Tenant lean methodology
- Overall (STATE)
- 73 Landlord-Friendly
- State Ohio
- 73 Landlord-Friendly · R+6
- County
- — inherits STATE
- City
- — inherits STATE
ZIP-level market 44720
- Rents YoY
- 0.8%
- Active inventory
- 226
- Price-to-rent
- 10.7×
Monthly cashflow live
- Estimated rent
- $1,166 medium interval (Pro) →
- Mortgage (P&I)
- −$787
- Tax from tax record
- −$173 /mo · $2,073/yr
- Insurance
- −$62
- HOA
- −$0
- Vacancy / Maint / Mgmt
- −$245
- Net cashflow
- $-101
Break-even live
Sensitivity live
| Price | -10% $-16 | -5% $-58 | +0% $-101 | +5% $-143 | +10% $-186 |
|---|---|---|---|---|---|
| Rent | -10% $-193 | -5% $-147 | +0% $-101 | +5% $-55 | +10% $-9 |
| Rate | -1.0pp $-25 | -0.5pp $-63 | base $-101 | +0.5pp $-140 | +1.0pp $-179 |
UW: 25.0% down · 7.5% · 30yr · 1.5% tax · 5.0% vac · 8.0% maint · 8.0% mgmt
Financing live
Cash to close
- Down payment
- $37,500
- Closing costs
- $4,500
- Reserves months
- —
- Total cash needed
- —
Loan-product check · same deal, 3 products live
Conventional
25% down · 7.5% · 30yr
- Down + closing
- —
- Monthly P&I
- —
- Monthly cashflow
- —
- DSCR
- —
- Eligible?
- —
Personal DTI + credit; lowest rate.
DSCR
20% down · 8.5% · 30yr
- Down + closing
- —
- Monthly P&I
- —
- Monthly cashflow
- —
- DSCR
- —
- Eligible?
- —
No personal income docs; deal must DSCR.
Hard money
10% down · 12.0% · 12mo
- Down + closing
- —
- Monthly P&I
- —
- Monthly cashflow
- —
- DSCR
- —
- Eligible?
- —
Short-term bridge; refi at stabilization.
Rent comps 2 comps
| Address | Beds | Baths | Sqft | Rent | $/sqft | DOM | Units | Dist |
|---|---|---|---|---|---|---|---|---|
| 1960 Burgess Dr Uniontown, OH | 1.0 | 1.0 | 662 | $559 | $0.84 | 22d | 1 | 1.39mi |
| 2000 Burgess Dr Uniontown, OH | 1.0–2.0 | 1.0–2.0 | 930 | $1,482 | $1.59 | 15d | 8 | 1.43mi |
Listing history 12 events
-
2026-06-21days on market $150,000 Active 31 DOM
-
2026-06-21days on market $150,000 Active 30 DOM
-
2026-06-18days on market $150,000 Active 28 DOM
-
2026-06-17days on market $150,000 Active 27 DOM
-
2026-06-16days on market $150,000 Active 26 DOM
-
2026-06-15days on market $150,000 Active 25 DOM
-
2026-06-13days on market $150,000 Active 23 DOM
-
2026-06-12days on market $150,000 Active 22 DOM
-
2026-06-09days on market $150,000 Active 19 DOM
-
2026-06-08days on market $150,000 Active 18 DOM
-
2026-06-08remarks 693-char remark
-
2026-06-08$150,000 Active 17 DOM
ⓘ Source: listings_history table (triggers on properties + properties_extension) + one-shot
backfill from property_details.listing_events for pre-trigger history.
Tax reassessment forecast OH · Partial reset (capped growth)
- Current annual tax
- $2,073 · $173/mo
- Projected year-2 tax
- $2,206 · $184/mo
- Expected delta
- +$134/yr (+$11/mo · 6.4%)
ⓘ Screening estimate from a state-policy table — verify with the county assessor before closing.
Climate risk First Street
- Flood 1/10 Low FEMA zone X (unshaded) · 0% chance over 30 yrs
- Wildfire 1/10 Low
- Heat 3/10 Moderate 7 d/yr ≥96°F today · 17 d/yr by 30 yrs out
- Wind 1/10 Low
- Air quality 2/10 Low 0 unhealthy d/yr today · 1 by 30 yrs out
Nearby sold comps map
Loading sold comps map…
Walkable amenities ~0.75 mi
Loading nearby amenities…
Taxation est. · year 1
- Rental income
- $13,991
- − Mortgage interest
- −$8,402
- − Property taxes
- −$2,073
- − Insurance
- −$750
- − Repairs & maintenance
- −$1,119
- − Management
- −$1,119
- − Depreciation
- −$4,364
- Taxable loss
- −$3,836
- Est. tax savings @ 24.0%
- +$921
- After-tax cash flow
- $-288/yr
For passive investors: Depreciation is non-cash, so a rental often shows a tax loss while cash-flowing — sheltering income. Rental losses are passive: they offset passive income freely, and up to $25,000/yr can offset ordinary (W-2) income if you actively participate and your MAGI is under $100k (phasing out to $0 by $150k); unused losses carry forward. On sale, claimed depreciation is recaptured at up to 25%, and gains may owe capital-gains tax (a 1031 exchange can defer both). Figures are a year-1 estimate at your 24.0% rate — not tax advice; consult a CPA.
Schools (NCES district)
- District
- Green Local
- NCES district ID
- 3905001
- Math proficiency
- 75% ▼ -9.00%
- Reading proficiency
- 74% ▼ -7.00%
- Median HH income
- $63,973
- Composite
- 64.45/100
- National rank
- #542
- State rank
- #90 of 656 in OH
Livability — Green
- Score
- 87/100
- State rank
- #31
- US rank
- #281
Category grades
Schools grade is shown separately in the Schools card above.
Census & demographics
- Census place
- Green, OH
- County
- Stark County · 272,865 people
- City population
- 50,124
- Metro
- Canton-Massillon, OH
- Population (ZIP)
- 39,851
- Household income
- $82,594
- Rent vs Own
- Severe rent burden
- 1068.0
Population outlook (Summit County) Hauer SSP2
- Today (2025)
- 546,583 people
- By 2030
- 544,028 · -0.5%
- By 2040
- 531,363 · -2.8%
- By 2050
- 514,923 · -5.8%
- By 2075
- 481,765 · -11.9%
- By 2100
- 432,265 · -20.9%
Race, ethnicity, and origin ACS 2023
- Neighborhood character
- Predominantly White (92%)
- Race & ethnicity
- White 92% Two or more races 3% Hispanic / Latino 2% Black 2% Asian 2%
- Common ancestry
- Romanian 5% Italian 4% Lithuanian 3%
- Foreign-born
- 3% · Canada, China
- Languages at home
- 97% English-only · Spanish 1% Other Indo-European 1%
Political lean MEDSL · Summit
- 2024 margin
- Lean D (+7.0) · D 53.0% · R 46.0%
- 2008→2024 swing
- -9.6pp toward R · 2008: 16.6pp · 2024: 7.0pp
- All cycles
- 2024: D+7.0 2020: D+9.6 2016: D+8.2 2012: D+14.8 2008: D+16.6
Not yet ingested
- Civics
- —
Market trends
- HPI YoY
- ▼ -218.69%
- Current HPI
- 215.4995
- Rent YoY
- ▲ 0.82%
- Metro
- Canton-Massillon, OH
- State GDP YoY
- ▲ 1.98%
- F500 in state
- 48
Industry mix (Fortune 500 HQ in OH)
| Industry | F500 HQs | Revenue |
|---|---|---|
| Insurance | 3 | $145B |
|
||
| Industrial Machinery | 3 | $49B |
|
||
| Financial Services | 3 | $24B |
|
||
| Consumer Goods | 2 | $93B |
|
||
| Aerospace / Defense | 2 | $47B |
|
||
| Utilities | 2 | $33B |
|
||
Price history
+275.0% since first listed17 events — show timeline
- 2026-05-21 Listed $150,000 MLSNOW
- 2025-12-08 Sold (Public Records) $75,000 Public Records
- 2025-12-05 Sold (MLS) $75,000 MLSNOW
- 2025-11-21 Pending — MLSNOW
- 2025-09-10 Relisted — MLSNOW
- 2025-09-02 Pending — MLSNOW
- 2025-08-08 Listed $89,999 MLSNOW
- 2023-04-26 Sold (Public Records) $74,000 Public Records
- 2005-10-25 Sold (Public Records) $80,000 Public Records
- 2005-08-30 Listing Removed — MLSNOW
- 2005-05-01 Listed $78,900 MLSNOW
- 2004-09-27 Listing Removed — MLSNOW
- 2004-01-27 Listed $84,900 MLSNOW
- 1993-08-31 Sold (Public Records) $50,000 Public Records
- 1993-08-18 Listing Removed — MLSNOW
- 1993-02-18 Listed $52,500 MLSNOW
- 1990-09-11 Sold (Public Records) $40,000 Public Records
Property tax history
+3.3%/yrLatest (2025): $2,073 · -1.2% YoY. Source: county tax records.
Cash-flow waterfall
monthlySold comps — $/sqft
last 12 mo · ≤1 miLoading sold comps…