 🏗️ New Construction
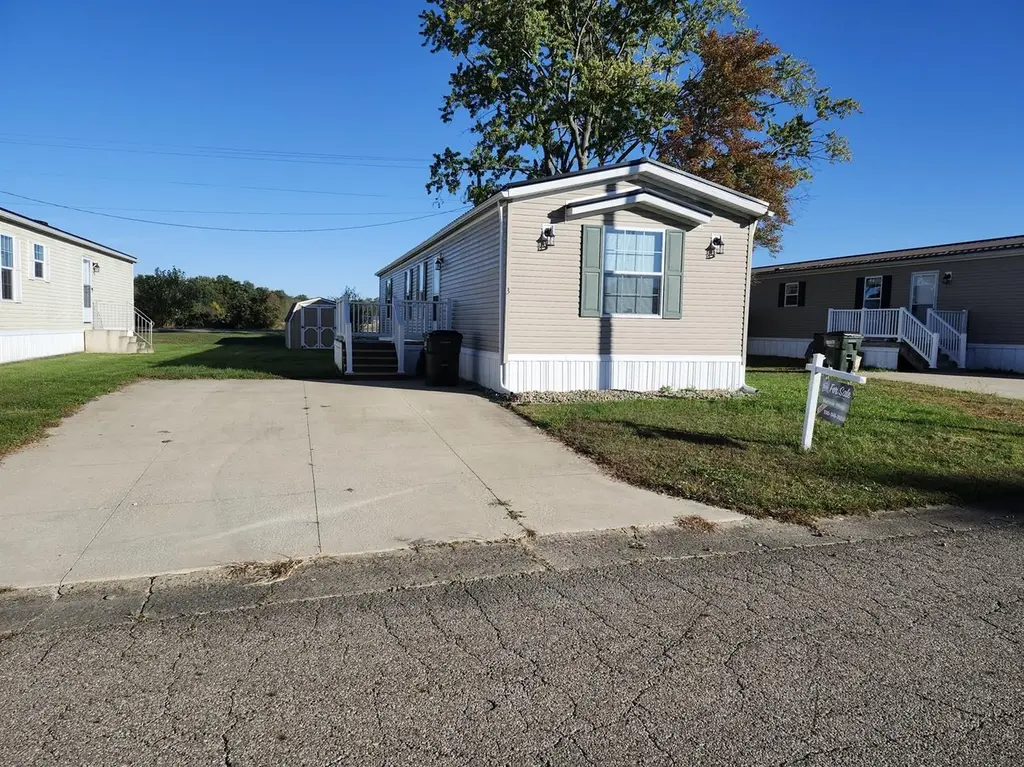
FORTUNE 3 Little Chippewa Plan · Orrville, OH
Flood risk 1/10 · Minimal
- FEMA flood zone
- X (unshaded)
- Chance of flooding over 30 yrs
- 0.0%
- Est. flood insurance / yr
- $507 – $1,088
Fire risk 1/10 · Minimal
- Est. fire insurance / yr
- $713 – $1,323
Heat risk 3/10 · Minor
- Hot days now (above 97°F)
- 7 days/yr
- Hot days in 30 yrs
- 16 days/yr
Wind risk 2/10 · Minimal
- Chance of severe wind over 30 yrs
- 1.0%
Air-quality risk 2/10 · Minimal
- Unhealthy air days now
- 0 days/yr
- Unhealthy air days in 30 yrs
- 1 days/yr
Risk factors via First Street. Map © Google.
Why this score? — see what drove the B grade
The composite is a weighted blend of 9 inputs, each scored 0–100. Each bar is that input's sub-score; the figure is the points it added to the 100-point composite (weight × sub-score).
- Cash flow +30.0/30.0
- DSCR +10.0/10.0
- 1% rule +8.5/10.0
- ARV discount +7.5/15.0
- Schools +5.3/10.0
- Condition / age +4.0/5.0
- Livability +3.9/5.0
- Rent growth +2.5/5.0
- Appreciation +0.0/10.0
$64,800
🖨 Deal sheet (PDF) 📄 Offer letter ✓ Due diligence
Listing remarks MLS
Come tour this beautiful home! This 2 bedroom, 2 bathroom home includes wood kitchen cabinets, walk in closets and so much more. Call the office to book your tour today!
Key facts
- Listed 246 days
Neighborhood map
What this means for you Summary
Snapshot
- This is a 2-bed/2.0-bath manufactured listed at $65k. Condition is rated good.
Deal economics
- At list price, monthly cash flow is $242 ($3k/yr) — positive.
- The deal already cash-flows at list — no discount required.
- Meets the 1% rule at list price ($874 rent vs $65k).
- Recommended offer: $57k (12.0% below list) — sets the bar for market timing.
- Cap rate 10.8% vs local median 3.5% in Orrville — top-decile yield for the area; either an underpriced asset or a hidden risk that comps aren't pricing in. Stress-test before assuming the spread holds.
Location & tenants
- Location reads 78/100 on livability (#161 in OH, #2,403 nationally) — a middle-class / working-renter tenant base. Strengths: crime A+, cost of living A+, housing A+; Watch: amenities F, commute F.
- Orrville City (town): math 65% / reading 61% proficiency, ranked #251 of 656 in OH (top 38%) — acceptable for families but not a draw, mixed tenant base, ~2y average lease.
- Zoned schools: Orrville Elementary School (math 73% / reading 60%, grade B+, #500 of 1,584 statewide, top 32%, 578 students, 45% FRL); Orrville Middle School (math 65% / reading 62%, grade B+, #228 of 654 statewide, top 35%, 487 students, 45% FRL); Orrville High School (math 47% / reading 52%, grade D, #390 of 781 statewide, top 54%, 420 students, 40% FRL) — zoned schools at 43% FRL track the district average.
- Market conditions: 36 active listings in the ZIP; 284 units permitted in Wayne County in 2024 (42 in 5+ unit buildings).
- This rent is only 14% of the median local income ($72k/yr) — well below the 30% rent-burden line; pricing power to push rent on renewal without tenant pushback.
Forward outlook
- Local home prices are declining (-3.0%/yr); year-one equity from $448 of loan paydown is wiped out by about $2k of value loss. Plan a longer hold.
- Wayne County population projected to shrink 6% by 2050 — rents likely to lag national; underwrite the cash flow, not the appreciation.
- At projected returns (-3.0% appreciation + 3.0% rent growth), your $18k cash investment doubles in ~8 years — after that, you're playing with house money.
Negotiation context
- It's been on market 247 days — a 12% lower offer ($57k) is reasonable based on typical stale-listing flexibility.
Questions for the listing agent
- It's been on market 247 days. Have you received any prior offers? Is the seller open to a 12% concession, seller financing, or rate buy-down credit?
- Why hasn't it sold? Are there any deal-killer items the seller is aware of (foundation, flood, title, zoning, code violations)?
- Is there a deadline driving the sale (1031 exchange, divorce, estate, relocation)? That informs how much negotiation room exists.
- Schools are A-rated — typically a magnet for longer-tenancy family renters. What's the average tenant stay here, and is there a school-zone premium baked into asking?
- What's the average days-on-market for RENTAL listings here right now (not sales)? A rising rental-DOM trend means longer vacancies and softer asking-rent achievability than the comps imply.
- What's the recent tenant-quality profile in this submarket — average credit score on applications, eviction rate, late-payment / NSF rate, and stable-employment percentage? A property-management company in the area should have these aggregated.
- How much new for-sale + rental construction is in the pipeline within 1–3 miles? Heavy new supply typically softens prices + rents 12–24 months out; constrained supply supports both.
Investment metrics
- 1% rule
- 1.35% ✓
- Cap rate
- 10.78%
- Cash-on-cash
- 16.02%
- DSCR
- 1.71
- GRM
- 6.2
CMA / ARV
No comps found within radius.
Projected returns pro-forma
-3.0% appreciation · 3.0% rent growth · sell at horizon
- IRR
- 7.0%
- Equity multiple
- 1.27×
- Total profit
- $4,943
- Equity at exit
- $9,662
- IRR
- 16.3%
- Equity multiple
- 2.34×
- Total profit
- $24,227
- Equity at exit
- $5,603
Cash invested: $18,144 (down + closing). Projections, not guarantees.
Landlord ↔ Tenant lean methodology
- Overall (STATE)
- 73 Landlord-Friendly
- State Ohio
- 73 Landlord-Friendly · R+6
- County
- — inherits STATE
- City
- — inherits STATE
ZIP-level market 44667
- Home prices YoY
- -23.8%
- Active inventory
- 36
- Price-to-rent
- 6.2×
Monthly cashflow live
- Estimated rent
- $874 medium interval (Pro) →
- Mortgage (P&I)
- −$340
- Tax est. 1.5%
- −$81 /mo · $972/yr
- Insurance
- −$27
- HOA
- −$0
- Lot rent leased land?
- −$0
- Vacancy / Maint / Mgmt
- −$183
- Net cashflow
- $242
Break-even live
Sensitivity live
| Price | -10% $287 | -5% $265 | +0% $242 | +5% $220 | +10% $197 |
|---|---|---|---|---|---|
| Rent | -10% $173 | -5% $208 | +0% $242 | +5% $277 | +10% $311 |
| Rate | -1.0pp $275 | -0.5pp $259 | base $242 | +0.5pp $225 | +1.0pp $208 |
UW: 25.0% down · 7.5% · 30yr · 1.5% tax · 5.0% vac · 8.0% maint · 8.0% mgmt
Financing live
Cash to close
- Down payment
- $16,200
- Closing costs
- $1,944
- Reserves months
- —
- Total cash needed
- —
Loan-product check · same deal, 3 products live
Conventional
25% down · 7.5% · 30yr
- Down + closing
- —
- Monthly P&I
- —
- Monthly cashflow
- —
- DSCR
- —
- Eligible?
- —
Personal DTI + credit; lowest rate.
DSCR
20% down · 8.5% · 30yr
- Down + closing
- —
- Monthly P&I
- —
- Monthly cashflow
- —
- DSCR
- —
- Eligible?
- —
No personal income docs; deal must DSCR.
Hard money
10% down · 12.0% · 12mo
- Down + closing
- —
- Monthly P&I
- —
- Monthly cashflow
- —
- DSCR
- —
- Eligible?
- —
Short-term bridge; refi at stabilization.
Listing history 18 events
-
2026-06-22days on market $64,800 Active 247 DOM
-
2026-06-21days on market $64,800 Active 246 DOM
-
2026-06-21days on market $64,800 Active 245 DOM
-
2026-06-18days on market $64,800 Active 243 DOM
-
2026-06-17days on market $64,800 Active 242 DOM
-
2026-06-16days on market $64,800 Active 241 DOM
-
2026-06-15days on market $64,800 Active 240 DOM
-
2026-06-13days on market $64,800 Active 238 DOM
-
2026-06-12days on market $64,800 Active 237 DOM
-
2026-06-09days on market $64,800 Active 234 DOM
-
2026-06-08days on market $64,800 Active 233 DOM
-
2026-06-08days on market $64,800 Active 232 DOM
-
2026-06-07days on market $64,800 Active 231 DOM
-
2026-06-04days on market $64,800 Active 228 DOM
-
2026-06-02days on market $64,800 Active 227 DOM
-
2026-06-01days on market $64,800 Active 226 DOM
-
2026-05-31days on market $64,800 Active 225 DOM
-
2025-10-19$64,800 Active 169-char remark
Show marketing remark (169 chars)
Come tour this beautiful home! This 2 bedroom, 2 bathroom home includes wood kitchen cabinets, walk in closets and so much more. Call the office to book your tour today!
ⓘ Source: listings_history table (triggers on properties + properties_extension) + one-shot
backfill from property_details.listing_events for pre-trigger history.
Climate risk First Street
- Flood 1/10 Low FEMA zone X (unshaded) · 0% chance over 30 yrs
- Wildfire 1/10 Low
- Heat 3/10 Moderate 7 d/yr ≥97°F today · 16 d/yr by 30 yrs out
- Wind 2/10 Low 100% chance of damaging wind over 30 yrs
- Air quality 2/10 Low 0 unhealthy d/yr today · 1 by 30 yrs out
Nearby sold comps map
Loading sold comps map…
Walkable amenities ~0.75 mi
Loading nearby amenities…
Taxation est. · year 1
- Rental income
- $10,482
- − Mortgage interest
- −$3,630
- − Property taxes
- −$972
- − Insurance
- −$324
- − Repairs & maintenance
- −$839
- − Management
- −$839
- − Depreciation
- −$1,885
- Taxable income
- $1,994
- Est. tax owed @ 24.0%
- −$479
- After-tax cash flow
- $2,429/yr
For passive investors: Depreciation is non-cash, so a rental often shows a tax loss while cash-flowing — sheltering income. Rental losses are passive: they offset passive income freely, and up to $25,000/yr can offset ordinary (W-2) income if you actively participate and your MAGI is under $100k (phasing out to $0 by $150k); unused losses carry forward. On sale, claimed depreciation is recaptured at up to 25%, and gains may owe capital-gains tax (a 1031 exchange can defer both). Figures are a year-1 estimate at your 24.0% rate — not tax advice; consult a CPA.
Condition & rehab AI · 13 photos
This mobile home is in good condition with cosmetic updates needed. Painting the exterior siding and replacing the carpet can significantly increase its value.
Value-add opportunities
- Resale Paint exterior siding — Fresh paint can enhance curb appeal and home value
- Both Replace carpet in bedrooms — Carpet can be worn and replacing it can improve both resale and rental value
- Both Install new kitchen appliances — New appliances can make the kitchen more appealing and functional
Renovation cost estimate screening
Value-add ROI direction
- Resale Paint exterior siding — Fresh paint can enhance curb appeal and home value ↑
- Both Replace carpet in bedrooms — Carpet can be worn and replacing it can improve both resale and rental value ↑
- Both Install new kitchen appliances — New appliances can make the kitchen more appealing and functional ↑
ⓘ Cost ranges are severity-bucket heuristics (US national rule-of-thumb). Get contractor quotes + a written scope before underwriting a rehab budget.
Schools (NCES district)
- District
- Orrville City
- NCES district ID
- 3904461
- Math proficiency
- 65% ▼ -7.00%
- Reading proficiency
- 61% ▼ -4.00%
- Median HH income
- $46,347
- Composite
- 53.24/100
- National rank
- #1497
- State rank
- #251 of 656 in OH
Livability — Orrville
- Score
- 78/100
- State rank
- #161
- US rank
- #2403
Category grades
Schools grade is shown separately in the Schools card above.
Census & demographics
- County
- Wayne · 117,095 people
- City population
- 13,688
- Population (ZIP)
- 13,688
- Household income
- $72,402
- Rent vs Own
- Severe rent burden
- 6.0
Population outlook (Wayne County) Hauer SSP2
- Today (2025)
- 116,616 people
- By 2030
- 116,214 · -0.3%
- By 2040
- 113,891 · -2.3%
- By 2050
- 109,009 · -6.5%
- By 2075
- 94,622 · -18.9%
- By 2100
- 70,577 · -39.5%
Race, ethnicity, and origin ACS 2023
- Neighborhood character
- Predominantly White (87%)
- Race & ethnicity
- White 87% Hispanic / Latino 5% Black 4% Two or more races 2% Asian 2%
- Hispanic origin (detail)
- Mexican 4%
- Common ancestry
- Lithuanian 3% Italian 3% Romanian 2%
- Foreign-born
- 3% · Canada
- Languages at home
- 86% English-only · German/W. Germanic 8% Spanish 5%
Political lean MEDSL · Wayne
- 2024 margin
- Solid R (+39.3) · D 29.9% · R 69.2%
- 2008→2024 swing
- -24.6pp toward R · 2008: -14.6pp · 2024: -39.3pp
- All cycles
- 2024: R+39.3 2020: R+37.0 2016: R+34.9 2012: R+21.3 2008: R+14.6
Not yet ingested
- Civics
- —
Market trends
- HPI YoY
- ▼ -68.83%
- Current HPI
- 220.2626
- Rent YoY
- —
- Metro
- —
- State GDP YoY
- ▲ 1.98%
- F500 in state
- 48
Industry mix (Fortune 500 HQ in OH)
| Industry | F500 HQs | Revenue |
|---|---|---|
| Insurance | 3 | $145B |
|
||
| Industrial Machinery | 3 | $49B |
|
||
| Financial Services | 3 | $24B |
|
||
| Consumer Goods | 2 | $93B |
|
||
| Aerospace / Defense | 2 | $47B |
|
||
| Utilities | 2 | $33B |
|
||
Price history
1 event — show timeline
- 2025-10-19 Listed $64,800 Zillow
Cash-flow waterfall
monthlySold comps — $/sqft
last 12 mo · ≤1 miLoading sold comps…