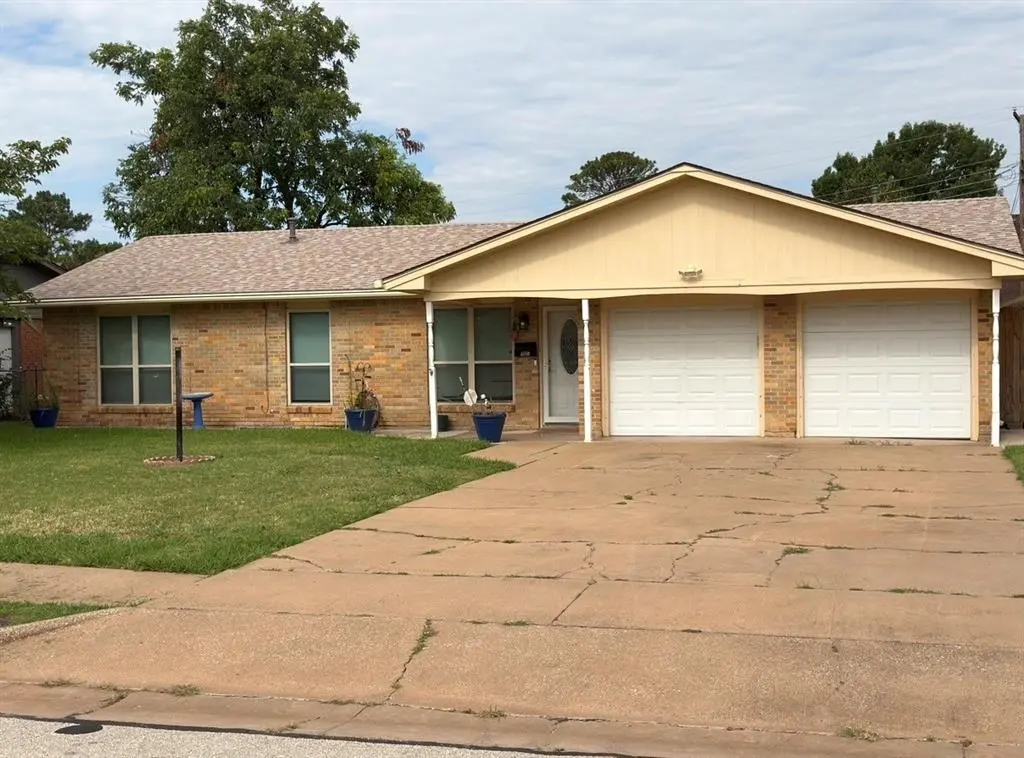
4650 Sierra Madre · Wichita Falls, TX
Flood risk 1/10 · Minimal
- FEMA flood zone
- X (unshaded)
- Chance of flooding over 30 yrs
- 0.0%
- Est. flood insurance / yr
- $507 – $1,088
Fire risk 8/10 · Major
- Est. fire insurance / yr
- $1,222 – $2,270
Heat risk 7/10 · Major
- Hot days now (above 109°F)
- 7 days/yr
- Hot days in 30 yrs
- 20 days/yr
Wind risk 4/10 · Minor
- Chance of severe wind over 30 yrs
- 8.0%
Air-quality risk 1/10 · Minimal
- Unhealthy air days now
- 0 days/yr
- Unhealthy air days in 30 yrs
- 0 days/yr
Risk factors via First Street. Map © Google.
Why this score? — see what drove the F grade
The composite is a weighted blend of 9 inputs, each scored 0–100. Each bar is that input's sub-score; the figure is the points it added to the 100-point composite (weight × sub-score).
- Cash flow +9.1/30.0
- Rent growth +4.5/5.0
- 1% rule +3.6/10.0
- Livability +3.5/5.0
- Schools +2.7/10.0
- DSCR +2.5/10.0
- Condition / age +2.5/5.0
- ARV discount +0.0/15.0
- Appreciation +0.0/10.0
$200,000
🖨 Deal sheet (PDF) 📄 Offer letter ✓ Due diligence
Listing remarks MLS
Totally remodeled in 2019! Open living area with gorgeous easy to clean wood-plank tile flooring & LED can lighting. Fresh & bright kitchen with granite countertops, stainless steel appliances, gas cook top, & glass backsplash. Burris Low E Energy Efficient windows w/ Lifetime Warranty. Spacious bedrooms w/ good-sized closets and carpet. Beautifully renovated bathrooms. Large privacy-fenced backyard. Roof replaced in 2019 w/ Class 4 architectural shingles. Freshly landscaped front yard. Jefferson/McNiel/Rider.
Key facts
- Brand new roof
- Generous patio slab
- 8,281 sq ft lot
Tags
Property features AI
Finance
- Other: Subdivision: UNIVERSITY PARK E1; County: Wichita; Country: United States
- Financial info: Treat as clear loan type; No second mortgage
- HOA & community: No association
Exterior
- Parking: Attached 2-car garage; Covered parking for 2; Driveway
- Security: Security system
- Utilities: City sewer; City water; Electricity available; Natural gas available; Not in a municipal utility district
- Home design: Single family residence; Residential property; Built in 1961; One story
- Construction: Shingle roof; No attached property (detached status: no)
- Exterior features: Wood fencing; Lot less than 0.5 acre
Interior
- Kitchen: Dishwasher; Gas oven; Refrigerator
- Bedrooms: 3 bedrooms (primary bedroom on main level)
- Bathrooms: 2 full bathrooms
- Interior features: Open floorplan; One level
Neighborhood map
What this means for you Summary
Snapshot
- This is a 3-bed/2.0-bath single-family listed at $200k.
Deal economics
- At list price, monthly cash flow is $-155 ($-2k/yr) — negative.
- To cash-flow at today's rent, offer at most $173k (13.7% below list).
- To meet the 1% rule (rent ≥ 1% of price), the offer needs to be $172k (13.8% below list).
- Recommended offer: $172k (13.8% below list) — sets the bar for 1% rule.
Location & tenants
- Location reads 69/100 on livability (#437 in TX) — a middle-class / working-renter tenant base. Strengths: cost of living A+, housing A+; Watch: health & safety C-, employment D+, crime D.
- Wichita Falls ISD (urban): math 31% / reading 33% proficiency, ranked #585 of 826 in TX (top 71%) — families likely to look elsewhere, expect single-tenant / working-renter base with shorter leases.
- Zoned schools: Jefferson El (math 27% / reading 27%, grade F, #2,791 of 4,322 statewide, top 68%, 382 students, 63% FRL).
- Market conditions: Rents rising fast (+7.8%/yr); 151 active listings in the ZIP; 3 comparable units currently listed for rent nearby; rentals lingering (median 46d on market — plan ~5-8 weeks vacancy on turnover, expect pricing pressure); 100% of comp listings sitting > 30 days — soft ceiling on asking rent; solid renter incomes; 231 units permitted in Wichita County in 2024 (10 in 5+ unit buildings).
Forward outlook
- Local home prices are declining (-3.0%/yr); year-one equity from $1k of loan paydown is wiped out by about $6k of value loss. Plan a longer hold.
- Wichita County population projected to shrink 7% by 2050 — rents likely to lag national; underwrite the cash flow, not the appreciation.
Negotiation context
- Only 5 days on market — expect competitive offers; lowballing is unlikely to land.
- 3 sale attempts since 7y ago with the ask held roughly flat each time — persistent listings suggest the price (not the market) is what's stuck; bring a comps-based counter.
Risks & watch-outs
- Climate carrying-cost: severe wildfire risk; extreme-heat days projected 7→20/yr by 2055 (HVAC capex compounding) — expect insurance premiums to compound above CPI over the hold.
Questions for the listing agent
- What do current leases actually rent for vs. the listed asking? Can we see a recent rent roll and the last 12 months of T-12 income?
- Built in 1961 — when were the roof, HVAC, electrical panel, plumbing, and water heater last replaced?
- Is there a deadline driving the sale (1031 exchange, divorce, estate, relocation)? That informs how much negotiation room exists.
- Schools are D-rated, which usually means shorter tenancies and higher turnover. Who's the typical renter profile here, and what's been the actual vacancy rate?
- Crime grade is D in this area — have there been break-ins, vandalism, or insurance claims at this property in the last 3 years? What carrier currently insures it and at what premium?
- The area grade is low — what's the realistic commute time and amenity access for the typical tenant pool here? Any planned neighborhood developments (good or bad) we should know about?
- What's the average days-on-market for RENTAL listings here right now (not sales)? A rising rental-DOM trend means longer vacancies and softer asking-rent achievability than the comps imply.
- What's the recent tenant-quality profile in this submarket — average credit score on applications, eviction rate, late-payment / NSF rate, and stable-employment percentage? A property-management company in the area should have these aggregated.
- How much new for-sale + rental construction is in the pipeline within 1–3 miles? Heavy new supply typically softens prices + rents 12–24 months out; constrained supply supports both.
Investment metrics
- 1% rule
- 0.86% ✗
- Cap rate
- 5.37%
- Cash-on-cash
- -3.31%
- DSCR
- 0.85
- GRM
- 9.7
CMA / ARV
- ARV (on-the-fly)
- $164,832
- Comps found
- 4
Show comp detail 4 sales within ~0.75 mi
| Address | Dist | Beds/Ba | Sqft | Sold | Price | $/sf | Match |
|---|---|---|---|---|---|---|---|
| 4665 Sierra Madre | 0.06mi | 3/2.0 | 1,231 (+2%) | 15mo | $189,900 | $154 | 82 |
| 4661 Briarwood Dr | 0.41mi | 3/2.0 | 1,116 (-8%) | 6mo | $149,500 | $134 | 62 |
| 5140 Kingston Dr | 0.42mi | 3/1.0 | 1,248 (+3%) | 11mo | $144,900 | $116 | 62 |
| 1 Daisy Cir | 0.68mi | 3/2.0 | 1,165 (-4%) | 3mo | $157,900 | $136 | 59 |
Match score weights: distance 35% · size 25% · config 20% · recency 20%. Top-matched comps best support the ARV.
Projected returns pro-forma
-3.0% appreciation · 7.83% rent growth · sell at horizon
- IRR
- -16.0%
- Equity multiple
- 0.40×
- Total profit
- $-33,361
- Equity at exit
- $29,821
- IRR
- -0.3%
- Equity multiple
- 0.97×
- Total profit
- $-1,443
- Equity at exit
- $17,292
Cash invested: $56,000 (down + closing). Projections, not guarantees.
Landlord ↔ Tenant lean methodology
- Overall (STATE)
- 87 Strongly Landlord-Friendly
- State Texas
- 87 Strongly Landlord-Friendly · R+5
- County
- — inherits STATE
- City
- — inherits STATE
ZIP-level market 76310
- Home prices YoY
- -25.9%
- Rents YoY
- 7.8%
- Active inventory
- 151
- Price-to-rent
- 9.7×
Monthly cashflow live
- Estimated rent
- $1,724 medium interval (Pro) →
- Mortgage (P&I)
- −$1,049
- Tax from tax record
- −$384 /mo · $4,612/yr
- Insurance
- −$83
- HOA
- −$0
- Vacancy / Maint / Mgmt
- −$362
- Net cashflow
- $-155
Break-even live
Sensitivity live
| Price | -10% $-41 | -5% $-98 | +0% $-155 | +5% $-211 | +10% $-268 |
|---|---|---|---|---|---|
| Rent | -10% $-291 | -5% $-223 | +0% $-155 | +5% $-87 | +10% $-18 |
| Rate | -1.0pp $-54 | -0.5pp $-104 | base $-155 | +0.5pp $-206 | +1.0pp $-259 |
UW: 25.0% down · 7.5% · 30yr · 1.5% tax · 5.0% vac · 8.0% maint · 8.0% mgmt
Financing live
Cash to close
- Down payment
- $50,000
- Closing costs
- $6,000
- Reserves months
- —
- Total cash needed
- —
Loan-product check · same deal, 3 products live
Conventional
25% down · 7.5% · 30yr
- Down + closing
- —
- Monthly P&I
- —
- Monthly cashflow
- —
- DSCR
- —
- Eligible?
- —
Personal DTI + credit; lowest rate.
DSCR
20% down · 8.5% · 30yr
- Down + closing
- —
- Monthly P&I
- —
- Monthly cashflow
- —
- DSCR
- —
- Eligible?
- —
No personal income docs; deal must DSCR.
Hard money
10% down · 12.0% · 12mo
- Down + closing
- —
- Monthly P&I
- —
- Monthly cashflow
- —
- DSCR
- —
- Eligible?
- —
Short-term bridge; refi at stabilization.
Rent comps 3 comps
| Address | Beds | Baths | Sqft | Rent | $/sqft | DOM | Units | Dist |
|---|---|---|---|---|---|---|---|---|
| 5313 Langford Ln Wichita Falls, TX | 3.0 | 2.0 | 1092 | $1,650 | $1.51 | 45d | 1 | 0.79mi |
| 4111 McGaha Ave Wichita Falls, TX | 3.0 | 2.0 | 1025 | $1,125 | $1.10 | 45d | 1 | 1.30mi |
| 5114 Fairway Blvd Wichita Falls, TX | 4.0 | 2.0 | 1406 | $1,600 | $1.14 | 45d | 1 | 1.41mi |
Listing history 5 events
-
2026-06-22days on market $200,000 Active 5 DOM
-
2026-06-19days on market $200,000 Active 3 DOM
-
2026-06-18days on market $200,000 Active 2 DOM
-
2026-06-17remarks 645-char remark
-
2026-06-17$200,000 Active 1 DOM
ⓘ Source: listings_history table (triggers on properties + properties_extension) + one-shot
backfill from property_details.listing_events for pre-trigger history.
Tax reassessment forecast TX · Resets to sale price
- Current annual tax
- $4,612 · $384/mo
- Projected year-2 tax
- $4,612 · $384/mo
- Expected delta
- $0/yr ($0/mo · 0.0%)
ⓘ Screening estimate from a state-policy table — verify with the county assessor before closing.
Climate risk First Street
- Flood 1/10 Low FEMA zone X (unshaded) · 0% chance over 30 yrs
- Wildfire 8/10 Severe
- Heat 7/10 Severe 7 d/yr ≥109°F today · 20 d/yr by 30 yrs out
- Wind 4/10 Moderate 8% chance of damaging wind over 30 yrs
- Air quality 1/10 Low 0 unhealthy d/yr today · 0 by 30 yrs out
Nearby sold comps map
Loading sold comps map…
Walkable amenities ~0.75 mi
Loading nearby amenities…
Taxation est. · year 1
- Rental income
- $20,687
- − Mortgage interest
- −$11,203
- − Property taxes
- −$4,612
- − Insurance
- −$1,000
- − Repairs & maintenance
- −$1,655
- − Management
- −$1,655
- − Depreciation
- −$5,818
- Taxable loss
- −$5,256
- Est. tax savings @ 24.0%
- +$1,262
- After-tax cash flow
- $-594/yr
For passive investors: Depreciation is non-cash, so a rental often shows a tax loss while cash-flowing — sheltering income. Rental losses are passive: they offset passive income freely, and up to $25,000/yr can offset ordinary (W-2) income if you actively participate and your MAGI is under $100k (phasing out to $0 by $150k); unused losses carry forward. On sale, claimed depreciation is recaptured at up to 25%, and gains may owe capital-gains tax (a 1031 exchange can defer both). Figures are a year-1 estimate at your 24.0% rate — not tax advice; consult a CPA.
Schools (NCES district)
- District
- Wichita Falls ISD
- NCES district ID
- 4845780
- Math proficiency
- 31% ▼ -10.00%
- Reading proficiency
- 33% ▼ -7.00%
- Median HH income
- $41,604
- Composite
- 27.06/100
- National rank
- #7051
- State rank
- #585 of 826 in TX
Livability — Wichita Falls
- Score
- 69/100
- State rank
- #437
- US rank
- #8940
Category grades
Schools grade is shown separately in the Schools card above.
Census & demographics
- Census place
- Wichita Falls, TX
- County
- Wichita County · 95,694 people
- City population
- 95,694
- Metro
- Wichita Falls, TX
- Population (ZIP)
- 19,029
- Household income
- $82,183
- Rent vs Own
- Severe rent burden
- 263.0
Population outlook (Wichita County) Hauer SSP2
- Today (2025)
- 129,638 people
- By 2030
- 128,366 · -1.0%
- By 2040
- 124,466 · -4.0%
- By 2050
- 120,499 · -7.0%
- By 2075
- 113,884 · -12.2%
- By 2100
- 101,818 · -21.5%
Race, ethnicity, and origin ACS 2023
- Neighborhood character
- Predominantly White (70%)
- Race & ethnicity
- White 70% Hispanic / Latino 13% Two or more races 10% Black 6% Asian 5%
- Hispanic origin (detail)
- Mexican 11%
- Common ancestry
- Italian 3% Lithuanian 2% Iranian 2%
- Foreign-born
- 6% · Canada, Vietnam, South Korea
- Languages at home
- 89% English-only · Spanish 6% Other Indo-European 1% Vietnamese 1%
Political lean MEDSL · Wichita
- 2024 margin
- Solid R (+44.0) · D 27.5% · R 71.5%
- 2008→2024 swing
- -5.2pp toward R · 2008: -38.9pp · 2024: -44.0pp
- All cycles
- 2024: R+44.0 2020: R+41.1 2016: R+49.7 2012: R+47.1 2008: R+38.9
Not yet ingested
- Civics
- —
Market trends
- HPI YoY
- ▼ -61.37%
- Current HPI
- 176.0321
- Rent YoY
- ▲ 7.83%
- Metro
- Wichita Falls, TX
- State GDP YoY
- ▲ 3.95%
- F500 in state
- 110
Industry mix (Fortune 500 HQ in TX)
| Industry | F500 HQs | Revenue |
|---|---|---|
| Energy | 16 | $1,198B |
|
||
| Technology | 5 | $198B |
|
||
| Engineering / Construction | 4 | $72B |
|
||
| Energy Services | 3 | $60B |
|
||
| Utilities | 3 | $41B |
|
||
| Healthcare | 2 | $330B |
|
||
Price history
+43.4% since first listed9 events — show timeline
- 2026-06-16 Listed $200,000 NTREIS
- 2020-06-30 Sold (Public Records) — Public Records
- 2020-06-30 Sold (MLS) — WFAOR
- 2020-05-26 Listed $149,900 WFAOR
- 2019-09-10 Sold (Public Records) — Public Records
- 2019-09-10 Sold (MLS) — WFAOR
- 2019-07-26 Listed $139,500 WFAOR
- 2006-07-18 Sold (Public Records) — Public Records
- 2006-07-18 Sold (Public Records) — Public Records
Property tax history
+8.9%/yrLatest (2025): $4,612 · +6.1% YoY. Source: county tax records.
Cash-flow waterfall
monthlySold comps — $/sqft
last 12 mo · ≤1 miLoading sold comps…