530 Wilkins Ford Rd · Fingerville, SC
Flood risk 1/10 · Minimal
- FEMA flood zone
- X (unshaded)
- Chance of flooding over 30 yrs
- 0.0%
- Est. flood insurance / yr
- $507 – $1,088
Fire risk 5/10 · Moderate
- Est. fire insurance / yr
- $783 – $1,453
Heat risk 6/10 · Moderate
- Hot days now (above 106°F)
- 7 days/yr
- Hot days in 30 yrs
- 17 days/yr
Wind risk 2/10 · Minimal
- Chance of severe wind over 30 yrs
- 0.0%
Air-quality risk 3/10 · Minor
- Unhealthy air days now
- 3 days/yr
- Unhealthy air days in 30 yrs
- 3 days/yr
Risk factors via First Street. Map © Google.
Why this score? — see what drove the C+ grade
The composite is a weighted blend of 9 inputs, each scored 0–100. Each bar is that input's sub-score; the figure is the points it added to the 100-point composite (weight × sub-score).
- Cash flow +22.4/30.0
- ARV discount +15.0/15.0
- DSCR +7.2/10.0
- 1% rule +5.9/10.0
- Schools +4.5/10.0
- Rent growth +2.9/5.0
- Condition / age +2.5/5.0
- Livability +1.6/5.0
- Appreciation +0.0/10.0
$124,500
🖨 Deal sheet (PDF) 📄 Offer letter ✓ Due diligence
Listing remarks
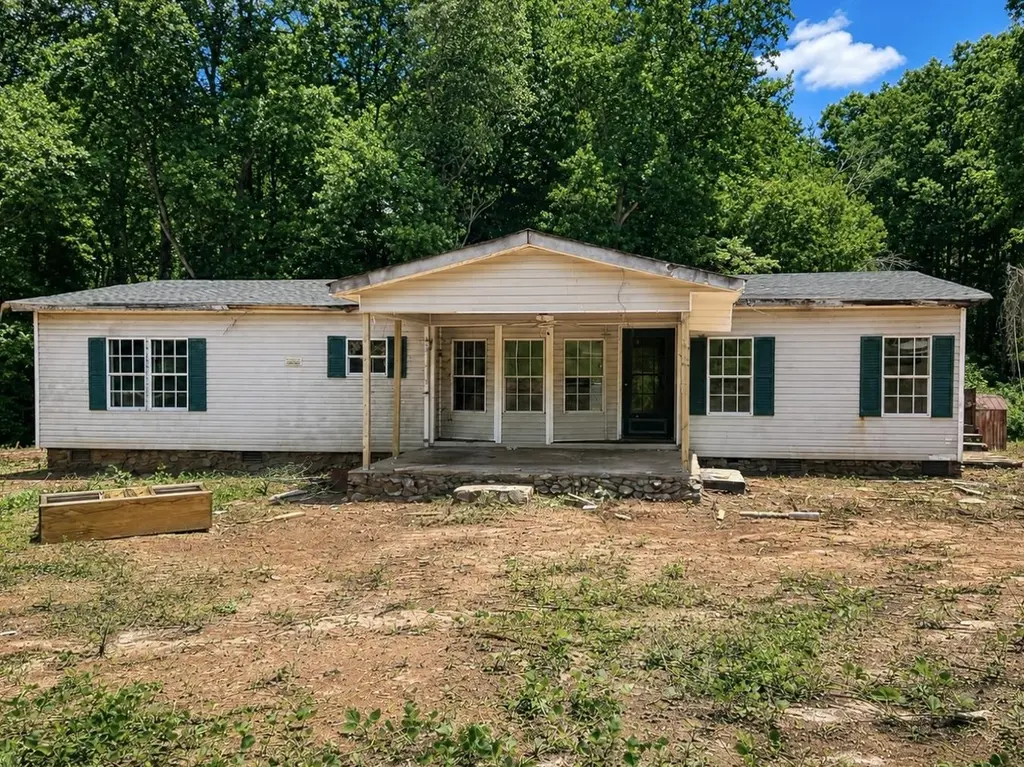
Great opportunity to transform this property into a beautiful home! Situated on approximately 0.50 acres, this property offers a peaceful setting with plenty of potential. The lot also includes a detached metal storage shed for additional storage or workspace. Conveniently located with easy access to major roads and nearby amenities while still offering a private, country setting atmosphere. Perfect opportunity for investors, renovators, or buyers looking to create their own vision.
Key facts
- 0.5 acre lot
- Built 1997
- Listed 18 days
Tags
Property features AI
Exterior
- Parking: Driveway
- Home design: Residential mobile home; One-story
- Construction: Vinyl siding
- Exterior features: Deck; Porch; Outbuilding; Level and wooded lot
Interior
- Bathrooms: 2 full bathrooms
- Interior features: No basement
Neighborhood map
What this means for you Summary
Snapshot
- This is a 3-bed/2.0-bath manufactured listed at $124k.
Deal economics
- At list price, monthly cash flow is $208 ($2k/yr) — positive.
- The deal already cash-flows at list — no discount required.
- Meets the 1% rule at list price ($1k rent vs $124k).
- Recommended offer: $123k (1.5% below list) — sets the bar for market timing.
- Cap rate 8.3% vs local median 3.4% in Fingerville — top-decile yield for the area; either an underpriced asset or a hidden risk that comps aren't pricing in. Stress-test before assuming the spread holds.
Location & tenants
- Location reads 32/100 on livability (#396 in SC) — a limited-amenity area; tenant pool skews transient or value-seeking. Strengths: cost of living A+, crime A; Watch: amenities F, commute F, employment F.
- Spartanburg 02 (suburban): math 49% / reading 56% proficiency, ranked #6 of 80 in SC (top 8%) — acceptable for families but not a draw, mixed tenant base, ~2y average lease.
- Zoned schools: Cooley Springs-Fingerville Elementary (math 67% / reading 67%, grade B+, #45 of 597 statewide, top 8%, 391 students, 77% FRL); Rainbow Lake Middle (math 37% / reading 46%, grade F, #68 of 229 statewide, top 31%, 1,009 students, 69% FRL); Boiling Springs High (math 62% / reading 88%, grade A-, #37 of 196 statewide, top 18%, 2,671 students, 60% FRL) — zoned schools average 68% FRL vs 44% district-wide (24 pts higher); higher-poverty schools than district average — tighter screening recommended.
- Market conditions: Rents rising (+1.8%/yr); 701 active listings in the ZIP; 1 comparable units currently listed for rent nearby; solid renter incomes; 3,129 units permitted in Spartanburg County in 2024 (40 in 5+ unit buildings).
Forward outlook
- Local home prices are declining (-3.0%/yr); year-one equity from $861 of loan paydown is wiped out by about $4k of value loss. Plan a longer hold.
- Spartanburg County population projected at +18% by 2050 — long-run rental-demand tailwind backs the buy-and-hold thesis.
Negotiation context
- It's been on market 18 days — a 2% lower offer ($123k) is reasonable based on typical stale-listing flexibility.
- 2 sale attempts since 23y ago with the ask held roughly flat each time — persistent listings suggest the price (not the market) is what's stuck; bring a comps-based counter.
Risks & watch-outs
- Climate carrying-cost: moderate wildfire risk; extreme-heat days projected 7→17/yr by 2055 (HVAC capex compounding) — expect insurance premiums to compound above CPI over the hold.
Questions for the listing agent
- Is there a deadline driving the sale (1031 exchange, divorce, estate, relocation)? That informs how much negotiation room exists.
- Schools are F-rated, which usually means shorter tenancies and higher turnover. Who's the typical renter profile here, and what's been the actual vacancy rate?
- What's the average days-on-market for RENTAL listings here right now (not sales)? A rising rental-DOM trend means longer vacancies and softer asking-rent achievability than the comps imply.
- What's the recent tenant-quality profile in this submarket — average credit score on applications, eviction rate, late-payment / NSF rate, and stable-employment percentage? A property-management company in the area should have these aggregated.
- How much new for-sale + rental construction is in the pipeline within 1–3 miles? Heavy new supply typically softens prices + rents 12–24 months out; constrained supply supports both.
Investment metrics
- 1% rule
- 1.09% ✓
- Cap rate
- 8.29%
- Cash-on-cash
- 7.15%
- DSCR
- 1.32
- GRM
- 7.7
CMA / ARV
- ARV (on-the-fly)
- $219,520
- Comps found
- 1
Show comp detail 1 sale within ~0.75 mi
| Address | Dist | Beds/Ba | Sqft | Sold | Price | $/sf | Match |
|---|---|---|---|---|---|---|---|
| 305 Wilkins Ford Rd | 0.14mi | 4/2.0 (+1) | 1,680 (+7%) | 8mo | $235,000 | $140 | 69 |
Match score weights: distance 35% · size 25% · config 20% · recency 20%. Top-matched comps best support the ARV.
Projected returns pro-forma
-3.0% appreciation · 1.79% rent growth · sell at horizon
- IRR
- -6.7%
- Equity multiple
- 0.75×
- Total profit
- $-8,551
- Equity at exit
- $18,563
- IRR
- 1.4%
- Equity multiple
- 1.09×
- Total profit
- $3,158
- Equity at exit
- $10,764
Cash invested: $34,860 (down + closing). Projections, not guarantees.
Landlord ↔ Tenant lean methodology
- Overall (STATE)
- 90 Strongly Landlord-Friendly
- State South Carolina
- 90 Strongly Landlord-Friendly · R+6
- County
- — inherits STATE
- City
- — inherits STATE
ZIP-level market 29349
- Home prices YoY
- -31.8%
- Rents YoY
- 1.8%
- Active inventory
- 701
- Price-to-rent
- 7.7×
Monthly cashflow live
- Estimated rent
- $1,352 medium interval (Pro) →
- Mortgage (P&I)
- −$653
- Tax est. 1.5%
- −$156 /mo · $1,868/yr
- Insurance
- −$52
- HOA
- −$0
- Lot rent leased land?
- −$0
- Vacancy / Maint / Mgmt
- −$284
- Net cashflow
- $208
Break-even live
Sensitivity live
| Price | -10% $294 | -5% $251 | +0% $208 | +5% $165 | +10% $122 |
|---|---|---|---|---|---|
| Rent | -10% $101 | -5% $154 | +0% $208 | +5% $261 | +10% $315 |
| Rate | -1.0pp $270 | -0.5pp $239 | base $208 | +0.5pp $175 | +1.0pp $143 |
UW: 25.0% down · 7.5% · 30yr · 1.5% tax · 5.0% vac · 8.0% maint · 8.0% mgmt
Financing live
Cash to close
- Down payment
- $31,125
- Closing costs
- $3,735
- Reserves months
- —
- Total cash needed
- —
Loan-product check · same deal, 3 products live
Conventional
25% down · 7.5% · 30yr
- Down + closing
- —
- Monthly P&I
- —
- Monthly cashflow
- —
- DSCR
- —
- Eligible?
- —
Personal DTI + credit; lowest rate.
DSCR
20% down · 8.5% · 30yr
- Down + closing
- —
- Monthly P&I
- —
- Monthly cashflow
- —
- DSCR
- —
- Eligible?
- —
No personal income docs; deal must DSCR.
Hard money
10% down · 12.0% · 12mo
- Down + closing
- —
- Monthly P&I
- —
- Monthly cashflow
- —
- DSCR
- —
- Eligible?
- —
Short-term bridge; refi at stabilization.
Rent comps 1 comps
| Address | Beds | Baths | Sqft | Rent | $/sqft | DOM | Units | Dist |
|---|---|---|---|---|---|---|---|---|
| 1010 Burnt Chimney Rd Campobello, SC | 3.0 | 2.0 | 1854 | $1,649 | $0.89 | 21d | 1 | 1.39mi |
Listing history 13 events
-
2026-06-21days on market $124,500 Active 18 DOM
-
2026-06-18days on market $124,500 Active 15 DOM
-
2026-06-17days on market $124,500 Active 14 DOM
-
2026-06-16days on market $124,500 Active 13 DOM
-
2026-06-15days on market $124,500 Active 12 DOM
-
2026-06-14days on market $124,500 Active 10 DOM
-
2026-06-13days on market $124,500 Active 9 DOM
-
2026-06-10days on market $124,500 Active 7 DOM
-
2026-06-09days on market $124,500 Active 6 DOM
-
2026-06-08days on market $124,500 Active 5 DOM
-
2026-06-07days on market $124,500 Active 4 DOM
-
2026-06-05remarks 487-char remark
-
2026-06-05$124,500 Active 1 DOM
ⓘ Source: listings_history table (triggers on properties + properties_extension) + one-shot
backfill from property_details.listing_events for pre-trigger history.
Climate risk First Street
- Flood 1/10 Low FEMA zone X (unshaded) · 0% chance over 30 yrs
- Wildfire 5/10 Major
- Heat 6/10 Major 7 d/yr ≥106°F today · 17 d/yr by 30 yrs out
- Wind 2/10 Low 0% chance of damaging wind over 30 yrs
- Air quality 3/10 Moderate 3 unhealthy d/yr today · 3 by 30 yrs out
Nearby sold comps map
Loading sold comps map…
Walkable amenities ~0.75 mi
Loading nearby amenities…
Taxation est. · year 1
- Rental income
- $16,224
- − Mortgage interest
- −$6,974
- − Property taxes
- −$1,868
- − Insurance
- −$622
- − Repairs & maintenance
- −$1,298
- − Management
- −$1,298
- − Depreciation
- −$3,622
- Taxable income
- $543
- Est. tax owed @ 24.0%
- −$130
- After-tax cash flow
- $2,362/yr
For passive investors: Depreciation is non-cash, so a rental often shows a tax loss while cash-flowing — sheltering income. Rental losses are passive: they offset passive income freely, and up to $25,000/yr can offset ordinary (W-2) income if you actively participate and your MAGI is under $100k (phasing out to $0 by $150k); unused losses carry forward. On sale, claimed depreciation is recaptured at up to 25%, and gains may owe capital-gains tax (a 1031 exchange can defer both). Figures are a year-1 estimate at your 24.0% rate — not tax advice; consult a CPA.
Schools (NCES district)
- District
- Spartanburg 02
- NCES district ID
- 4503510
- Math proficiency
- 49% ▼ -7.00%
- Reading proficiency
- 56% ▲ 2.00%
- Median HH income
- $49,591
- Composite
- 44.79/100
- National rank
- #2742
- State rank
- #6 of 80 in SC
Livability — Fingerville
- Score
- 32/100
- State rank
- #396
- US rank
- #27829
Category grades
Schools grade is shown separately in the Schools card above.
Census & demographics
- County
- Spartanburg County · 258,607 people
- City population
- 66
- Metro
- Spartanburg, SC
- Population (ZIP)
- 39,083
- Household income
- $76,168
- Rent vs Own
- Severe rent burden
- 271.0
Population outlook (Spartanburg County) Hauer SSP2
- Today (2025)
- 325,495 people
- By 2030
- 338,800 · +4.1%
- By 2040
- 363,471 · +11.7%
- By 2050
- 384,156 · +18.0%
- By 2075
- 430,137 · +32.1%
- By 2100
- 442,733 · +36.0%
Race, ethnicity, and origin ACS 2023
- Neighborhood character
- Predominantly White (80%)
- Race & ethnicity
- White 80% Black 9% Hispanic / Latino 6% Two or more races 4% Asian 2%
- Hispanic origin (detail)
- Mexican 5%
- Common ancestry
- Subsaharan African 6% Serbian 3% Scotch-Irish 3%
- Foreign-born
- 9% · Canada
- Languages at home
- 86% English-only · Russian/Polish/Slavic 7% Spanish 3% Other Asian/Pacific 2%
Political lean MEDSL · Spartanburg
- 2024 margin
- Solid R (+33.6) · D 32.6% · R 66.2% · Other 1.2%
- 2008→2024 swing
- -12.0pp toward R · 2008: -21.6pp · 2024: -33.6pp
- All cycles
- 2024: R+33.6 2020: R+27.3 2016: R+30.0 2012: R+23.1 2008: R+21.6
Not yet ingested
- Civics
- —
Market trends
- HPI YoY
- ▼ -113.67%
- Current HPI
- 244.0359
- Rent YoY
- ▲ 1.79%
- Metro
- Spartanburg, SC
- State GDP YoY
- ▲ 4.51%
- F500 in state
- 2
Industry mix (Fortune 500 HQ in SC)
| Industry | F500 HQs | Revenue |
|---|---|---|
| Packaging | 1 | $7B |
|
||
Price history
+246.8% since first listed6 events — show timeline
- 2026-06-03 Listed $124,500 SPMLS
- 2026-03-23 Sold (Public Records) $175,000 Public Records
- 2004-06-22 Sold (Public Records) $64,000 Public Records
- 2004-06-21 Sold (MLS) $64,000 SPMLS
- 2003-07-07 Listed $67,000 SPMLS
- 1993-04-01 Sold (Public Records) $35,900 Public Records
Property tax history
-0.3%/yrLatest (2025): $227 · +8.3% YoY. Source: county tax records.
Cash-flow waterfall
monthlySold comps — $/sqft
last 12 mo · ≤1 miLoading sold comps…