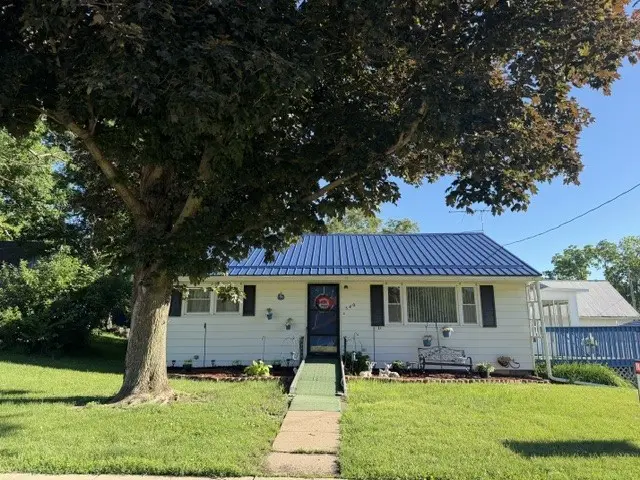
540 E Linn St · Coggon, IA
Flood risk 1/10 · Minimal
- FEMA flood zone
- X (unshaded)
- Chance of flooding over 30 yrs
- 0.0%
- Est. flood insurance / yr
- $473 – $860
Fire risk 1/10 · Minimal
- Est. fire insurance / yr
- $902 – $1,676
Heat risk 2/10 · Minimal
- Hot days now (above 101°F)
- 7 days/yr
- Hot days in 30 yrs
- 15 days/yr
Wind risk 2/10 · Minimal
- Chance of severe wind over 30 yrs
- —
Air-quality risk 1/10 · Minimal
- Unhealthy air days now
- 0 days/yr
- Unhealthy air days in 30 yrs
- 0 days/yr
Risk factors via First Street. Map © Google.
Why this score? — see what drove the F grade
The composite is a weighted blend of 9 inputs, each scored 0–100. Each bar is that input's sub-score; the figure is the points it added to the 100-point composite (weight × sub-score).
- Appreciation +10.0/10.0
- Schools +6.5/10.0
- Cash flow +6.3/30.0
- Livability +3.8/5.0
- Rent growth +2.5/5.0
- Condition / age +2.5/5.0
- 1% rule +0.9/10.0
- ARV discount +0.7/15.0
- DSCR +0.6/10.0
$165,000
🖨 Deal sheet (PDF) 📄 Offer letter ✓ Due diligence
Listing remarks MLS
This charming ranch located just 20 minutes from Marion is a must see! Third bedroom has been converted into a main floor laundry and could easily be converted back to a bedroom. This home has so much to offer a first time home buyer - sunroom, deck, eat-in kitchen with built-ins all on a nearly 1/2 acre lot. The barn/garage is perfect for your hobbies. The basement is dry and just waiting for your finishing touches. Enjoy your scenic drive to Coggon.
Key facts
- 0.49 acre lot
- Garage
- Built 1955
Property features AI
Exterior
- Parking: Detached garage; Garage with door opener; Carport; 1 garage space
- Utilities: Public water; Public sewer
- Home design: Single family residence; Residential property type
- Construction: Frame construction; Vinyl siding
- Exterior features: Deck; Fenced yard; Outbuilding
Interior
- Kitchen: Range; Range hood; Dishwasher; Garbage disposal; Refrigerator; Gas water heater
- Bedrooms: 5 total rooms (includes bedrooms and living spaces)
- Bathrooms: 2 full bathrooms
- Heating & cooling: Natural gas heating; Central air conditioning
- Interior features: Accessible entrance; Full basement
- Laundry & utility: Washer; Dryer
Neighborhood map
What this means for you Summary
Snapshot
- This is a 3-bed/1.5-bath single-family listed at $165k.
Deal economics
- At list price, monthly cash flow is $-297 ($-4k/yr) — negative.
- To cash-flow at today's rent, offer at most $113k (31.8% below list).
- To meet the 1% rule (rent ≥ 1% of price), the offer needs to be $97k (41.3% below list).
- Recommended offer: $97k (41.3% below list) — sets the bar for 1% rule.
Location & tenants
- Location reads 76/100 on livability (#196 in IA, #3,575 nationally) — a middle-class / working-renter tenant base. Strengths: employment A+, cost of living A+, housing A+; Watch: amenities F, commute F.
- North Linn Community School District (rural): math 73% / reading 77% proficiency, ranked #62 of 289 in IA (top 22%) — strong family-tenant draw, lease renewals of 3-5y typical; only 16% free/reduced lunch — higher-income household profile.
- Zoned schools: North Linn Elementary (math 77% / reading 62%, grade A-, #224 of 616 statewide, top 42%, 274 students, 24% FRL); North-Linn Middle School (math 72% / reading 77%, grade A, #76 of 246 statewide, top 33%, 95 students, 20% FRL).
- Market conditions: 17 active listings in the ZIP; 1,023 units permitted in Linn County in 2024 (456 in 5+ unit buildings).
Forward outlook
- In year one you build about $18k of equity ($1k loan paydown + $16k appreciation (10.0% local appreciation)).
- Linn County population projected at +16% by 2050 — long-run rental-demand tailwind backs the buy-and-hold thesis.
- By year 3, paydown + projected appreciation supports a ~$45k cash-out refi (75% LTV) — recoverable capital for the next deal without selling this one.
Negotiation context
- Only 2 days on market — expect competitive offers; lowballing is unlikely to land.
- 2 sale attempts since 8y ago with the ask held roughly flat each time — persistent listings suggest the price (not the market) is what's stuck; bring a comps-based counter.
- Current owner paid $86k; list at $165k implies a 92% gain — meaningful room to come down on a strong offer.
Risks & watch-outs
- Watch-outs: built in 1955 — expect roof / HVAC / electrical / plumbing capex.
Questions for the listing agent
- What do current leases actually rent for vs. the listed asking? Can we see a recent rent roll and the last 12 months of T-12 income?
- Built in 1955 — when were the roof, HVAC, electrical panel, plumbing, and water heater last replaced?
- Is there a deadline driving the sale (1031 exchange, divorce, estate, relocation)? That informs how much negotiation room exists.
- Schools are B-rated — typically a magnet for longer-tenancy family renters. What's the average tenant stay here, and is there a school-zone premium baked into asking?
- The area grade is low — what's the realistic commute time and amenity access for the typical tenant pool here? Any planned neighborhood developments (good or bad) we should know about?
- What's the average days-on-market for RENTAL listings here right now (not sales)? A rising rental-DOM trend means longer vacancies and softer asking-rent achievability than the comps imply.
- What's the recent tenant-quality profile in this submarket — average credit score on applications, eviction rate, late-payment / NSF rate, and stable-employment percentage? A property-management company in the area should have these aggregated.
- How much new for-sale + rental construction is in the pipeline within 1–3 miles? Heavy new supply typically softens prices + rents 12–24 months out; constrained supply supports both.
Investment metrics
- 1% rule
- 0.59% ✗
- Cap rate
- 4.14%
- Cash-on-cash
- -7.70%
- DSCR
- 0.66
- GRM
- 14.2
CMA / ARV
- ARV (on-the-fly)
- $143,208
- Comps found
- 4
Show comp detail 4 sales within ~0.75 mi
| Address | Dist | Beds/Ba | Sqft | Sold | Price | $/sf | Match |
|---|---|---|---|---|---|---|---|
| 321 S 3rd St | 0.26mi | 3/1.0 | 967 (+3%) | 2mo | $147,500 | $153 | 79 |
| 215 2nd St N | 0.28mi | 2/1.0 (-1) | 1,061 (+13%) | 4mo | $114,500 | $108 | 54 |
| 520 2nd Ave E | 0.10mi | 2/1.0 (-1) | 1,044 (+12%) | 18mo | $170,500 | $163 | 54 |
| 417 2nd St St S | 0.38mi | 3/1.5 | 1,055 (+13%) | 12mo | $78,000 | $74 | 51 |
Match score weights: distance 35% · size 25% · config 20% · recency 20%. Top-matched comps best support the ARV.
Projected returns pro-forma
10.0% appreciation · 3.0% rent growth · sell at horizon
- IRR
- 18.8%
- Equity multiple
- 2.54×
- Total profit
- $70,937
- Equity at exit
- $148,645
- IRR
- 17.4%
- Equity multiple
- 5.84×
- Total profit
- $223,688
- Equity at exit
- $320,559
Cash invested: $46,200 (down + closing). Projections, not guarantees.
Landlord ↔ Tenant lean methodology
- Overall (STATE)
- 83 Strongly Landlord-Friendly
- State Iowa
- 83 Strongly Landlord-Friendly · R+6
- County
- — inherits STATE
- City
- — inherits STATE
ZIP-level market 52218
- Home prices YoY
- 17.5%
- Active inventory
- 17
- Price-to-rent
- 14.2×
Monthly cashflow live
- Estimated rent
- $968 medium interval (Pro) →
- Mortgage (P&I)
- −$865
- Tax from tax record
- −$128 /mo · $1,530/yr
- Insurance
- −$69
- HOA
- −$0
- Vacancy / Maint / Mgmt
- −$203
- Net cashflow
- $-297
Break-even live
Sensitivity live
| Price | -10% $-203 | -5% $-250 | +0% $-297 | +5% $-343 | +10% $-390 |
|---|---|---|---|---|---|
| Rent | -10% $-373 | -5% $-335 | +0% $-297 | +5% $-258 | +10% $-220 |
| Rate | -1.0pp $-214 | -0.5pp $-255 | base $-297 | +0.5pp $-339 | +1.0pp $-383 |
UW: 25.0% down · 7.5% · 30yr · 1.5% tax · 5.0% vac · 8.0% maint · 8.0% mgmt
Financing live
Cash to close
- Down payment
- $41,250
- Closing costs
- $4,950
- Reserves months
- —
- Total cash needed
- —
Loan-product check · same deal, 3 products live
Conventional
25% down · 7.5% · 30yr
- Down + closing
- —
- Monthly P&I
- —
- Monthly cashflow
- —
- DSCR
- —
- Eligible?
- —
Personal DTI + credit; lowest rate.
DSCR
20% down · 8.5% · 30yr
- Down + closing
- —
- Monthly P&I
- —
- Monthly cashflow
- —
- DSCR
- —
- Eligible?
- —
No personal income docs; deal must DSCR.
Hard money
10% down · 12.0% · 12mo
- Down + closing
- —
- Monthly P&I
- —
- Monthly cashflow
- —
- DSCR
- —
- Eligible?
- —
Short-term bridge; refi at stabilization.
Listing history 2 events
-
2026-06-15statusdays on market $165,000 Pending 2 DOM
-
2026-06-13$165,000 Active 1 DOM
ⓘ Source: listings_history table (triggers on properties + properties_extension) + one-shot
backfill from property_details.listing_events for pre-trigger history.
Tax reassessment forecast IA · Partial reset (capped growth)
- Current annual tax
- $1,530 · $128/mo
- Projected year-2 tax
- $2,060 · $172/mo
- Expected delta
- +$530/yr (+$44/mo · 34.7%)
ⓘ Screening estimate from a state-policy table — verify with the county assessor before closing.
Climate risk First Street
- Flood 1/10 Low FEMA zone X (unshaded) · 0% chance over 30 yrs
- Wildfire 1/10 Low
- Heat 2/10 Low 7 d/yr ≥101°F today · 15 d/yr by 30 yrs out
- Wind 2/10 Low
- Air quality 1/10 Low 0 unhealthy d/yr today · 0 by 30 yrs out
Nearby sold comps map
Loading sold comps map…
Walkable amenities ~0.75 mi
Loading nearby amenities…
Taxation est. · year 1
- Rental income
- $11,619
- − Mortgage interest
- −$9,243
- − Property taxes
- −$1,530
- − Insurance
- −$825
- − Repairs & maintenance
- −$930
- − Management
- −$930
- − Depreciation
- −$4,800
- Taxable loss
- −$6,638
- Est. tax savings @ 24.0%
- +$1,593
- After-tax cash flow
- $-1,966/yr
For passive investors: Depreciation is non-cash, so a rental often shows a tax loss while cash-flowing — sheltering income. Rental losses are passive: they offset passive income freely, and up to $25,000/yr can offset ordinary (W-2) income if you actively participate and your MAGI is under $100k (phasing out to $0 by $150k); unused losses carry forward. On sale, claimed depreciation is recaptured at up to 25%, and gains may owe capital-gains tax (a 1031 exchange can defer both). Figures are a year-1 estimate at your 24.0% rate — not tax advice; consult a CPA.
Schools (NCES district)
- District
- North Linn Community School District
- NCES district ID
- 1920820
- Math proficiency
- 73% ▼ -4.00%
- Reading proficiency
- 77% ▼ -1.00%
- Median HH income
- $60,729
- Composite
- 64.53/100
- National rank
- #538
- State rank
- #62 of 289 in IA
Livability — Coggon
- Score
- 76/100
- State rank
- #196
- US rank
- #3575
Category grades
Schools grade is shown separately in the Schools card above.
Census & demographics
- Census place
- Coggon, IA
- Population (ZIP)
- 1,700
Population outlook (Linn County) Hauer SSP2
- Today (2025)
- 239,589 people
- By 2030
- 248,587 · +3.8%
- By 2040
- 264,817 · +10.5%
- By 2050
- 278,685 · +16.3%
- By 2075
- 311,754 · +30.1%
- By 2100
- 336,773 · +40.6%
Race, ethnicity, and origin ACS 2023
- Neighborhood character
- Predominantly White (99%)
- Race & ethnicity
- White 99%
- Common ancestry
- Lithuanian 3% Portuguese 3% Iranian 1%
- Foreign-born
- 0%
- Languages at home
- 99% English-only · Spanish 1%
Political lean MEDSL · Linn
- 2024 margin
- Lean D (+9.9) · D 54.2% · R 44.3% · Other 1.4%
- 2008→2024 swing
- -11.6pp toward R · 2008: 21.5pp · 2024: 9.9pp
- All cycles
- 2024: D+9.9 2020: D+13.7 2016: D+9.0 2012: D+17.6 2008: D+21.5
Not yet ingested
- Civics
- —
Market trends
- HPI YoY
- ▲ 36.74%
- Current HPI
- 246.4624
- Rent YoY
- —
- Metro
- —
- State GDP YoY
- ▲ 2.48%
- F500 in state
- 4
Industry mix (Fortune 500 HQ in IA)
| Industry | F500 HQs | Revenue |
|---|---|---|
| Financial Services | 1 | $16B |
|
||
| Retail / Convenience | 1 | $15B |
|
||
Price history
+116.8% since first listed5 events — show timeline
- 2026-06-12 Listed $165,000 CRAAR, CDRMLS
- 2018-05-07 Sold (Public Records) $86,000 Public Records
- 2018-05-04 Sold (MLS) $86,000 CRAAR, CDRMLS
- 2018-03-09 Listed $92,000 CRAAR, CDRMLS
- 2001-11-06 Sold (Public Records) $76,119 Public Records
Property tax history
+0.1%/yrLatest (2025): $1,530 · -2.3% YoY. Source: county tax records.
Cash-flow waterfall
monthlySold comps — $/sqft
last 12 mo · ≤1 miLoading sold comps…