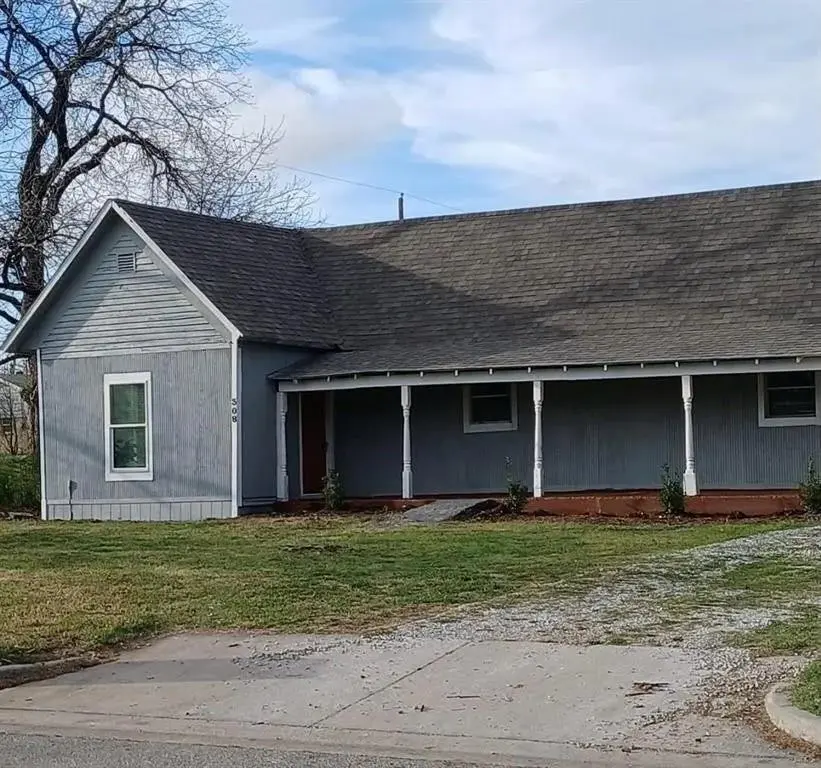
308 Ash St · Crowley, TX
Flood risk 1/10 · Minimal
- FEMA flood zone
- X (unshaded)
- Chance of flooding over 30 yrs
- 0.0%
- Est. flood insurance / yr
- $507 – $1,088
Fire risk 4/10 · Minor
- Est. fire insurance / yr
- $1,222 – $2,270
Heat risk 7/10 · Major
- Hot days now (above 108°F)
- 7 days/yr
- Hot days in 30 yrs
- 25 days/yr
Wind risk 4/10 · Minor
- Chance of severe wind over 30 yrs
- 24.0%
Air-quality risk 3/10 · Minor
- Unhealthy air days now
- 2 days/yr
- Unhealthy air days in 30 yrs
- 3 days/yr
Risk factors via First Street. Map © Google.
Why this score? — see what drove the C grade
The composite is a weighted blend of 9 inputs, each scored 0–100. Each bar is that input's sub-score; the figure is the points it added to the 100-point composite (weight × sub-score).
- Cash flow +20.6/30.0
- ARV discount +15.0/15.0
- DSCR +6.6/10.0
- 1% rule +5.0/10.0
- Livability +3.8/5.0
- Rent growth +3.1/5.0
- Schools +2.5/10.0
- Condition / age +2.5/5.0
- Appreciation +0.0/10.0
$197,900
🖨 Deal sheet 📄 Offer letter ✓ Due diligence
Listing remarks
Two full bedrooms and one bonus room that could be used as a bedroom but does not have a closet. Two full bathrooms. Great curb appeal plus one covered parking.
Key facts
- 8,929 sq ft lot
- Garage
- Built 1920
Property features AI
Finance
- Other: Property type: Single Family Residence; Parcel number: 00673153
- Financial info: Loan type: Treat As Clear; No second mortgage indicated
- HOA & community: No association
Exterior
- Parking: Covered parking space (1); Has garage (garage spaces listed as 0); No carport spaces
- Utilities: City sewer; City water; Not in a municipal utility district
- Home design: Single-family residence; Residential property; Built in 1920; Not attached to another property; One story
- Construction: Built in 1920; Preowned
- Exterior features: Lot under 0.5 acre (approximately 0.205 acres); Subdivision: Crowley Original Town; Directions: N Tarrant St to S Tarrant St to Ash St
Interior
- Kitchen: Other appliances
- Bedrooms: 3 bedrooms; Primary bedroom on level 1 (12 x 14)
- Bathrooms: 2 full bathrooms
- Heating & cooling: Central heating; Central air conditioning
- Interior features: One-level layout; One living area; One dining area; Other interior features
- Laundry & utility: Other (laundry/utility information not specified)
Neighborhood map
What this means for you Summary
Snapshot
- This is a 3-bed/1.0-bath single-family listed at $198k.
Deal economics
- At list price, monthly cash flow is $266 ($3k/yr) — positive.
- The deal already cash-flows at list — no discount required.
- Meets the 1% rule at list price ($2k rent vs $198k).
- Recommended offer: $192k (3.0% below list) — sets the bar for market timing.
- Cap rate 7.9% vs local median 4.5% in Crowley — top-decile yield for the area; either an underpriced asset or a hidden risk that comps aren't pricing in. Stress-test before assuming the spread holds.
Location & tenants
- Location reads 76/100 on livability (#103 in TX, #3,462 nationally) — a middle-class / working-renter tenant base. Strengths: cost of living A+, housing A+, health & safety A+; Watch: amenities F, commute F.
- Crowley ISD (urban): math 23% / reading 32% proficiency, ranked #643 of 826 in TX (top 78%) — low school quality limits family demand, transient renter base, plan for 1-2y turnover.
- Zoned schools: Bess Race El (math 28% / reading 32%, grade F, #2,500 of 4,322 statewide, top 58%, 665 students, 77% FRL) — zoned schools average 77% FRL vs 52% district-wide (26 pts higher); higher-poverty schools than district average — tighter screening recommended.
- Market conditions: Rents rising (+2.3%/yr); 1018 active listings in the ZIP; 40 comparable units currently listed for rent nearby; rentals at typical pace (median 25d on market — plan ~3-4 weeks tenant-placement turnaround); solid renter incomes; 18,938 units permitted in Tarrant County in 2024 (8,336 in 5+ unit buildings).
Forward outlook
- Local home prices are declining (-3.0%/yr); year-one equity from $1k of loan paydown is wiped out by about $6k of value loss. Plan a longer hold.
- Tarrant County population projected at +41% by 2050 — long-run rental-demand tailwind backs the buy-and-hold thesis.
Negotiation context
- It's been on market 52 days — a 3% lower offer ($192k) is reasonable based on typical stale-listing flexibility.
- 6 sale attempts with the ask held roughly flat each time — persistent listings suggest the price (not the market) is what's stuck; bring a comps-based counter.
Risks & watch-outs
- Watch-outs: built in 1920 — expect roof / HVAC / electrical / plumbing capex.
- Climate carrying-cost: extreme-heat days projected 7→25/yr by 2055 (HVAC capex compounding) — expect insurance premiums to compound above CPI over the hold.
Questions for the listing agent
- It's been on market 52 days. Have you received any prior offers? Is the seller open to a 3% concession, seller financing, or rate buy-down credit?
- Built in 1920 — when were the roof, HVAC, electrical panel, plumbing, and water heater last replaced?
- Is there a deadline driving the sale (1031 exchange, divorce, estate, relocation)? That informs how much negotiation room exists.
- Schools are D-rated, which usually means shorter tenancies and higher turnover. Who's the typical renter profile here, and what's been the actual vacancy rate?
- What's the average days-on-market for RENTAL listings here right now (not sales)? A rising rental-DOM trend means longer vacancies and softer asking-rent achievability than the comps imply.
- What's the recent tenant-quality profile in this submarket — average credit score on applications, eviction rate, late-payment / NSF rate, and stable-employment percentage? A property-management company in the area should have these aggregated.
- How much new for-sale + rental construction is in the pipeline within 1–3 miles? Heavy new supply typically softens prices + rents 12–24 months out; constrained supply supports both.
Investment metrics
- 1% rule
- 1.00% ✓
- Cap rate
- 7.91%
- Cash-on-cash
- 5.76%
- DSCR
- 1.26
- GRM
- 8.3
CMA / ARV
- ARV (median comp)
- $241,090
- List price
- $197,900
- Delta
- -17.91%
- Verdict
- UNDERPRICED
- Comps
- 20 within 1.0 mi
Show comp detail 12 sales within ~0.75 mi
| Address | Dist | Beds/Ba | Sqft | Sold | Price | $/sf | Match |
|---|---|---|---|---|---|---|---|
| 613 W Main St | 0.30mi | 3/1.0 | 1,302 (+2%) | 2mo | $169,900 | $130 | 82 |
| 708 Meadowlark Cir | 0.31mi | 3/2.0 | 1,328 (+4%) | 1mo | $230,000 | $173 | 75 |
| 513 Baldwin Ave | 0.43mi | 3/2.0 | 1,323 (+3%) | 2mo | $245,000 | $185 | 69 |
| 512 Oak Ridge Ct | 0.27mi | 3/2.0 | 1,394 (+9%) | 2mo | $280,000 | $201 | 68 |
| 209 Mccurdy St | 0.40mi | 3/2.0 | 1,371 (+7%) | 2mo | $285,000 | $208 | 64 |
| 417 Wallace Dr | 0.51mi | 3/2.0 | 1,222 (-5%) | 1mo | $219,500 | $180 | 64 |
| 312 E Hampton Rd | 0.57mi | 3/2.0 | 1,243 (-3%) | 2mo | $265,000 | $213 | 63 |
| 400 Harris Dr | 0.49mi | 3/2.0 | 1,215 (-5%) | 2mo | $224,900 | $185 | 63 |
| 401 Ferenz Ct | 0.45mi | 3/2.0 | 1,464 (+14%) | 1mo | $280,000 | $191 | 51 |
| 325 Quail Creek Dr | 0.73mi | 4/2.0 (+1) | 1,298 (+1%) | 6mo | $199,900 | $154 | 50 |
| 605 Owens Dr | 0.56mi | 3/2.0 | 1,444 (+13%) | 1mo | $298,500 | $207 | 48 |
| 813 Colony Dr | 0.64mi | 4/2.0 (+1) | 1,471 (+15%) | 4mo | $238,500 | $162 | 33 |
Match score weights: distance 35% · size 25% · config 20% · recency 20%. Top-matched comps best support the ARV.
Projected returns pro-forma
-3.0% appreciation · 2.28% rent growth · sell at horizon
- IRR
- -8.2%
- Equity multiple
- 0.70×
- Total profit
- $-16,553
- Equity at exit
- $29,508
- IRR
- 0.4%
- Equity multiple
- 1.03×
- Total profit
- $1,603
- Equity at exit
- $17,111
Cash invested: $55,412 (down + closing). Projections, not guarantees.
Landlord ↔ Tenant lean methodology
- Overall (STATE)
- 87 Strongly Landlord-Friendly
- State Texas
- 87 Strongly Landlord-Friendly · R+5
- County
- — inherits STATE
- City
- — inherits STATE
ZIP-level market 76036
- Home prices YoY
- -25.2%
- Rents YoY
- 2.3%
- Active inventory
- 1018
- Price-to-rent
- 8.3×
Monthly cashflow live
- Estimated rent
- $1,979 high interval (Pro) →
- Mortgage (P&I)
- −$1,038
- Tax from tax record
- −$177 /mo · $2,125/yr
- Insurance
- −$82
- HOA
- −$0
- Vacancy / Maint / Mgmt
- −$416
- Net cashflow
- $266
Break-even live
UW: 25.0% down · 7.5% · 30yr · 1.5% tax · 5.0% vac · 8.0% maint · 8.0% mgmt
Financing live
Cash to close
- Down payment
- $49,475
- Closing costs
- $5,937
- Reserves months
- —
- Total cash needed
- —
Loan-product check · same deal, 3 products live
Conventional
25% down · 7.5% · 30yr
- Down + closing
- —
- Monthly P&I
- —
- Monthly cashflow
- —
- DSCR
- —
- Eligible?
- —
Personal DTI + credit; lowest rate.
DSCR
20% down · 8.5% · 30yr
- Down + closing
- —
- Monthly P&I
- —
- Monthly cashflow
- —
- DSCR
- —
- Eligible?
- —
No personal income docs; deal must DSCR.
Hard money
10% down · 12.0% · 12mo
- Down + closing
- —
- Monthly P&I
- —
- Monthly cashflow
- —
- DSCR
- —
- Eligible?
- —
Short-term bridge; refi at stabilization.
Rent comps 40 comps
| Address | Beds | Baths | Sqft | Rent | $/sqft | DOM | Units | Dist |
|---|---|---|---|---|---|---|---|---|
| 121 S Hampton Rd Crowley, TX | 1.0–3.0 | 1.0–2.0 | 924 | $1,675 | $1.81 | 2d | 10 | 0.28mi |
| 404 Canoe Way Crowley, TX | 4.0 | 2.0 | 1827 | $2,195 | $1.20 | 19d | 1 | 0.35mi |
| 221 Arnold St Crowley, TX | 3.0 | 2.0 | 1266 | $1,695 | $1.34 | 5d | 1 | 0.39mi |
| 432 Canoe Way Crowley, TX | 3.0 | 2.0 | 1589 | $1,985 | $1.25 | 2d | 1 | 0.41mi |
| 305 Wilson St Crowley, TX | 2.0 | 2.0 | 1400 | $1,950 | $1.39 | 24d | 1 | 0.45mi |
| 601 Porter Ave Crowley, TX | 3.0 | 2.0 | 1563 | $2,195 | $1.40 | 43d | 1 | 0.46mi |
| 473 Canvas Ct Crowley, TX | 3.0 | 2.0 | 1211 | $1,650 | $1.36 | 43d | 1 | 0.48mi |
| 616 Race St Unit D Crowley, TX | 2.0 | 1.0 | 939 | $1,150 | $1.22 | 24d | 1 | 0.50mi |
| 620 Race St Apt A Crowley, TX | 2.0 | 1.0 | 939 | $1,195 | $1.27 | 5d | 1 | 0.50mi |
| 620 Race St Unit D Crowley, TX | 2.0 | 1.0 | 939 | $1,190 | $1.27 | 43d | 1 | 0.50mi |
| 496 Canvas Ct Crowley, TX | 2.0 | 2.0 | 1135 | $1,575 | $1.39 | 43d | 1 | 0.52mi |
| 701 Daniels Dr Crowley, TX | 3.0 | 2.0 | 1232 | $1,850 | $1.50 | 20d | 1 | 0.55mi |
| 709 Daniels Dr Crowley, TX | 3.0 | 2.0 | 1418 | $1,915 | $1.35 | 2d | 1 | 0.56mi |
| 668 Stern Dr Unit 1 Crowley, TX | 2.0 | 2.0 | 1150 | $1,525 | $1.33 | 24d | 1 | 0.56mi |
| 636 Horn St Crowley, TX | 3.0 | 2.0 | 1804 | $1,980 | $1.10 | 5d | 1 | 0.60mi |
| 521 Mesquite Ave Crowley, TX | 3.0 | 2.0 | 1400 | $1,900 | $1.36 | 24d | 1 | 0.62mi |
| 573 Creekbend St Crowley, TX | 3.0 | 2.0 | 1874 | $2,230 | $1.19 | 2d | 1 | 0.67mi |
| 316 Quail Creek Dr Crowley, TX | 3.0 | 2.0 | 1317 | $1,683 | $1.28 | 12d | 1 | 0.68mi |
| 109 N Heights Dr Crowley, TX | 3.0 | 2.0 | 1284 | $1,945 | $1.51 | 24d | 1 | 0.70mi |
| 305 W FM 1187 Crowley, TX | 2.0 | 2.0 | 1190 | $1,500 | $1.26 | 12d | 1 | 0.74mi |
| 305 W FM 1187 Crowley, TX | 1.0–3.0 | 1.0–2.0 | 1181 | $4,194 | $3.55 | 1d | 23 | 0.74mi |
| 305 W Farm 1187 Unit 30421 Crowley, TX | 2.0 | 2.0 | 1200 | $1,599 | $1.33 | 12d | 1 | 0.74mi |
| 701 E Mission St Crowley, TX | 3.0 | 1.0 | 1323 | $1,460 | $1.10 | 24d | 1 | 0.83mi |
| 129 Hirth Dr Crowley, TX | 3.0 | 3.0 | 1624 | $1,850 | $1.14 | 12d | 1 | 0.90mi |
| 708 E Prairie View Rd Crowley, TX | 3.0 | 1.5 | 1080 | $1,750 | $1.62 | 12d | 1 | 0.92mi |
| 405 Bryan Dr Crowley, TX | 3.0 | 2.0 | 1343 | $1,795 | $1.34 | 24d | 1 | 0.92mi |
| 412 Riverbed Dr Crowley, TX | 3.0 | 2.0 | 1638 | $2,100 | $1.28 | 43d | 1 | 0.94mi |
| 1136 Park Gln Crowley, TX | 3.0 | 2.0 | 1487 | $2,000 | $1.34 | 12d | 1 | 0.98mi |
| 824 E Prairie View Rd Crowley, TX | 3.0 | 2.0 | 1120 | $1,795 | $1.60 | 43d | 1 | 1.03mi |
| 1208 Boxwood Dr Crowley, TX | 3.0 | 2.0 | 1677 | $2,095 | $1.25 | 24d | 1 | 1.03mi |
| 1434 Briar Cir Unit 1432 Crowley, TX | 2.0 | 2.0 | 892 | $1,495 | $1.68 | 43d | 1 | 1.11mi |
| 1432 Briar Cir Crowley, TX | 2.0 | 2.0 | 892 | $1,495 | $1.68 | 43d | 1 | 1.11mi |
| 1213 Gardenia Ln Crowley, TX | 3.0 | 2.0 | 1501 | $2,170 | $1.45 | 43d | 1 | 1.15mi |
| 552 Kerry St Crowley, TX | 3.0 | 2.0 | 1636 | $2,295 | $1.40 | 2d | 1 | 1.18mi |
| 10381 Fort Ewell Trl Crowley, TX | 3.0 | 2.0 | 1494 | $2,149 | $1.44 | 43d | 1 | 1.19mi |
| 1149 Beaverwood Ln Crowley, TX | 3.0 | 2.0 | 1552 | $1,895 | $1.22 | 12d | 1 | 1.21mi |
| 4052 Dublin Ridge Dr Crowley, TX | 3.0 | 2.0 | 1464 | $1,895 | $1.29 | 22d | 1 | 1.22mi |
| 10344 Fort Teran Trl Crowley, TX | 3.0 | 2.0 | 1494 | $2,149 | $1.44 | 43d | 1 | 1.24mi |
| 10356 Fort Teran Trl Crowley, TX | 3.0 | 2.0 | 1508 | $2,169 | $1.44 | 43d | 1 | 1.24mi |
| 10316 Fort Teran Trl Crowley, TX | 3.0 | 2.0 | 1501 | $2,199 | $1.47 | 12d | 1 | 1.24mi |
Listing history 34 events
-
2026-06-18days on market $197,900 Active 52 DOM
-
2026-06-17days on market $197,900 Active 51 DOM
-
2026-06-16days on market $197,900 Active 50 DOM
-
2026-06-15days on market $197,900 Active 49 DOM
-
2026-06-13days on market $197,900 Active 47 DOM
-
2026-06-13days on market $197,900 Active 46 DOM
-
2026-06-09days on market $197,900 Active 43 DOM
-
2026-06-08pricedays on market $197,900 Active 42 DOM
-
2026-06-07days on market $199,000 Active 41 DOM
-
2026-06-04days on market $199,000 Active 38 DOM
-
2026-06-03days on market $199,000 Active 37 DOM
-
2026-06-02days on market $199,000 Active 36 DOM
-
2026-06-01days on market $199,000 Active 35 DOM
-
2026-05-31days on market $199,000 Active 34 DOM
-
2026-05-08historical Active Option Contract 160-char remark
-
2026-04-27$199,000 Active 160-char remark
-
2025-10-13historical
-
2025-09-16price $189,900
-
2025-09-08$194,900 Active
-
2025-08-31historical
-
2025-07-26price $194,900
-
2025-06-13price $199,900
-
2025-06-03price $203,900
-
2025-05-30price $204,900
-
2025-05-30price $202,900
-
2025-04-23price $204,900
-
2025-04-09price $207,900
-
2025-03-30status Active
-
2025-03-30status Active
-
2025-03-29$209,900 Active
-
2021-04-19soldstatus
-
2013-10-22soldstatus
-
2013-10-22soldstatus
-
1993-02-27soldstatus
ⓘ Source: listings_history table (triggers on properties + properties_extension) + one-shot
backfill from property_details.listing_events for pre-trigger history.
Tax reassessment forecast TX · Resets to sale price
- Current annual tax
- $2,125 · $177/mo
- Projected year-2 tax
- $3,622 · $302/mo
- Expected delta
- +$1,497/yr (+$125/mo · 70.4%)
ⓘ Screening estimate from a state-policy table — verify with the county assessor before closing.
Climate risk First Street
- Flood 1/10 Low FEMA zone X (unshaded) · 0% chance over 30 yrs
- Wildfire 4/10 Moderate
- Heat 7/10 Severe 7 d/yr ≥108°F today · 25 d/yr by 30 yrs out
- Wind 4/10 Moderate 24% chance of damaging wind over 30 yrs
- Air quality 3/10 Moderate 2 unhealthy d/yr today · 3 by 30 yrs out
Nearby sold comps map
Loading sold comps map…
Walkable amenities ~0.75 mi
Loading nearby amenities…
Taxation est. · year 1
- Rental income
- $23,749
- − Mortgage interest
- −$11,085
- − Property taxes
- −$2,125
- − Insurance
- −$990
- − Repairs & maintenance
- −$1,900
- − Management
- −$1,900
- − Depreciation
- −$5,757
- Taxable loss
- −$7
- Est. tax savings @ 24.0%
- +$2
- After-tax cash flow
- $3,196/yr
For passive investors: Depreciation is non-cash, so a rental often shows a tax loss while cash-flowing — sheltering income. Rental losses are passive: they offset passive income freely, and up to $25,000/yr can offset ordinary (W-2) income if you actively participate and your MAGI is under $100k (phasing out to $0 by $150k); unused losses carry forward. On sale, claimed depreciation is recaptured at up to 25%, and gains may owe capital-gains tax (a 1031 exchange can defer both). Figures are a year-1 estimate at your 24.0% rate — not tax advice; consult a CPA.
Schools (NCES district)
- District
- Crowley ISD
- NCES district ID
- 4815910
- Math proficiency
- 23% ▼ -15.00%
- Reading proficiency
- 32% ▼ -6.00%
- Median HH income
- $59,810
- Composite
- 25.04/100
- National rank
- #7549
- State rank
- #643 of 826 in TX
Livability — Crowley
- Score
- 76/100
- State rank
- #103
- US rank
- #3462
Category grades
Schools grade is shown separately in the Schools card above.
Census & demographics
- Census place
- Crowley, TX
- County
- Tarrant County · 2,033,669 people
- City population
- 36,044
- Metro
- Dallas-Fort Worth-Arlington, TX
- Population (ZIP)
- 36,044
- Household income
- $97,973
- Rent vs Own
- Severe rent burden
- 584.0
Population outlook (Tarrant County) Hauer SSP2
- Today (2025)
- 2,380,417 people
- By 2030
- 2,578,900 · +8.3%
- By 2040
- 2,974,995 · +25.0%
- By 2050
- 3,350,489 · +40.8%
- By 2075
- 4,216,909 · +77.2%
- By 2100
- 4,741,527 · +99.2%
Race, ethnicity, and origin ACS 2023
- Neighborhood character
- Diverse neighborhood (Simpson 0.65)
- Race & ethnicity
- White 48% Hispanic / Latino 28% Black 20% Two or more races 14% Asian 2%
- Hispanic origin (detail)
- Mexican 23% Puerto Rican 2%
- Common ancestry
- Slovak 3% Italian 2% Serbian 1%
- Foreign-born
- 8% · Canada, Vietnam
- Languages at home
- 79% English-only · Spanish 18% Other Indo-European 1% Vietnamese 1%
Political lean MEDSL · Tarrant
- 2024 margin
- Lean R (+5.1) · D 46.7% · R 51.9% · Other 1.4%
- 2008→2024 swing
- +6.6pp toward D · 2008: -11.7pp · 2024: -5.1pp
- All cycles
- 2024: R+5.1 2020: D+0.2 2016: R+8.7 2012: R+15.7 2008: R+11.7
Not yet ingested
- Civics
- —
Market trends
- HPI YoY
- ▼ -80.45%
- Current HPI
- 238.6365
- Rent YoY
- ▲ 2.28%
- Metro
- Dallas-Fort Worth-Arlington, TX
- State GDP YoY
- ▲ 3.95%
- F500 in state
- 110
Industry mix (Fortune 500 HQ in TX)
| Industry | F500 HQs | Revenue |
|---|---|---|
| Energy | 16 | $1,198B |
|
||
| Technology | 5 | $198B |
|
||
| Engineering / Construction | 4 | $72B |
|
||
| Energy Services | 3 | $60B |
|
||
| Utilities | 3 | $41B |
|
||
| Healthcare | 2 | $330B |
|
||
Price history
-5.7% since first listed22 events — show timeline
- 2026-06-08 Price Changed $197,900 NTREIS
- 2026-05-22 Relisted — NTREIS
- 2026-05-08 Contingent — NTREIS
- 2026-04-27 Listed $199,000 NTREIS
- 2025-10-13 Listing Removed — NTREIS
- 2025-09-16 Price Changed $189,900 NTREIS
- 2025-09-08 Listed $194,900 NTREIS
- 2025-08-31 Listing Removed — NTREIS
- 2025-07-26 Price Changed $194,900 NTREIS
- 2025-06-13 Price Changed $199,900 NTREIS
- 2025-06-03 Price Changed $203,900 NTREIS
- 2025-05-30 Price Changed $204,900 NTREIS
- 2025-05-30 Price Changed $202,900 NTREIS
- 2025-04-23 Price Changed $204,900 NTREIS
- 2025-04-09 Price Changed $207,900 NTREIS
- 2025-03-30 Relisted — NTREIS
- 2025-03-30 Relisted — NTREIS
- 2025-03-29 Listed $209,900 NTREIS
- 2021-04-19 Sold (Public Records) — Public Records
- 2013-10-22 Sold (Public Records) — Public Records
- 2013-10-22 Sold (Public Records) — Public Records
- 1993-02-27 Sold (Public Records) — Public Records
Property tax history
+3.8%/yrLatest (2025): $2,125 · +0.4% YoY. Source: county tax records.
Cash-flow waterfall
monthlySold comps — $/sqft
last 12 mo · ≤1 miLoading sold comps…