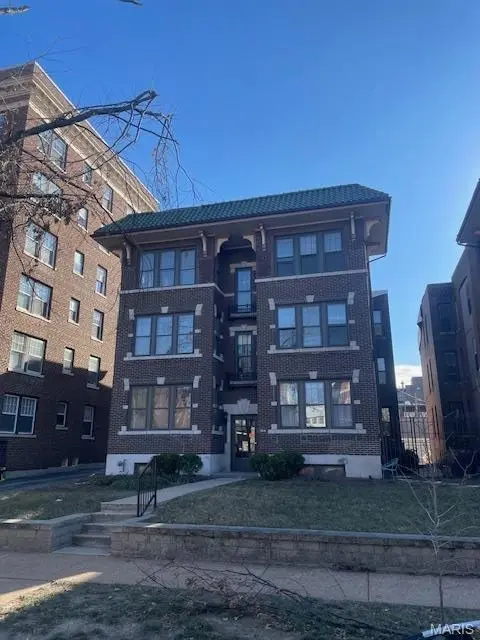
5518 Waterman Blvd Unit 2E · St. Louis, MO
Flood risk 1/10 · Minimal
- FEMA flood zone
- X (unshaded)
- Chance of flooding over 30 yrs
- 0.0%
- Est. flood insurance / yr
- $507 – $1,088
Fire risk 1/10 · Minimal
- Est. fire insurance / yr
- $1,054 – $1,958
Heat risk 5/10 · Moderate
- Hot days now (above 107°F)
- 7 days/yr
- Hot days in 30 yrs
- 21 days/yr
Wind risk 2/10 · Minimal
- Chance of severe wind over 30 yrs
- 1.0%
Air-quality risk 3/10 · Minor
- Unhealthy air days now
- 3 days/yr
- Unhealthy air days in 30 yrs
- 4 days/yr
Risk factors via First Street. Map © Google.
Why this score? — see what drove the B- grade
The composite is a weighted blend of 9 inputs, each scored 0–100. Each bar is that input's sub-score; the figure is the points it added to the 100-point composite (weight × sub-score).
- Cash flow +30.0/30.0
- 1% rule +10.0/10.0
- DSCR +10.0/10.0
- ARV discount +7.5/15.0
- Rent growth +3.1/5.0
- Livability +2.5/5.0
- Condition / age +2.5/5.0
- Schools +1.2/10.0
- Appreciation +0.0/10.0
$50,000
🖨 Deal sheet 📄 Offer letter ✓ Due diligence
Key facts
- $530 HOA
- 2 garage spots
- Built 1915
Neighborhood map
What this means for you Summary
Snapshot
- This is a 3-bed/1.5-bath condo listed at $50k.
Deal economics
- At list price, monthly cash flow is $620 ($7k/yr) — positive.
- The deal already cash-flows at list — no discount required.
- Meets the 1% rule at list price ($2k rent vs $50k).
- Cap rate 21.2% vs local median 5.0% in St. Louis — top-decile yield for the area; either an underpriced asset or a hidden risk that comps aren't pricing in. Stress-test before assuming the spread holds.
Location & tenants
- Location reads: area grade B — affects rentability + tenant quality, not the cash-flow math above.
- St. Louis City (urban): math 10% / reading 18% proficiency, ranked #312 of 324 in MO (top 96%) — low school quality limits family demand, transient renter base, plan for 1-2y turnover; 80% free/reduced lunch — lower-income household profile, screen leases tightly.
- Zoned schools: Hamilton Elem. Community Ed. (math 2% / reading 8%, grade F, #1,072 of 1,115 statewide, top 98%, 253 students, 99% FRL); Sumner High (math 2% / reading 2%, grade F, #520 of 521 statewide, top 100%, 264 students, 99% FRL) — zoned schools average 99% FRL vs 80% district-wide (18 pts higher); higher-poverty schools than district average — tighter screening recommended.
- Market conditions: Rents rising (+2.4%/yr); 118 active listings in the ZIP; 40 comparable units currently listed for rent nearby; rentals at typical pace (median 17d on market — plan ~3-4 weeks tenant-placement turnaround); 294 units permitted in St. Louis city in 2024 (227 in 5+ unit buildings).
- At $1,893/mo this rent would consume 50% of the median local household income ($46k/yr) (locally 1457% of renters already pay >50% of income on rent) — very limited rent-growth headroom before tenants either downsize or default.
Forward outlook
- Local home prices are declining (-3.0%/yr); year-one equity from $346 of loan paydown is wiped out by about $2k of value loss. Plan a longer hold.
- St. Louis County population projected to shrink 6% by 2050 — rents likely to lag national; underwrite the cash flow, not the appreciation.
- At projected returns (-3.0% appreciation + 2.4% rent growth), your $14k cash investment doubles in ~3 years — after that, you're playing with house money.
Negotiation context
- Only 1 days on market — expect competitive offers; lowballing is unlikely to land.
Risks & watch-outs
- Watch-outs: HOA is 28% of rent; built in 1915 — expect roof / HVAC / electrical / plumbing capex.
- Climate carrying-cost: extreme-heat days projected 7→21/yr by 2055 (HVAC capex compounding) — expect insurance premiums to compound above CPI over the hold.
Questions for the listing agent
- Built in 1915 — when were the roof, HVAC, electrical panel, plumbing, and water heater last replaced?
- What does the HOA fee cover, when was the last increase, and are there any pending special assessments or reserve-fund shortfalls?
- Any open or pending special assessments — roof, HVAC, plumbing, elevator, façade? What's the per-unit balance and payoff schedule, and is the seller paying it off at close or rolling it to the buyer?
- Is there a deadline driving the sale (1031 exchange, divorce, estate, relocation)? That informs how much negotiation room exists.
- What's the average days-on-market for RENTAL listings here right now (not sales)? A rising rental-DOM trend means longer vacancies and softer asking-rent achievability than the comps imply.
- What's the recent tenant-quality profile in this submarket — average credit score on applications, eviction rate, late-payment / NSF rate, and stable-employment percentage? A property-management company in the area should have these aggregated.
- How much new apartment / multifamily construction is in the pipeline within 1–3 miles? Heavy new supply (>2% of stock underway) typically softens rents 12–24 months out; light construction supports rent growth.
Investment metrics
- 1% rule
- 3.79% ✓
- Cap rate
- 21.17%
- Cash-on-cash
- 53.14%
- DSCR
- 3.36
- GRM
- 2.2
CMA / ARV
No comps found within radius.
Projected returns pro-forma
-3.0% appreciation · 2.39% rent growth · sell at horizon
- IRR
- 50.4%
- Equity multiple
- 3.18×
- Total profit
- $30,586
- Equity at exit
- $7,455
- IRR
- 55.6%
- Equity multiple
- 6.30×
- Total profit
- $74,241
- Equity at exit
- $4,323
Cash invested: $14,000 (down + closing). Projections, not guarantees.
Landlord ↔ Tenant lean methodology
- Overall (STATE)
- 81 Strongly Landlord-Friendly
- State Missouri
- 81 Strongly Landlord-Friendly · R+10
- County
- — inherits STATE
- City
- — inherits STATE
ZIP-level market 63112
- Rents YoY
- 2.4%
- Active inventory
- 118
- Price-to-rent
- 2.2×
Monthly cashflow live
- Estimated rent
- $1,893 high interval (Pro) →
- Mortgage (P&I)
- −$262
- Tax est. 1.5%
- −$62 /mo · $750/yr
- Insurance
- −$21
- HOA
- −$530
- Vacancy / Maint / Mgmt
- −$398
- Net cashflow
- $620
Break-even live
UW: 25.0% down · 7.5% · 30yr · 1.5% tax · 5.0% vac · 8.0% maint · 8.0% mgmt
Financing live
Cash to close
- Down payment
- $12,500
- Closing costs
- $1,500
- Reserves months
- —
- Total cash needed
- —
Loan-product check · same deal, 3 products live
Conventional
25% down · 7.5% · 30yr
- Down + closing
- —
- Monthly P&I
- —
- Monthly cashflow
- —
- DSCR
- —
- Eligible?
- —
Personal DTI + credit; lowest rate.
DSCR
20% down · 8.5% · 30yr
- Down + closing
- —
- Monthly P&I
- —
- Monthly cashflow
- —
- DSCR
- —
- Eligible?
- —
No personal income docs; deal must DSCR.
Hard money
10% down · 12.0% · 12mo
- Down + closing
- —
- Monthly P&I
- —
- Monthly cashflow
- —
- DSCR
- —
- Eligible?
- —
Short-term bridge; refi at stabilization.
Rent comps 40 comps
| Address | Beds | Baths | Sqft | Rent | $/sqft | DOM | Units | Dist |
|---|---|---|---|---|---|---|---|---|
| 5527 Waterman Blvd St. Louis, MO | 2.0 | 1.5 | 1389 | $1,495 | $1.08 | 16d | 1 | 0.04mi |
| 5510 Pershing Ave Saint Louis, MO | 3.0 | 1.0–2.0 | 827 | $3,247 | $3.92 | 2d | 20 | 0.09mi |
| 5394 Pershing Ave Saint Louis, MO | 3.0 | 2.0 | 1500 | $2,595 | $1.73 | 44d | 1 | 0.10mi |
| 5330 Pershing Ave Saint Louis, MO | 2.0 | 2.0 | 845 | $1,145 | $1.36 | 44d | 2 | 0.21mi |
| 5316 Pershing Ave Saint Louis, MO | 1.0–2.0 | 1.0 | 770 | $1,500 | $1.95 | 4d | 5 | 0.23mi |
| 445 Clara Ave Saint Louis, MO | 2.0 | 2.5 | 1188 | $2,750 | $2.31 | 44d | 1 | 0.24mi |
| 501 Clara Ave Saint Louis, MO | 1.0–2.0 | 1.0–2.0 | 850 | $1,845 | $2.17 | 15d | 21 | 0.26mi |
| 501 Clara Ave Saint Louis, MO | 1.0–2.0 | 1.0–2.0 | 915 | $1,885 | $2.06 | 2d | 21 | 0.26mi |
| 275 Union Blvd St. Louis, MO | 3.0 | 1.0–3.0 | 1317 | $4,686 | $3.56 | 2d | 58 | 0.27mi |
| 5660 Kingsbury Ave Saint Louis, MO | 1.0–2.0 | 1.0–2.0 | 789 | $1,550 | $1.96 | 44d | 23 | 0.28mi |
| 5660 Kingsbury Ave Saint Louis, MO | 1.0–2.0 | 1.0–2.0 | 789 | $1,520 | $1.93 | 3d | 16 | 0.28mi |
| 5500 Delmar Blvd Unit 5540-Apt 202 St. Louis, MO | 2.0 | 2.0 | 875 | $1,395 | $1.59 | 8d | 1 | 0.29mi |
| 5560 Delmar Blvd Saint Louis, MO | 1.0–2.0 | 1.0–2.0 | 752 | $1,395 | $1.85 | 16d | 1 | 0.32mi |
| 415 DeBaliviere Ave Unit 208 St. Louis, MO | 2.0 | 2.0 | 955 | $1,700 | $1.78 | 16d | 1 | 0.35mi |
| 415 DeBaliviere Ave Unit 101 St. Louis, MO | 2.0 | 2.0 | 976 | $1,750 | $1.79 | 16d | 1 | 0.35mi |
| 415 DeBaliviere Ave Unit 201 St. Louis, MO | 2.0 | 1.0 | 842 | $1,599 | $1.90 | 16d | 1 | 0.35mi |
| 5535 Delmar Blvd St. Louis, MO | 1.0–2.0 | 1.0–2.0 | 911 | $1,970 | $2.16 | 2d | 14 | 0.35mi |
| 629 Clara Ave Apt 26 St. Louis, MO | 2.0 | 2.0 | 1155 | $1,615 | $1.40 | 44d | 1 | 0.36mi |
| 5572 Clemens Ave Unit 1W St. Louis, MO | 3.0 | 1.0 | 900 | $1,025 | $1.14 | 15d | 1 | 0.49mi |
| 5783 McPherson Ave Unit 1FL St. Louis, MO | 2.0 | 2.0 | 1250 | $1,950 | $1.56 | 8d | 1 | 0.52mi |
| 5783 McPherson Ave Unit 2FL St. Louis, MO | 3.0 | 2.0 | 1320 | $2,550 | $1.93 | 8d | 1 | 0.52mi |
| 5803 Waterman Blvd St. Louis, MO | 2.0 | 2.0 | 1432 | $1,850 | $1.29 | 44d | 1 | 0.62mi |
| 5855 Washington Blvd Unit 1A St. Louis, MO | 2.0 | 1.0 | 850 | $999 | $1.18 | 44d | 1 | 0.63mi |
| 5345 Cabanne Ave Unit 5345 Cabanne 1S St. Louis, MO | 2.0 | 1.0 | 800 | $950 | $1.19 | 44d | 1 | 0.68mi |
| 5861 Nina Pl Apt 2W St. Louis, MO | 3.0 | 1.0 | 1400 | $1,750 | $1.25 | 44d | 1 | 0.68mi |
| 5130 Kensington Ave Unit 1 St. Louis, MO | 3.0 | 2.0 | 1200 | $1,245 | $1.04 | 24d | 1 | 0.69mi |
| 5804 Cates Ave Unit 2 St. Louis, MO | 3.0 | 1.0 | 1500 | $1,500 | $1.00 | 4d | 1 | 0.71mi |
| 5920 McPherson Ave Unit 1st Floor St. Louis, MO | 3.0 | 1.0 | 1300 | $2,550 | $1.96 | 44d | 1 | 0.75mi |
| 5811 Cabanne Ave St. Louis, MO | 2.0 | 1.0 | 800 | $1,250 | $1.56 | 44d | 1 | 0.81mi |
| 6009 Kingsbury Ave Saint Louis, MO | 2.0 | 1.0 | 1368 | $1,300 | $0.95 | 24d | 1 | 0.87mi |
| 6009 Kingsbury Ave Saint Louis, MO | 3.0 | 1.0 | 1368 | $2,000 | $1.46 | 4d | 1 | 0.87mi |
| 6017 Kingsbury Ave Unit 2f St. Louis, MO | 4.0 | 1.0 | 1500 | $3,250 | $2.17 | 18d | 1 | 0.88mi |
| 6023 Waterman Blvd Saint Louis, MO | 4.0 | 1.5 | 1200 | $3,800 | $3.17 | 44d | 1 | 0.88mi |
| 100 N Kingshighway Blvd Saint Louis, MO | 3.0 | 1.0–2.0 | 1211 | $7,099 | $5.86 | 44d | 84 | 0.89mi |
| 100 N Kingshighway Blvd Saint Louis, MO | 3.0 | 1.0–2.0 | 1171 | $6,995 | $5.97 | 2d | 80 | 0.89mi |
| 40 N Kingshighway Blvd Saint Louis, MO | 2.0 | 1.0–2.0 | 860 | $2,545 | $2.96 | 2d | 54 | 0.92mi |
| 40 N Kingshighway Blvd Saint Louis, MO | 3.0 | 1.0–2.0 | 872 | $2,695 | $3.09 | 44d | 54 | 0.92mi |
| 4954 W Pine Blvd Saint Louis, MO | 2.0 | 2.0 | 950 | $1,300 | $1.37 | 24d | 1 | 0.95mi |
| 6036 Washington Blvd Apt 1W St. Louis, MO | 2.0 | 1.0 | 1200 | $1,350 | $1.12 | 18d | 1 | 0.95mi |
| 4949 W Pine Blvd St. Louis, MO | 1.0–2.0 | 1.0–2.0 | 925 | $2,225 | $2.41 | 4d | 12 | 0.96mi |
HOA detail condo
- Monthly dues
- $530 · $6,360/yr
- Assessments
- None detected in remarks — confirm with the listing agent.
Listing history 9 events
-
2026-04-16status Pending
-
2026-04-16$50,000 Active
-
2026-04-16historical $50,000
-
2023-09-26soldstatus $215,000
-
2020-11-12soldstatus $174,900
-
2016-06-27soldstatus $215,000
-
2015-12-18soldstatus $167,500
-
2014-01-23soldstatus $154,500
-
2007-06-18soldstatus $215,000
ⓘ Source: listings_history table (triggers on properties + properties_extension) + one-shot
backfill from property_details.listing_events for pre-trigger history.
Climate risk First Street
- Flood 1/10 Low FEMA zone X (unshaded) · 0% chance over 30 yrs
- Wildfire 1/10 Low
- Heat 5/10 Major 7 d/yr ≥107°F today · 21 d/yr by 30 yrs out
- Wind 2/10 Low 100% chance of damaging wind over 30 yrs
- Air quality 3/10 Moderate 3 unhealthy d/yr today · 4 by 30 yrs out
Nearby sold comps map
Loading sold comps map…
Walkable amenities ~0.75 mi
Loading nearby amenities…
Taxation est. · year 1
- Rental income
- $22,717
- − Mortgage interest
- −$2,801
- − Property taxes
- −$750
- − Insurance
- −$250
- − Repairs & maintenance
- −$1,817
- − Management
- −$1,817
- − HOA
- −$6,360
- − Depreciation
- −$1,455
- Taxable income
- $7,467
- Est. tax owed @ 24.0%
- −$1,792
- After-tax cash flow
- $5,648/yr
For passive investors: Depreciation is non-cash, so a rental often shows a tax loss while cash-flowing — sheltering income. Rental losses are passive: they offset passive income freely, and up to $25,000/yr can offset ordinary (W-2) income if you actively participate and your MAGI is under $100k (phasing out to $0 by $150k); unused losses carry forward. On sale, claimed depreciation is recaptured at up to 25%, and gains may owe capital-gains tax (a 1031 exchange can defer both). Figures are a year-1 estimate at your 24.0% rate — not tax advice; consult a CPA.
Schools (NCES district)
- District
- St. Louis City
- NCES district ID
- 2929280
- Math proficiency
- 10% ▼ -6.00%
- Reading proficiency
- 18% ▼ -3.00%
- Median HH income
- $35,685
- Composite
- 11.54/100
- National rank
- #9699
- State rank
- #312 of 324 in MO
Livability — St. Louis
No livability data for this city. (Only ~50 U.S. cities are tracked.)
Census & demographics
- Census place
- St. Louis, MO
- County
- Saint Louis City · 254,015 people
- City population
- 283,259
- Metro
- St. Louis, MO-IL
- Population (ZIP)
- 17,985
- Household income
- $45,542
- Rent vs Own
- Severe rent burden
- 1457.0
Population outlook (St. Louis County) Hauer SSP2
- Today (2025)
- 315,737 people
- By 2030
- 313,865 · -0.6%
- By 2040
- 305,439 · -3.3%
- By 2050
- 296,529 · -6.1%
- By 2075
- 271,028 · -14.2%
- By 2100
- 255,359 · -19.1%
Race, ethnicity, and origin ACS 2023
- Neighborhood character
- Majority Black (63%)
- Race & ethnicity
- Black 63% White 24% Asian 6% Two or more races 5% Hispanic / Latino 4%
- Common ancestry
- Lithuanian 1% Scotch-Irish 1% Romanian 1%
- Foreign-born
- 9% · China, South Korea, Canada
- Languages at home
- 88% English-only · Spanish 3% Chinese 2% Korean 2%
Political lean MEDSL · St. Louis
- 2024 margin
- Solid D (+64.7) · D 81.4% · R 16.7% · Other 2.0%
- 2008→2024 swing
- -3.5pp toward R · 2008: 68.2pp · 2024: 64.7pp
- All cycles
- 2024: D+64.7 2020: D+66.2 2016: D+63.7 2012: D+66.6 2008: D+68.2
Not yet ingested
- Civics
- —
Market trends
- HPI YoY
- ▼ -158.94%
- Current HPI
- 115.1863
- Rent YoY
- ▲ 2.39%
- Metro
- St. Louis, MO-IL
- State GDP YoY
- ▲ 1.84%
- F500 in state
- 20
Industry mix (Fortune 500 HQ in MO)
| Industry | F500 HQs | Revenue |
|---|---|---|
| Healthcare | 1 | $163B |
|
||
| Insurance | 1 | $21B |
|
||
| Industrial Technology | 1 | $17B |
|
||
| Retail | 1 | $16B |
|
||
| Industrial Distribution | 1 | $10B |
|
||
| Utilities | 1 | $9B |
|
||
Price history
-76.7% since first listed9 events — show timeline
- 2026-04-16 Pending — MARIS as Distributed by MLS Grid
- 2026-04-16 Listed $50,000 MARIS as Distributed by MLS Grid
- 2026-04-16 Coming Soon $50,000 MARIS as Distributed by MLS Grid
- 2023-09-26 Sold (Public Records) $215,000 Public Records
- 2020-11-12 Sold (Public Records) $174,900 Public Records
- 2016-06-27 Sold (Public Records) $215,000 Public Records
- 2015-12-18 Sold (Public Records) $167,500 Public Records
- 2014-01-23 Sold (Public Records) $154,500 Public Records
- 2007-06-18 Sold (Public Records) $215,000 Public Records
Property tax history
+1.2%/yrLatest (2024): $2,578 · +4.7% YoY. Source: county tax records.
Cash-flow waterfall
monthlySold comps — $/sqft
last 12 mo · ≤1 miLoading sold comps…