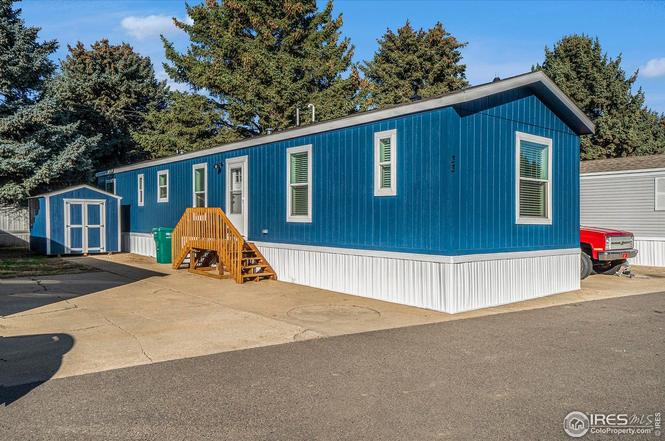
230 N 2nd St #33 · Berthoud, CO
Flood risk 1/10 · Minimal
- FEMA flood zone
- X (unshaded)
- Chance of flooding over 30 yrs
- 0.0%
- Est. flood insurance / yr
- $507 – $1,088
Fire risk 6/10 · Moderate
- Est. fire insurance / yr
- $939 – $1,743
Heat risk 3/10 · Minor
- Hot days now (above 92°F)
- 7 days/yr
- Hot days in 30 yrs
- 18 days/yr
Wind risk 1/10 · Minimal
- Chance of severe wind over 30 yrs
- —
Air-quality risk 4/10 · Minor
- Unhealthy air days now
- 6 days/yr
- Unhealthy air days in 30 yrs
- 7 days/yr
Risk factors via First Street. Map © Google.
Why this score? — see what drove the B grade
The composite is a weighted blend of 9 inputs, each scored 0–100. Each bar is that input's sub-score; the figure is the points it added to the 100-point composite (weight × sub-score).
- Cash flow +30.0/30.0
- 1% rule +10.0/10.0
- DSCR +10.0/10.0
- ARV discount +7.5/15.0
- Condition / age +4.8/5.0
- Livability +3.5/5.0
- Schools +3.4/10.0
- Rent growth +2.5/5.0
- Appreciation +0.0/10.0
$124,900
🖨 Deal sheet 📄 Offer letter ✓ Due diligence
Listing remarks
Be the first to live in this brand new (2026) Skyline home! Crown molding throughout, upgraded ceiling fans, upgraded stainless steel appliances, this is the one that you've been looking for! If you can close on this beautiful home before the end of the year, the seller will install a carport! You will not find a better value on a brand new home in all of Northern Colorado! 2025.
Key facts
- Tuff shed
- Carport
- Amazing amenities
Tags
Property features AI
Finance
- Other: Builder: Skyline
Exterior
- Parking: No garage; No designated parking features
- Utilities: City water with meter installed; Public sewer; Natural gas available (XCEL); Electricity available; Cable and satellite available; High-speed internet available; Park trash service
- Home design: Manufactured in park; Mobile home
- Construction: Vinyl siding; Other construction; Under carriage: HUD; Composition roof
- Exterior features: Land lease; Level, paved lot; Asphalt road frontage on a private road up to county standards; Minimal flood risk (C rating)
Interior
- Kitchen: Gas Range; Dishwasher; Refrigerator
- Bedrooms: 3 bedrooms
- Bathrooms: 2 full bathrooms (both on main level)
- Heating & cooling: Forced air heating; Central air; Ceiling fan(s)
- Interior features: Open floorplan; Walk-in closet(s); Window coverings
Neighborhood map
What this means for you Summary
Snapshot
- This is a 2-bed/1.5-bath manufactured listed at $125k. Condition is rated excellent.
Deal economics
- At list price, monthly cash flow is $654 ($8k/yr) — positive.
- The deal already cash-flows at list — no discount required.
- Meets the 1% rule at list price ($2k rent vs $125k).
- Recommended offer: $110k (12.0% below list) — sets the bar for market timing.
- Cap rate 12.6% vs local median 3.2% in Berthoud — top-decile yield for the area; either an underpriced asset or a hidden risk that comps aren't pricing in. Stress-test before assuming the spread holds.
Location & tenants
- Location reads 69/100 on livability (#100 in CO) — a middle-class / working-renter tenant base. Strengths: employment A+, housing A+; Watch: amenities F, cost of living F, health & safety F.
- Thompson School District R-2J (suburban): math 28% / reading 48% proficiency, ranked #28 of 86 in CO (top 33%) — families likely to look elsewhere, expect single-tenant / working-renter base with shorter leases.
- Zoned schools: Ivy Stockwell Elementary School (math 47% / reading 57%, grade C-, #174 of 966 statewide, top 20%, 402 students, 21% FRL); Berthoud High School (math 37% / reading 62%, grade D, #115 of 381 statewide, top 34%, 691 students, 15% FRL).
- Zoned-school proficiency averages 51% at this address vs 38% district-wide (+13 pts) — the actual schools serving this property are materially stronger than the Thompson School District R-2J average implies; a family-tenant draw the district grade alone would hide.
- Market conditions: 357 active listings in the ZIP; 1 comparable units currently listed for rent nearby; high-income renter base; 1,786 units permitted in Larimer County in 2024 (402 in 5+ unit buildings).
Forward outlook
- Local home prices are declining (-3.0%/yr); year-one equity from $864 of loan paydown is wiped out by about $4k of value loss. Plan a longer hold.
- Larimer County population projected at +51% by 2050 — long-run rental-demand tailwind backs the buy-and-hold thesis.
- At projected returns (-3.0% appreciation + 3.0% rent growth), your $35k cash investment doubles in ~6 years — after that, you're playing with house money.
Negotiation context
- It's been on market 272 days — a 12% lower offer ($110k) is reasonable based on typical stale-listing flexibility.
Risks & watch-outs
- Climate carrying-cost: major wildfire risk — expect insurance premiums to compound above CPI over the hold.
Questions for the listing agent
- It's been on market 272 days. Have you received any prior offers? Is the seller open to a 12% concession, seller financing, or rate buy-down credit?
- Why hasn't it sold? Are there any deal-killer items the seller is aware of (foundation, flood, title, zoning, code violations)?
- Is there a deadline driving the sale (1031 exchange, divorce, estate, relocation)? That informs how much negotiation room exists.
- Schools are A-rated — typically a magnet for longer-tenancy family renters. What's the average tenant stay here, and is there a school-zone premium baked into asking?
- What's the average days-on-market for RENTAL listings here right now (not sales)? A rising rental-DOM trend means longer vacancies and softer asking-rent achievability than the comps imply.
- What's the recent tenant-quality profile in this submarket — average credit score on applications, eviction rate, late-payment / NSF rate, and stable-employment percentage? A property-management company in the area should have these aggregated.
- How much new for-sale + rental construction is in the pipeline within 1–3 miles? Heavy new supply typically softens prices + rents 12–24 months out; constrained supply supports both.
Investment metrics
- 1% rule
- 1.54% ✓
- Cap rate
- 12.58%
- Cash-on-cash
- 22.45%
- DSCR
- 2.00
- GRM
- 5.4
CMA / ARV
- ARV (on-the-fly)
- $72,343
- Comps found
- 8
Show comp detail 8 sales within ~0.75 mi
| Address | Dist | Beds/Ba | Sqft | Sold | Price | $/sf | Match |
|---|---|---|---|---|---|---|---|
| 230 N 2nd St N #80 | 0.02mi | 2/2.0 | 960 (-3%) | 0mo | $82,000 | $85 | 91 |
| 227 N 2nd St #20 | 0.07mi | 2/1.0 | 960 (-3%) | 3mo | $72,000 | $75 | 87 |
| 230 N 2nd St #83 | 0.02mi | 3/2.0 (+1) | 1,056 (+7%) | 1mo | $55,000 | $52 | 80 |
| 230 N 2nd St #10 | 0.02mi | 2/1.0 | 980 (-1%) | 18mo | $52,000 | $53 | 80 |
| 230 N 2nd St #9 | 0.02mi | 2/2.0 | 960 (-3%) | 18mo | $84,000 | $88 | 77 |
| 230 N 2nd St #4 | 0.02mi | 2/1.5 | 1,056 (+7%) | 13mo | $49,000 | $46 | 77 |
| 230 N 2nd St #7 | 0.02mi | 3/2.0 (+1) | 924 (-7%) | 6mo | $66,999 | $73 | 76 |
| 230 N 2nd St #75 | 0.08mi | 3/1.0 (+1) | 882 (-11%) | 3mo | $53,000 | $60 | 69 |
Match score weights: distance 35% · size 25% · config 20% · recency 20%. Top-matched comps best support the ARV.
Projected returns pro-forma
-3.0% appreciation · 3.0% rent growth · sell at horizon
- IRR
- 15.3%
- Equity multiple
- 1.61×
- Total profit
- $21,461
- Equity at exit
- $18,623
- IRR
- 24.0%
- Equity multiple
- 3.07×
- Total profit
- $72,464
- Equity at exit
- $10,799
Cash invested: $34,972 (down + closing). Projections, not guarantees.
Landlord ↔ Tenant lean methodology
- Overall (STATE)
- 38 Tenant-Leaning
- State Colorado
- 38 Tenant-Leaning · D+4
- County
- — inherits STATE
- City
- — inherits STATE
ZIP-level market 80513
- Active inventory
- 357
- Price-to-rent
- 5.4×
Monthly cashflow live
- Estimated rent
- $1,921 medium interval (Pro) →
- Mortgage (P&I)
- −$655
- Tax est. 1.5%
- −$156 /mo · $1,874/yr
- Insurance
- −$52
- HOA
- −$0
- Vacancy / Maint / Mgmt
- −$403
- Net cashflow
- $654
Break-even live
UW: 25.0% down · 7.5% · 30yr · 1.5% tax · 5.0% vac · 8.0% maint · 8.0% mgmt
Financing live
Cash to close
- Down payment
- $31,225
- Closing costs
- $3,747
- Reserves months
- —
- Total cash needed
- —
Loan-product check · same deal, 3 products live
Conventional
25% down · 7.5% · 30yr
- Down + closing
- —
- Monthly P&I
- —
- Monthly cashflow
- —
- DSCR
- —
- Eligible?
- —
Personal DTI + credit; lowest rate.
DSCR
20% down · 8.5% · 30yr
- Down + closing
- —
- Monthly P&I
- —
- Monthly cashflow
- —
- DSCR
- —
- Eligible?
- —
No personal income docs; deal must DSCR.
Hard money
10% down · 12.0% · 12mo
- Down + closing
- —
- Monthly P&I
- —
- Monthly cashflow
- —
- DSCR
- —
- Eligible?
- —
Short-term bridge; refi at stabilization.
Rent comps 1 comps
| Address | Beds | Baths | Sqft | Rent | $/sqft | DOM | Units | Dist |
|---|---|---|---|---|---|---|---|---|
| 1506 N 4th St Unit 6 Berthoud, CO | 1.0 | 1.0 | 838 | $1,300 | $1.55 | 23d | 1 | 1.21mi |
Listing history 11 events
-
2026-06-18days on market $124,900 Active 272 DOM
-
2026-06-17days on market $124,900 Active 271 DOM
-
2026-06-16days on market $124,900 Active 270 DOM
-
2026-06-15days on market $124,900 Active 269 DOM
-
2026-06-14days on market $124,900 Active 267 DOM
-
2026-06-13days on market $124,900 Active 266 DOM
-
2026-06-10days on market $124,900 Active 264 DOM
-
2026-06-09days on market $124,900 Active 263 DOM
-
2026-06-08days on market $124,900 Active 262 DOM
-
2026-06-07remarks 382-char remark
-
2026-06-07$124,900 Active 261 DOM
ⓘ Source: listings_history table (triggers on properties + properties_extension) + one-shot
backfill from property_details.listing_events for pre-trigger history.
Climate risk First Street
- Flood 1/10 Low FEMA zone X (unshaded) · 0% chance over 30 yrs
- Wildfire 6/10 Major
- Heat 3/10 Moderate 7 d/yr ≥92°F today · 18 d/yr by 30 yrs out
- Wind 1/10 Low
- Air quality 4/10 Moderate 6 unhealthy d/yr today · 7 by 30 yrs out
Nearby sold comps map
Loading sold comps map…
Walkable amenities ~0.75 mi
Loading nearby amenities…
Taxation est. · year 1
- Rental income
- $23,050
- − Mortgage interest
- −$6,996
- − Property taxes
- −$1,874
- − Insurance
- −$624
- − Repairs & maintenance
- −$1,844
- − Management
- −$1,844
- − Depreciation
- −$3,633
- Taxable income
- $6,234
- Est. tax owed @ 24.0%
- −$1,496
- After-tax cash flow
- $6,355/yr
For passive investors: Depreciation is non-cash, so a rental often shows a tax loss while cash-flowing — sheltering income. Rental losses are passive: they offset passive income freely, and up to $25,000/yr can offset ordinary (W-2) income if you actively participate and your MAGI is under $100k (phasing out to $0 by $150k); unused losses carry forward. On sale, claimed depreciation is recaptured at up to 25%, and gains may owe capital-gains tax (a 1031 exchange can defer both). Figures are a year-1 estimate at your 24.0% rate — not tax advice; consult a CPA.
Condition & rehab AI · 12 photos
This brand new 2026 Skyline home is move-in ready with modern finishes and upgrades, offering a great value in Northern Colorado.
Value-add opportunities
- Both Landscaping — Enhances curb appeal and adds value
- Both Carport — Seller will install if closed before year-end
Renovation cost estimate screening
Value-add ROI direction
- Both Landscaping — Enhances curb appeal and adds value ↑
- Both Carport — Seller will install if closed before year-end ↑
ⓘ Cost ranges are severity-bucket heuristics (US national rule-of-thumb). Get contractor quotes + a written scope before underwriting a rehab budget.
Schools (NCES district)
- District
- Thompson School District R-2J
- NCES district ID
- 0805400
- Math proficiency
- 28% ▼ -7.00%
- Reading proficiency
- 48% ▬ 0.00%
- Median HH income
- $63,040
- Composite
- 34.01/100
- National rank
- #5313
- State rank
- #28 of 86 in CO
Livability — Berthoud
- Score
- 69/100
- State rank
- #100
- US rank
- #8538
Category grades
Schools grade is shown separately in the Schools card above.
Census & demographics
- Census place
- Berthoud, CO
- County
- Larimer County · 338,255 people
- City population
- 18,271
- Metro
- Fort Collins, CO
- Population (ZIP)
- 18,271
- Household income
- $126,726
- Rent vs Own
- Severe rent burden
- 55.0
Population outlook (Larimer County) Hauer SSP2
- Today (2025)
- 415,361 people
- By 2030
- 457,762 · +10.2%
- By 2040
- 542,310 · +30.6%
- By 2050
- 627,048 · +51.0%
- By 2075
- 833,722 · +100.7%
- By 2100
- 952,590 · +129.3%
Race, ethnicity, and origin ACS 2023
- Neighborhood character
- Predominantly White (86%)
- Race & ethnicity
- White 86% Hispanic / Latino 10% Two or more races 6%
- Hispanic origin (detail)
- Mexican 6% Puerto Rican 1%
- Common ancestry
- Slovak 6% Romanian 4% Lithuanian 4%
- Foreign-born
- 4% · Canada, China, Vietnam
- Languages at home
- 95% English-only · Spanish 4% Other Indo-European 1%
Political lean MEDSL · Larimer
- 2024 margin
- D (+17.6) · D 57.4% · R 39.8% · Other 2.9%
- 2008→2024 swing
- +7.9pp toward D · 2008: 9.7pp · 2024: 17.6pp
- All cycles
- 2024: D+17.6 2020: D+15.4 2016: D+4.9 2012: D+5.2 2008: D+9.7
Not yet ingested
- Civics
- —
Market trends
- HPI YoY
- ▼ -411.30%
- Current HPI
- 260.0027
- Rent YoY
- —
- Metro
- Fort Collins, CO
- State GDP YoY
- ▲ 1.95%
- F500 in state
- 14
Industry mix (Fortune 500 HQ in CO)
| Industry | F500 HQs | Revenue |
|---|---|---|
| Technology Distribution | 1 | $31B |
|
||
| Food / Agriculture | 1 | $18B |
|
||
| Packaging | 1 | $14B |
|
||
| Healthcare | 1 | $13B |
|
||
| Energy | 1 | $10B |
|
||
| Technology | 1 | $4B |
|
||
Price history
-10.7% since first listed3 events — show timeline
- 2026-03-18 Price Changed $124,900 IRES
- 2026-01-16 Price Changed $134,900 IRES
- 2025-09-19 Listed $139,900 IRES
Cash-flow waterfall
monthlySold comps — $/sqft
last 12 mo · ≤1 miLoading sold comps…