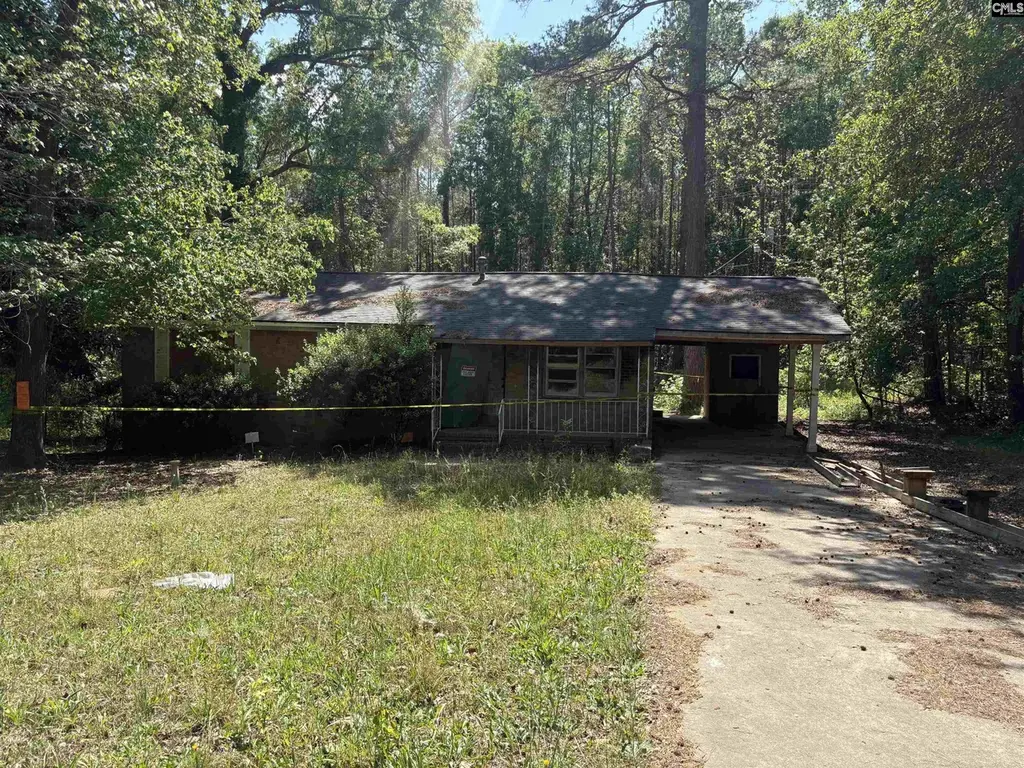
104 Green Tree Dr · Columbia, SC
Flood risk 1/10 · Minimal
- FEMA flood zone
- X
- Chance of flooding over 30 yrs
- 0.0%
- Est. flood insurance / yr
- $435 – $905
Fire risk 2/10 · Minimal
- Est. fire insurance / yr
- $783 – $1,453
Heat risk 6/10 · Moderate
- Hot days now (above threshold)
- 7 days/yr
- Hot days in 30 yrs
- 16 days/yr
Wind risk No data
- Chance of severe wind over 30 yrs
- —
Air-quality risk No data
- Unhealthy air days now
- —
- Unhealthy air days in 30 yrs
- —
Risk factors via First Street. Map © Google.
Why this score? — see what drove the B grade
The composite is a weighted blend of 9 inputs, each scored 0–100. Each bar is that input's sub-score; the figure is the points it added to the 100-point composite (weight × sub-score).
- Cash flow +30.0/30.0
- 1% rule +10.0/10.0
- DSCR +10.0/10.0
- ARV discount +7.5/15.0
- Appreciation +5.0/10.0
- Livability +3.9/5.0
- Schools +2.6/10.0
- Rent growth +2.5/5.0
- Condition / age +2.5/5.0
$74,000
🖨 Deal sheet (PDF) 📄 Offer letter ✓ Due diligence
Listing remarks
104 Green Tree, located in the Hollywood Hills neighborhood of Columbia, is now available. This three-bedroom, one-bathroom ranch presents an excellent investment opportunity, whether you are looking for a renovation project, a first-time home, or a new addition to your rental portfolio. This property requires some updates but has significant potential due to its prime location. Disclaimer: CMLS has not reviewed and, therefore, does not endorse vendors who may appear in listings.
Key facts
- Renovation project
- Prime location
- 0.25 acre lot
Tags
Property features AI
Exterior
- Utilities: Public water; Public sewer
- Home design: Single-family property
- Construction: Crawlspace foundation
- Exterior features: Brick exterior above foundation; Paved road frontage
Interior
- Bedrooms: Primary bedroom on the main level; Additional bedrooms on the main level
- Bathrooms: One full bathroom on the main level; One full bathroom total
- Heating & cooling: Heating: Other (see remarks); Cooling: Other (see remarks)
- Interior features: Total heated area approximately 1,144
Neighborhood map
What this means for you Summary
Snapshot
- This is a 3-bed/2.0-bath single-family listed at $74k.
Deal economics
- At list price, monthly cash flow is $456 ($5k/yr) — positive.
- The deal already cash-flows at list — no discount required.
- Meets the 1% rule at list price ($1k rent vs $74k).
- Recommended offer: $72k (3.0% below list) — sets the bar for market timing.
- Cap rate 13.7% vs local median 5.0% in Columbia — top-decile yield for the area; either an underpriced asset or a hidden risk that comps aren't pricing in. Stress-test before assuming the spread holds.
Location & tenants
- Location reads 78/100 on livability (#18 in SC, #2,436 nationally) — a middle-class / working-renter tenant base. Strengths: amenities A+, commute A+, cost of living A+; Watch: employment D, crime F.
- Richland 01 (urban): math 26% / reading 36% proficiency, ranked #54 of 80 in SC (top 68%) — families likely to look elsewhere, expect single-tenant / working-renter base with shorter leases; 64% free/reduced lunch — lower-income household profile, screen leases tightly.
- Zoned schools: J. P. Thomas Elementary (math 12% / reading 12%, grade F, #572 of 597 statewide, top 97%, 323 students, 100% FRL); Alcorn Middle (math 2% / reading 12%, grade F, #228 of 229 statewide, top 100%, 370 students, 100% FRL); W.J. Keenan High (math 54% / reading 77%, grade B, #83 of 196 statewide, top 43%, 725 students, 100% FRL) — zoned schools average 100% FRL vs 64% district-wide (36 pts higher); higher-poverty schools than district average — tighter screening recommended.
- Market conditions: 1 active listings in the ZIP; 1 comparable units currently listed for rent nearby; 3,472 units permitted in Richland County in 2024 (1,096 in 5+ unit buildings).
Forward outlook
- In year one you build about $3k of equity ($512 loan paydown + $2k appreciation (3.0% local appreciation)).
- Richland County population projected at +30% by 2050 — long-run rental-demand tailwind backs the buy-and-hold thesis.
- At projected returns (3.0% appreciation + 3.0% rent growth), your $21k cash investment doubles in ~3 years — after that, you're playing with house money.
Negotiation context
- It's been on market 57 days — a 3% lower offer ($72k) is reasonable based on typical stale-listing flexibility.
- Current owner paid $33k; list at $74k implies a 124% gain — meaningful room to come down on a strong offer.
Risks & watch-outs
- Climate carrying-cost: extreme-heat days projected 7→16/yr by 2055 (HVAC capex compounding) — expect insurance premiums to compound above CPI over the hold.
Questions for the listing agent
- It's been on market 57 days. Have you received any prior offers? Is the seller open to a 3% concession, seller financing, or rate buy-down credit?
- Built in 1972 — when were the roof, HVAC, electrical panel, plumbing, and water heater last replaced?
- Is there a deadline driving the sale (1031 exchange, divorce, estate, relocation)? That informs how much negotiation room exists.
- Schools are D-rated, which usually means shorter tenancies and higher turnover. Who's the typical renter profile here, and what's been the actual vacancy rate?
- Crime grade is F in this area — have there been break-ins, vandalism, or insurance claims at this property in the last 3 years? What carrier currently insures it and at what premium?
- What's the average days-on-market for RENTAL listings here right now (not sales)? A rising rental-DOM trend means longer vacancies and softer asking-rent achievability than the comps imply.
- What's the recent tenant-quality profile in this submarket — average credit score on applications, eviction rate, late-payment / NSF rate, and stable-employment percentage? A property-management company in the area should have these aggregated.
- How much new for-sale + rental construction is in the pipeline within 1–3 miles? Heavy new supply typically softens prices + rents 12–24 months out; constrained supply supports both.
Investment metrics
- 1% rule
- 1.52% ✓
- Cap rate
- 13.69%
- Cash-on-cash
- 26.42%
- DSCR
- 2.18
- GRM
- 5.5
CMA / ARV
- ARV (on-the-fly)
- $153,296
- Comps found
- 4
Show comp detail 4 sales within ~0.75 mi
| Address | Dist | Beds/Ba | Sqft | Sold | Price | $/sf | Match |
|---|---|---|---|---|---|---|---|
| 709 Meadowlake Dr | 0.44mi | 3/2.0 | 1,102 (-4%) | 2mo | $148,000 | $134 | 72 |
| 416 Woodcrest Dr | 0.22mi | 3/2.0 | 1,175 (+3%) | 16mo | $174,000 | $148 | 72 |
| 436 Green Tree Cir | 0.12mi | 3/1.0 | 1,010 (-12%) | 2mo | $85,000 | $84 | 69 |
| 140 Beaver Brook Rd | 0.33mi | 3/1.0 | 1,100 (-4%) | 18mo | $90,000 | $82 | 60 |
Match score weights: distance 35% · size 25% · config 20% · recency 20%. Top-matched comps best support the ARV.
Projected returns pro-forma
3.0% appreciation · 3.0% rent growth · sell at horizon
- IRR
- 32.4%
- Equity multiple
- 2.83×
- Total profit
- $37,938
- Equity at exit
- $33,274
- IRR
- 32.7%
- Equity multiple
- 5.55×
- Total profit
- $94,304
- Equity at exit
- $51,279
Cash invested: $20,720 (down + closing). Projections, not guarantees.
Landlord ↔ Tenant lean methodology
- Overall (STATE)
- 90 Strongly Landlord-Friendly
- State South Carolina
- 90 Strongly Landlord-Friendly · R+6
- County
- — inherits STATE
- City
- — inherits STATE
ZIP-level market 29203-2315
- Active inventory
- 1
- Price-to-rent
- 5.5×
Monthly cashflow live
- Estimated rent
- $1,125 medium interval (Pro) →
- Mortgage (P&I)
- −$388
- Tax from tax record
- −$14 /mo · $164/yr
- Insurance
- −$31
- HOA
- −$0
- Lot rent
- −$0
- Vacancy / Maint / Mgmt
- −$236
- Net cashflow
- $456
Break-even live
Sensitivity live
| Price | -10% $498 | -5% $477 | +0% $456 | +5% $435 | +10% $414 |
|---|---|---|---|---|---|
| Rent | -10% $367 | -5% $412 | +0% $456 | +5% $501 | +10% $545 |
| Rate | -1.0pp $493 | -0.5pp $475 | base $456 | +0.5pp $437 | +1.0pp $418 |
UW: 25.0% down · 7.5% · 30yr · 1.5% tax · 5.0% vac · 8.0% maint · 8.0% mgmt
Financing live
Cash to close
- Down payment
- $18,500
- Closing costs
- $2,220
- Reserves months
- —
- Total cash needed
- —
Loan-product check · same deal, 3 products live
Conventional
25% down · 7.5% · 30yr
- Down + closing
- —
- Monthly P&I
- —
- Monthly cashflow
- —
- DSCR
- —
- Eligible?
- —
Personal DTI + credit; lowest rate.
DSCR
20% down · 8.5% · 30yr
- Down + closing
- —
- Monthly P&I
- —
- Monthly cashflow
- —
- DSCR
- —
- Eligible?
- —
No personal income docs; deal must DSCR.
Hard money
10% down · 12.0% · 12mo
- Down + closing
- —
- Monthly P&I
- —
- Monthly cashflow
- —
- DSCR
- —
- Eligible?
- —
Short-term bridge; refi at stabilization.
Rent comps 1 comps
| Address | Beds | Baths | Sqft | Rent | $/sqft | DOM | Units | Dist |
|---|---|---|---|---|---|---|---|---|
| 1407 Jerome Dr Columbia, SC | 2.0 | 1.0 | 700 | $1,125 | $1.61 | 26d | 1 | 0.75mi |
Listing history 19 events
-
2026-06-23days on market $74,000 Active 57 DOM
-
2026-06-21days on market $74,000 Active 56 DOM
-
2026-06-18days on market $74,000 Active 53 DOM
-
2026-06-17days on market $74,000 Active 52 DOM
-
2026-06-16days on market $74,000 Active 51 DOM
-
2026-06-15days on market $74,000 Active 50 DOM
-
2026-06-14days on market $74,000 Active 48 DOM
-
2026-06-10days on market $74,000 Active 45 DOM
-
2026-06-09days on market $74,000 Active 44 DOM
-
2026-06-08days on market $74,000 Active 43 DOM
-
2026-06-07days on market $74,000 Active 42 DOM
-
2026-06-03days on market $74,000 Active 38 DOM
-
2026-06-03days on market $74,000 Active 37 DOM
-
2026-06-01days on market $74,000 Active 36 DOM
-
2026-05-31days on market $74,000 Active 35 DOM
-
2026-05-21price $74,000
-
2026-04-27$79,000 Active
-
2026-03-16soldstatus $33,000
-
1979-06-01soldstatus $23,850
ⓘ Source: listings_history table (triggers on properties + properties_extension) + one-shot
backfill from property_details.listing_events for pre-trigger history.
Tax reassessment forecast SC · Resets to sale price
- Current annual tax
- $164 · $14/mo
- Projected year-2 tax
- $422 · $35/mo
- Expected delta
- +$258/yr (+$21/mo · 157.2%)
ⓘ Screening estimate from a state-policy table — verify with the county assessor before closing.
Climate risk First Street
- Flood 1/10 Low FEMA zone X · 0% chance over 30 yrs
- Wildfire 2/10 Low
- Heat 6/10 Major
Nearby sold comps map
Loading sold comps map…
Walkable amenities ~0.75 mi
Loading nearby amenities…
Taxation est. · year 1
- Rental income
- $13,500
- − Mortgage interest
- −$4,145
- − Property taxes
- −$164
- − Insurance
- −$370
- − Repairs & maintenance
- −$1,080
- − Management
- −$1,080
- − Depreciation
- −$2,153
- Taxable income
- $4,508
- Est. tax owed @ 24.0%
- −$1,082
- After-tax cash flow
- $4,392/yr
For passive investors: Depreciation is non-cash, so a rental often shows a tax loss while cash-flowing — sheltering income. Rental losses are passive: they offset passive income freely, and up to $25,000/yr can offset ordinary (W-2) income if you actively participate and your MAGI is under $100k (phasing out to $0 by $150k); unused losses carry forward. On sale, claimed depreciation is recaptured at up to 25%, and gains may owe capital-gains tax (a 1031 exchange can defer both). Figures are a year-1 estimate at your 24.0% rate — not tax advice; consult a CPA.
Schools (NCES district)
- District
- Richland 01
- NCES district ID
- 4503360
- Math proficiency
- 26% ▼ -7.00%
- Reading proficiency
- 36% ▼ -5.00%
- Median HH income
- $38,931
- Composite
- 25.94/100
- National rank
- #7335
- State rank
- #54 of 80 in SC
Livability — Columbia
- Score
- 78/100
- State rank
- #18
- US rank
- #2436
Category grades
Schools grade is shown separately in the Schools card above.
Census & demographics
No demographic data for this ZIP.
Market trends
- HPI YoY
- —
- Current HPI
- —
- Rent YoY
- —
- Metro
- —
- State GDP YoY
- ▲ 4.51%
- F500 in state
- 2
Industry mix (Fortune 500 HQ in SC)
| Industry | F500 HQs | Revenue |
|---|---|---|
| Packaging | 1 | $7B |
|
||
Price history
+210.3% since first listed4 events — show timeline
- 2026-05-21 Price Changed $74,000 Consolidated MLS
- 2026-04-27 Listed $79,000 Consolidated MLS
- 2026-03-16 Sold (Public Records) $33,000 Public Records
- 1979-06-01 Sold (Public Records) $23,850 Public Records
Property tax history
-16.8%/yrLatest (2025): $164 · +2.5% YoY. Source: county tax records.
Cash-flow waterfall
monthlySold comps — $/sqft
last 12 mo · ≤1 miLoading sold comps…