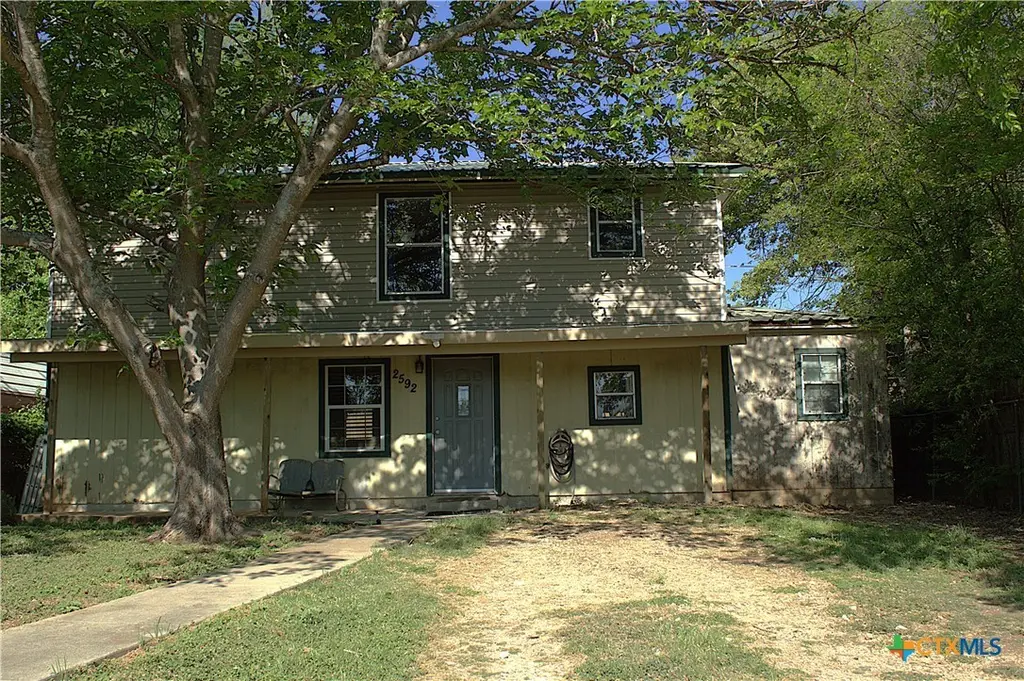
2592 Vista Trl · Belton, TX
Flood risk 1/10 · Minimal
- FEMA flood zone
- X (unshaded)
- Chance of flooding over 30 yrs
- 0.0%
- Est. flood insurance / yr
- $507 – $1,088
Fire risk 4/10 · Minor
- Est. fire insurance / yr
- $1,222 – $2,270
Heat risk 7/10 · Major
- Hot days now (above 108°F)
- 6 days/yr
- Hot days in 30 yrs
- 21 days/yr
Wind risk 6/10 · Moderate
- Chance of severe wind over 30 yrs
- 61.0%
Air-quality risk 1/10 · Minimal
- Unhealthy air days now
- 0 days/yr
- Unhealthy air days in 30 yrs
- 0 days/yr
Risk factors via First Street. Map © Google.
Why this score? — see what drove the D grade
The composite is a weighted blend of 9 inputs, each scored 0–100. Each bar is that input's sub-score; the figure is the points it added to the 100-point composite (weight × sub-score).
- Cash flow +15.7/30.0
- ARV discount +7.5/15.0
- DSCR +4.8/10.0
- 1% rule +3.9/10.0
- Schools +3.8/10.0
- Livability +3.4/5.0
- Rent growth +2.8/5.0
- Condition / age +2.5/5.0
- Appreciation +0.0/10.0
$129,500
🖨 Deal sheet 📄 Offer letter ✓ Due diligence
Listing remarks MLS
Affordable opportunity in Belton ISD near Stillhouse Hollow Lake! This 2-bedroom home offers over 1,400 square feet with spacious living areas, flex space for a home office or hobby room, and a functional two-story layout. Enjoy the charm of lake-area living with room to personalize and make it your own. Conveniently located near Belton Lake outdoor recreation, shopping, dining, and quick access to Temple and Killeen. Hard-to-find price point in Belton ISD.
Key facts
- Versatile room
- Unique layout
- 5,000 sq ft lot
Tags
Neighborhood map
What this means for you Summary
Snapshot
- This is a 2-bed/1.0-bath single-family listed at $130k.
Deal economics
- At list price, monthly cash flow is $56 ($672/yr) — positive.
- The deal already cash-flows at list — no discount required.
- To meet the 1% rule (rent ≥ 1% of price), the offer needs to be $116k (10.8% below list).
- Recommended offer: $116k (10.8% below list) — sets the bar for 1% rule.
- Cap rate 6.8% vs local median 3.6% in Belton — top-decile yield for the area; either an underpriced asset or a hidden risk that comps aren't pricing in. Stress-test before assuming the spread holds.
Location & tenants
- Location reads 68/100 on livability (#462 in TX) — a middle-class / working-renter tenant base. Strengths: cost of living A+, housing A+, crime A-; Watch: employment C-, schools D, amenities F.
- Belton ISD (suburban): math 39% / reading 46% proficiency, ranked #285 of 826 in TX (top 34%) — families likely to look elsewhere, expect single-tenant / working-renter base with shorter leases.
- Market conditions: Rents rising (+1.3%/yr); 745 active listings in the ZIP; solid renter incomes; 3,222 units permitted in Bell County in 2024 (246 in 5+ unit buildings).
- This rent is only 17% of the median local income ($81k/yr) — well below the 30% rent-burden line; pricing power to push rent on renewal without tenant pushback.
Forward outlook
- Local home prices are declining (-3.0%/yr); year-one equity from $895 of loan paydown is wiped out by about $4k of value loss. Plan a longer hold.
- Bell County population projected at +21% by 2050 — long-run rental-demand tailwind backs the buy-and-hold thesis.
Negotiation context
- It's been on market 80 days — a 6% lower offer ($122k) is reasonable based on typical stale-listing flexibility.
- 2 sale attempts since 2y ago with the ask held roughly flat each time — persistent listings suggest the price (not the market) is what's stuck; bring a comps-based counter.
Risks & watch-outs
- Climate carrying-cost: major wind risk, 61% chance of damaging wind over 30y; extreme-heat days projected 6→21/yr by 2055 (HVAC capex compounding) — expect insurance premiums to compound above CPI over the hold.
Questions for the listing agent
- It's been on market 80 days. Have you received any prior offers? Is the seller open to a 11% concession, seller financing, or rate buy-down credit?
- Why hasn't it sold? Are there any deal-killer items the seller is aware of (foundation, flood, title, zoning, code violations)?
- Is there a deadline driving the sale (1031 exchange, divorce, estate, relocation)? That informs how much negotiation room exists.
- Schools are D-rated, which usually means shorter tenancies and higher turnover. Who's the typical renter profile here, and what's been the actual vacancy rate?
- The area grade is low — what's the realistic commute time and amenity access for the typical tenant pool here? Any planned neighborhood developments (good or bad) we should know about?
- What's the average days-on-market for RENTAL listings here right now (not sales)? A rising rental-DOM trend means longer vacancies and softer asking-rent achievability than the comps imply.
- What's the recent tenant-quality profile in this submarket — average credit score on applications, eviction rate, late-payment / NSF rate, and stable-employment percentage? A property-management company in the area should have these aggregated.
- How much new for-sale + rental construction is in the pipeline within 1–3 miles? Heavy new supply typically softens prices + rents 12–24 months out; constrained supply supports both.
Investment metrics
- 1% rule
- 0.89% ✗
- Cap rate
- 6.81%
- Cash-on-cash
- 1.85%
- DSCR
- 1.08
- GRM
- 9.3
CMA / ARV
- ARV (median comp)
- $321,703
- List price
- $129,500
- Delta
- -59.75%
- Verdict
- UNDERPRICED
- Comps
- 2 within 1.0 mi
Projected returns pro-forma
-3.0% appreciation · 1.29% rent growth · sell at horizon
- IRR
- -15.2%
- Equity multiple
- 0.47×
- Total profit
- $-19,380
- Equity at exit
- $19,309
- IRR
- -9.7%
- Equity multiple
- 0.45×
- Total profit
- $-20,059
- Equity at exit
- $11,197
Cash invested: $36,260 (down + closing). Projections, not guarantees.
Landlord ↔ Tenant lean methodology
- Overall (STATE)
- 87 Strongly Landlord-Friendly
- State Texas
- 87 Strongly Landlord-Friendly · R+5
- County
- — inherits STATE
- City
- — inherits STATE
ZIP-level market 76513
- Rents YoY
- 1.3%
- Active inventory
- 745
- Price-to-rent
- 9.3×
Monthly cashflow live
- Estimated rent
- $1,156 medium interval (Pro) →
- Mortgage (P&I)
- −$679
- Tax from tax record
- −$124 /mo · $1,487/yr
- Insurance
- −$54
- HOA
- −$0
- Vacancy / Maint / Mgmt
- −$243
- Net cashflow
- $56
Break-even live
UW: 25.0% down · 7.5% · 30yr · 1.5% tax · 5.0% vac · 8.0% maint · 8.0% mgmt
Financing live
Cash to close
- Down payment
- $32,375
- Closing costs
- $3,885
- Reserves months
- —
- Total cash needed
- —
Loan-product check · same deal, 3 products live
Conventional
25% down · 7.5% · 30yr
- Down + closing
- —
- Monthly P&I
- —
- Monthly cashflow
- —
- DSCR
- —
- Eligible?
- —
Personal DTI + credit; lowest rate.
DSCR
20% down · 8.5% · 30yr
- Down + closing
- —
- Monthly P&I
- —
- Monthly cashflow
- —
- DSCR
- —
- Eligible?
- —
No personal income docs; deal must DSCR.
Hard money
10% down · 12.0% · 12mo
- Down + closing
- —
- Monthly P&I
- —
- Monthly cashflow
- —
- DSCR
- —
- Eligible?
- —
Short-term bridge; refi at stabilization.
Listing history 22 events
-
2026-06-18days on market $129,500 Active 80 DOM
-
2026-06-17days on market $129,500 Active 79 DOM
-
2026-06-16days on market $129,500 Active 78 DOM
-
2026-06-15days on market $129,500 Active 77 DOM
-
2026-06-14days on market $129,500 Active 75 DOM
-
2026-06-13days on market $129,500 Active 74 DOM
-
2026-06-09days on market $129,500 Active 71 DOM
-
2026-06-08days on market $129,500 Active 70 DOM
-
2026-06-07days on market $129,500 Active 69 DOM
-
2026-06-05days on market $129,500 Active 66 DOM
-
2026-06-03days on market $129,500 Active 65 DOM
-
2026-06-02days on market $129,500 Active 64 DOM
-
2026-06-01days on market $129,500 Active 63 DOM
-
2026-05-31days on market $129,500 Active 62 DOM
-
2026-05-30days on market $129,500 Active 61 DOM
-
2026-03-30$129,500 Active 461-char remark
Show marketing remark (461 chars)
Affordable opportunity in Belton ISD near Stillhouse Hollow Lake! This 2-bedroom home offers over 1,400 square feet with spacious living areas, flex space for a home office or hobby room, and a functional two-story layout. Enjoy the charm of lake-area living with room to personalize and make it your own. Conveniently located near Belton Lake outdoor recreation, shopping, dining, and quick access to Temple and Killeen. Hard-to-find price point in Belton ISD.
-
2025-02-18soldstatus
-
2025-02-13status Pending
-
2025-01-16historical Active Under Contract
-
2024-12-27$130,000 Active
-
2003-04-29soldstatus
-
1994-09-30soldstatus
ⓘ Source: listings_history table (triggers on properties + properties_extension) + one-shot
backfill from property_details.listing_events for pre-trigger history.
Tax reassessment forecast TX · Resets to sale price
- Current annual tax
- $1,487 · $124/mo
- Projected year-2 tax
- $2,370 · $197/mo
- Expected delta
- +$883/yr (+$74/mo · 59.4%)
ⓘ Screening estimate from a state-policy table — verify with the county assessor before closing.
Climate risk First Street
- Flood 1/10 Low FEMA zone X (unshaded) · 0% chance over 30 yrs
- Wildfire 4/10 Moderate
- Heat 7/10 Severe 6 d/yr ≥108°F today · 21 d/yr by 30 yrs out
- Wind 6/10 Major 61% chance of damaging wind over 30 yrs
- Air quality 1/10 Low 0 unhealthy d/yr today · 0 by 30 yrs out
Nearby sold comps map
Loading sold comps map…
Walkable amenities ~0.75 mi
Loading nearby amenities…
Taxation est. · year 1
- Rental income
- $13,868
- − Mortgage interest
- −$7,254
- − Property taxes
- −$1,487
- − Insurance
- −$648
- − Repairs & maintenance
- −$1,109
- − Management
- −$1,109
- − Depreciation
- −$3,767
- Taxable loss
- −$1,507
- Est. tax savings @ 24.0%
- +$362
- After-tax cash flow
- $1,033/yr
For passive investors: Depreciation is non-cash, so a rental often shows a tax loss while cash-flowing — sheltering income. Rental losses are passive: they offset passive income freely, and up to $25,000/yr can offset ordinary (W-2) income if you actively participate and your MAGI is under $100k (phasing out to $0 by $150k); unused losses carry forward. On sale, claimed depreciation is recaptured at up to 25%, and gains may owe capital-gains tax (a 1031 exchange can defer both). Figures are a year-1 estimate at your 24.0% rate — not tax advice; consult a CPA.
Schools (NCES district)
- District
- Belton ISD
- NCES district ID
- 4809860
- Math proficiency
- 39% ▼ -14.00%
- Reading proficiency
- 46% ▼ -4.00%
- Median HH income
- $61,239
- Composite
- 37.62/100
- National rank
- #4378
- State rank
- #285 of 826 in TX
Livability — Belton
- Score
- 68/100
- State rank
- #462
- US rank
- #9300
Category grades
Schools grade is shown separately in the Schools card above.
Census & demographics
- County
- Bell County · 345,090 people
- City population
- 45,928
- Metro
- Killeen-Temple, TX
- Population (ZIP)
- 45,928
- Household income
- $80,661
- Rent vs Own
- Severe rent burden
- 1198.0
Population outlook (Bell County) Hauer SSP2
- Today (2025)
- 371,114 people
- By 2030
- 389,104 · +4.8%
- By 2040
- 420,592 · +13.3%
- By 2050
- 447,779 · +20.7%
- By 2075
- 499,130 · +34.5%
- By 2100
- 505,680 · +36.3%
Race, ethnicity, and origin ACS 2023
- Neighborhood character
- Majority White (62%)
- Race & ethnicity
- White 62% Hispanic / Latino 24% Two or more races 14% Black 6% Asian 2%
- Hispanic origin (detail)
- Mexican 19% Puerto Rican 1%
- Common ancestry
- Italian 3% Slovak 2% Lithuanian 2%
- Foreign-born
- 9% · Canada, Vietnam
- Languages at home
- 83% English-only · Spanish 13% Korean 1% Other Indo-European 1%
Political lean MEDSL · Bell
- 2024 margin
- R (+16.2) · D 41.3% · R 57.6% · Other 1.1%
- 2008→2024 swing
- -6.5pp toward R · 2008: -9.8pp · 2024: -16.2pp
- All cycles
- 2024: R+16.2 2020: R+8.5 2016: R+15.1 2012: R+16.4 2008: R+9.8
Not yet ingested
- Civics
- —
Market trends
- HPI YoY
- ▼ -105.10%
- Current HPI
- 183.6715
- Rent YoY
- ▲ 1.29%
- Metro
- Killeen-Temple, TX
- State GDP YoY
- ▲ 3.95%
- F500 in state
- 110
Industry mix (Fortune 500 HQ in TX)
| Industry | F500 HQs | Revenue |
|---|---|---|
| Energy | 16 | $1,198B |
|
||
| Technology | 5 | $198B |
|
||
| Engineering / Construction | 4 | $72B |
|
||
| Energy Services | 3 | $60B |
|
||
| Utilities | 3 | $41B |
|
||
| Healthcare | 2 | $330B |
|
||
Price history
-0.4% since first listed7 events — show timeline
- 2026-03-30 Listed $129,500 CTXMLS
- 2025-02-18 Sold (Public Records) — Public Records
- 2025-02-13 Pending — CTXMLS
- 2025-01-16 Contingent — CTXMLS
- 2024-12-27 Listed $130,000 CTXMLS
- 2003-04-29 Sold (Public Records) — Public Records
- 1994-09-30 Sold (Public Records) — Public Records
Property tax history
+4.8%/yrLatest (2025): $1,487 · +9.1% YoY. Source: county tax records.
Cash-flow waterfall
monthlySold comps — $/sqft
last 12 mo · ≤1 miLoading sold comps…