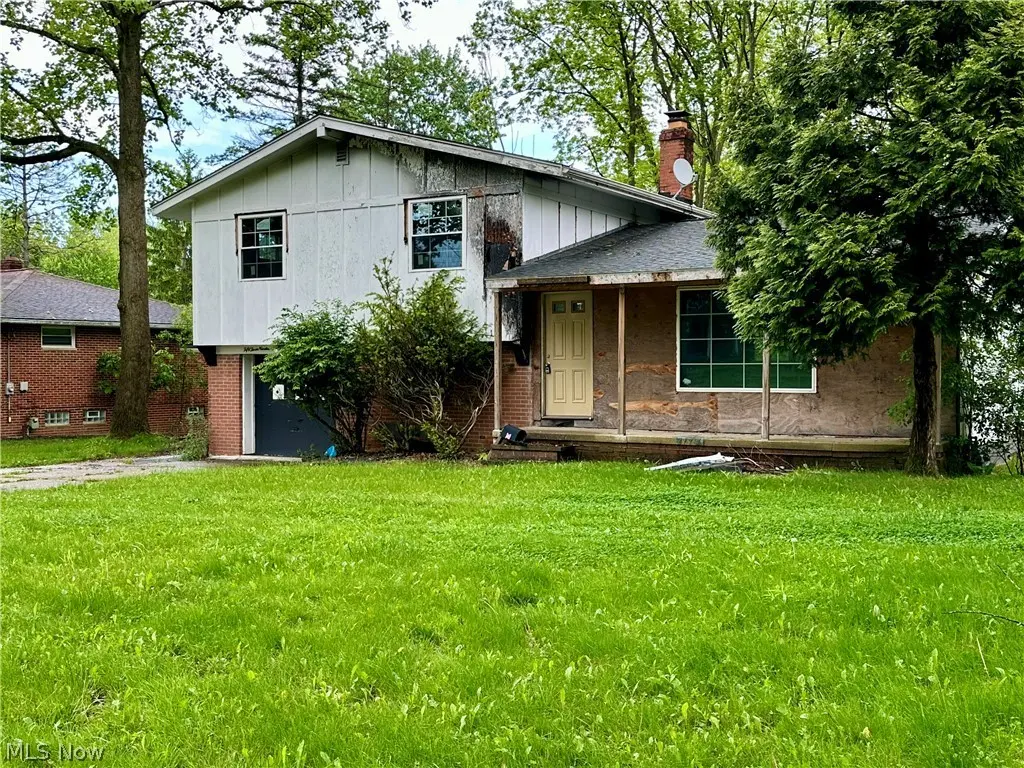
5319 Fairtree Rd · Bedford Heights, OH
Flood risk 1/10 · Minimal
- FEMA flood zone
- X (unshaded)
- Chance of flooding over 30 yrs
- 0.0%
- Est. flood insurance / yr
- $473 – $860
Fire risk 1/10 · Minimal
- Est. fire insurance / yr
- $713 – $1,323
Heat risk 2/10 · Minimal
- Hot days now (above 96°F)
- 7 days/yr
- Hot days in 30 yrs
- 16 days/yr
Wind risk 1/10 · Minimal
- Chance of severe wind over 30 yrs
- —
Air-quality risk 3/10 · Minor
- Unhealthy air days now
- 2 days/yr
- Unhealthy air days in 30 yrs
- 4 days/yr
Risk factors via First Street. Map © Google.
Why this score? — see what drove the B grade
The composite is a weighted blend of 9 inputs, each scored 0–100. Each bar is that input's sub-score; the figure is the points it added to the 100-point composite (weight × sub-score).
- Cash flow +25.7/30.0
- ARV discount +15.0/15.0
- 1% rule +10.0/10.0
- DSCR +8.6/10.0
- Rent growth +4.0/5.0
- Livability +3.4/5.0
- Condition / age +2.5/5.0
- Schools +2.2/10.0
- Appreciation +0.0/10.0
$99,999
🖨 Deal sheet (PDF) 📄 Offer letter ✓ Due diligence
Listing remarks MLS
Three Bedroom Split With Vaulted Ceiling And Lower Level Family Room And A Full Finished Basement
Key facts
- Vaulted ceilings
- Skylights
- Wooded rear setting
Tags
Property features AI
Finance
- Other: Above-grade finished area reported as 1,650 (source: owner)
- Financial info: Annual tax amount not included per instructions
- HOA & community: No HOA information provided
Exterior
- Parking: Attached garage (1 car); Driveway with paved, off-street parking; Garage faces front with garage door opener
- Security: Security features not specified
- Utilities: Public water; Public sewer; Electricity available (power not otherwise specified)
- Home design: Two-story house; Faces west; Property listed as fixer condition
- Construction: Built from brick, block and wood siding; Asphalt shingle roof; Brick/mortar and block foundation; Year built from public records
- Exterior features: Covered front porch and patio; Back yard
Interior
- Kitchen: Appliances not specified
- Bedrooms: Bedrooms not specifically listed
- Flooring: Flooring not specified
- Bathrooms: One full bathroom; One half bathroom; One main-level bathroom
- Heating & cooling: Forced-air heating; Gas heating
- Interior features: Total of 5 rooms; Partial, unfinished crawl space basement
- Laundry & utility: Laundry located in basement; Laundry tub / sink
Neighborhood map
What this means for you Summary
Snapshot
- This is a 3-bed/1.5-bath single-family listed at $100k.
Deal economics
- At list price, monthly cash flow is $239 ($3k/yr) — positive.
- The deal already cash-flows at list — no discount required.
- Meets the 1% rule at list price ($2k rent vs $100k).
Location & tenants
- Location reads 68/100 on livability (#573 in OH) — a middle-class / working-renter tenant base. Strengths: cost of living A+, housing A+, crime A-; Watch: amenities F, employment D-, health & safety F.
- Bedford City (suburban): math 19% / reading 32% proficiency, ranked #597 of 656 in OH (top 91%) — low school quality limits family demand, transient renter base, plan for 1-2y turnover.
- Zoned schools: Central Primary School (math 17% / reading 22%, grade F, #1,293 of 1,584 statewide, top 83%, 397 students, 76% FRL); Heskett Middle School (math 21% / reading 27%, grade F, #593 of 654 statewide, top 91%, 573 students, 69% FRL); Bedford High School (math 12% / reading 52%, grade F, #607 of 781 statewide, top 78%, 862 students, 69% FRL).
- Market conditions: Rents rising fast (+5.8%/yr); 107 active listings in the ZIP; 33 comparable units currently listed for rent nearby; rentals at typical pace (median 16d on market — plan ~3-4 weeks tenant-placement turnaround); 1,441 units permitted in Cuyahoga County in 2024 (700 in 5+ unit buildings).
- This rent runs 33% of the median local income ($55k/yr) — at the standard rent-burdened threshold; future hikes will face affordability resistance.
Forward outlook
- Local home prices are declining (-3.0%/yr); year-one equity from $691 of loan paydown is wiped out by about $3k of value loss. Plan a longer hold.
- Cuyahoga County population projected to shrink 8% by 2050 — rents likely to lag national; underwrite the cash flow, not the appreciation.
- At projected returns (-3.0% appreciation + 5.8% rent growth), your $28k cash investment doubles in ~8 years — after that, you're playing with house money.
Negotiation context
- Only 5 days on market — expect competitive offers; lowballing is unlikely to land.
- 2 sale attempts since 18y ago with the ask held roughly flat each time — persistent listings suggest the price (not the market) is what's stuck; bring a comps-based counter.
- Current owner paid $35k; list at $100k implies a 186% gain — meaningful room to come down on a strong offer.
Risks & watch-outs
- Watch-outs: property tax is 4.6% of price; built in 1957 — expect roof / HVAC / electrical / plumbing capex.
Questions for the listing agent
- Built in 1957 — when were the roof, HVAC, electrical panel, plumbing, and water heater last replaced?
- Property tax is high relative to price — has the assessment been appealed recently, and will the sale trigger a re-assessment?
- Is there a deadline driving the sale (1031 exchange, divorce, estate, relocation)? That informs how much negotiation room exists.
- Schools are D-rated, which usually means shorter tenancies and higher turnover. Who's the typical renter profile here, and what's been the actual vacancy rate?
- What's the average days-on-market for RENTAL listings here right now (not sales)? A rising rental-DOM trend means longer vacancies and softer asking-rent achievability than the comps imply.
- What's the recent tenant-quality profile in this submarket — average credit score on applications, eviction rate, late-payment / NSF rate, and stable-employment percentage? A property-management company in the area should have these aggregated.
- How much new for-sale + rental construction is in the pipeline within 1–3 miles? Heavy new supply typically softens prices + rents 12–24 months out; constrained supply supports both.
Investment metrics
- 1% rule
- 1.50% ✓
- Cap rate
- 9.16%
- Cash-on-cash
- 10.25%
- DSCR
- 1.46
- GRM
- 5.5
CMA / ARV
- ARV (on-the-fly)
- $165,750
- Comps found
- 12
Show comp detail 12 sales within ~0.75 mi
| Address | Dist | Beds/Ba | Sqft | Sold | Price | $/sf | Match |
|---|---|---|---|---|---|---|---|
| 5345 Fairtree Rd | 0.07mi | 3/1.5 | 1,363 (+3%) | 4mo | $244,000 | $179 | 89 |
| 5328 Fairtree Rd | 0.04mi | 3/1.5 | 1,328 (+0%) | 12mo | $245,000 | $184 | 88 |
| 21607 Libby Rd | 0.40mi | 3/1.5 | 1,350 (+2%) | 3mo | $63,000 | $47 | 76 |
| 5424 Fairtree Rd | 0.19mi | 4/1.5 (+1) | 1,438 (+8%) | 3mo | $179,500 | $125 | 69 |
| 23340 Comstock Rd | 0.38mi | 3/1.5 | 1,285 (-3%) | 12mo | $160,000 | $125 | 67 |
| 20739 Donny Brook Rd | 0.56mi | 3/2.0 | 1,368 (+3%) | 5mo | $171,500 | $125 | 63 |
| 20750 Bowling Green Rd | 0.50mi | 3/2.0 | 1,248 (-6%) | 6mo | $147,000 | $118 | 60 |
| 20814 Clare Ave | 0.72mi | 3/1.5 | 1,248 (-6%) | 2mo | $144,200 | $116 | 55 |
| 5420 Washburn Rd | 0.42mi | 3/1.5 | 1,169 (-12%) | 9mo | $220,000 | $188 | 53 |
| 20716 Kenyon Dr | 0.69mi | 3/1.5 | 1,440 (+9%) | 8mo | $151,000 | $105 | 47 |
| 20806 Clare Ave | 0.73mi | 3/1.0 | 1,449 (+9%) | 3mo | $133,000 | $92 | 46 |
| 5606 Carlton Dr | 0.68mi | 3/2.5 | 1,460 (+10%) | 9mo | $190,000 | $130 | 40 |
Match score weights: distance 35% · size 25% · config 20% · recency 20%. Top-matched comps best support the ARV.
Projected returns pro-forma
-3.0% appreciation · 5.83% rent growth · sell at horizon
- IRR
- 3.2%
- Equity multiple
- 1.13×
- Total profit
- $3,610
- Equity at exit
- $14,910
- IRR
- 16.0%
- Equity multiple
- 2.52×
- Total profit
- $42,626
- Equity at exit
- $8,646
Cash invested: $28,000 (down + closing). Projections, not guarantees.
Landlord ↔ Tenant lean methodology
- Overall (STATE)
- 73 Landlord-Friendly
- State Ohio
- 73 Landlord-Friendly · R+6
- County
- — inherits STATE
- City
- — inherits STATE
ZIP-level market 44146
- Rents YoY
- 5.8%
- Active inventory
- 107
- Price-to-rent
- 5.5×
Monthly cashflow live
- Estimated rent
- $1,503 high interval (Pro) →
- Mortgage (P&I)
- −$524
- Tax from tax record
- −$382 /mo · $4,582/yr
- Insurance
- −$42
- HOA
- −$0
- Vacancy / Maint / Mgmt
- −$316
- Net cashflow
- $239
Break-even live
Sensitivity live
| Price | -10% $565 | -5% $267 | +0% $239 | +5% $211 | +10% $183 |
|---|---|---|---|---|---|
| Rent | -10% $120 | -5% $180 | +0% $239 | +5% $299 | +10% $358 |
| Rate | -1.0pp $290 | -0.5pp $265 | base $239 | +0.5pp $213 | +1.0pp $187 |
UW: 25.0% down · 7.5% · 30yr · 1.5% tax · 5.0% vac · 8.0% maint · 8.0% mgmt
Financing live
Cash to close
- Down payment
- $25,000
- Closing costs
- $3,000
- Reserves months
- —
- Total cash needed
- —
Loan-product check · same deal, 3 products live
Conventional
25% down · 7.5% · 30yr
- Down + closing
- —
- Monthly P&I
- —
- Monthly cashflow
- —
- DSCR
- —
- Eligible?
- —
Personal DTI + credit; lowest rate.
DSCR
20% down · 8.5% · 30yr
- Down + closing
- —
- Monthly P&I
- —
- Monthly cashflow
- —
- DSCR
- —
- Eligible?
- —
No personal income docs; deal must DSCR.
Hard money
10% down · 12.0% · 12mo
- Down + closing
- —
- Monthly P&I
- —
- Monthly cashflow
- —
- DSCR
- —
- Eligible?
- —
Short-term bridge; refi at stabilization.
Rent comps 33 comps
| Address | Beds | Baths | Sqft | Rent | $/sqft | DOM | Units | Dist |
|---|---|---|---|---|---|---|---|---|
| 5303 Northfield Rd Bedford Heights, OH | 2.0 | 1.0–2.0 | 712 | $1,210 | $1.70 | 4d | 28 | 0.25mi |
| 21303 Kenyon Dr Maple Heights, OH | 3.0 | 1.0 | 1215 | $1,400 | $1.15 | 45d | 1 | 0.56mi |
| 21106 Gardenview Dr Maple Heights, OH | 3.0 | 2.0 | 1188 | $1,600 | $1.35 | 3d | 1 | 0.59mi |
| 5383 Sunnyslope Rd Maple Heights, OH | 1.0–2.0 | 1.0–1.5 | 847 | $1,075 | $1.27 | 5d | 2 | 0.62mi |
| 21418 Raymond St Maple Heights, OH | 3.0 | 2.0 | 1158 | $1,695 | $1.46 | 16d | 1 | 0.62mi |
| 21206 Hillgrove Ave Maple Heights, OH | 3.0 | 1.5 | 1056 | $1,375 | $1.30 | 45d | 1 | 0.62mi |
| 21111 Raymond St Maple Heights, OH | 3.0 | 1.0 | 1100 | $1,275 | $1.16 | 45d | 1 | 0.74mi |
| 20517 Mountville Dr Maple Heights, OH | 3.0 | 3.0 | 1329 | $1,731 | $1.30 | 45d | 1 | 0.81mi |
| 20510 Mountville Dr Maple Heights, OH | 3.0 | 1.0 | 1131 | $1,850 | $1.64 | 45d | 1 | 0.81mi |
| 20609 Hillgrove Ave Maple Heights, OH | 4.0 | 2.0 | 1776 | $1,497 | $0.84 | 17d | 1 | 0.84mi |
| 20115 Libby Rd Maple Heights, OH | 3.0 | 1.0 | 1365 | $1,995 | $1.46 | 3d | 1 | 0.91mi |
| 20600 Watson Rd Maple Heights, OH | 3.0 | 1.5 | 1092 | $1,953 | $1.79 | 3d | 1 | 0.93mi |
| 23755 Banbury Cir #10 Cleveland, OH | 2.0 | 1.5 | 1116 | $1,075 | $0.96 | 17d | 1 | 0.94mi |
| 20605 Hansen Rd Maple Heights, OH | 4.0 | 1.0 | 1164 | $1,850 | $1.59 | 45d | 1 | 0.97mi |
| 4889 Banbury Ct Warrensville Heights, OH | 2.0 | 2.0 | 1116 | $1,075 | $0.96 | 17d | 1 | 1.03mi |
| 19758 Maple Heights Blvd Unit UP Maple Heights, OH | 3.0 | 1.0 | 1095 | $1,495 | $1.37 | 4d | 1 | 1.10mi |
| 19500 Libby Rd Maple Heights, OH | 3.0 | 1.5 | 1092 | $2,300 | $2.11 | 3d | 1 | 1.19mi |
| 25400 Rockside Rd Bedford Heights, OH | 1.0–3.0 | 1.0–2.0 | 870 | $1,455 | $1.67 | 3d | 6 | 1.19mi |
| 243 Grand Blvd Bedford, OH | 3.0 | 2.0 | 1170 | $1,500 | $1.28 | 45d | 1 | 1.26mi |
| 19409 Raymond St Maple Heights, OH | 3.0 | 1.0 | 1180 | $1,656 | $1.40 | 3d | 1 | 1.27mi |
| 19313 Longview Ave Maple Heights, OH | 4.0 | 2.0 | 1796 | $1,970 | $1.10 | 5d | 1 | 1.30mi |
| 19203 Nitra Ave Maple Heights, OH | 3.0 | 1.0 | 1050 | $1,350 | $1.29 | 5d | 1 | 1.33mi |
| 19101 Nitra Ave Maple Heights, OH | 3.0 | 1.0 | 1200 | $1,295 | $1.08 | 16d | 1 | 1.37mi |
| 5535 Oakwood Ave Maple Heights, OH | 3.0 | 1.0 | 1116 | $1,350 | $1.21 | 9d | 1 | 1.37mi |
| 5535 Oakwood Ave Maple Heights, OH | 3.0 | 1.0 | 1116 | $1,350 | $1.21 | 5d | 1 | 1.37mi |
| 6055 Bear Creek Dr Bedford Heights, OH | 1.0–2.0 | 1.0–1.5 | 815 | $1,081 | $1.33 | 4d | 30 | 1.39mi |
| 5333 Hollywood Ave Maple Heights, OH | 3.0 | 1.0 | 1092 | $1,450 | $1.33 | 45d | 1 | 1.40mi |
| 19001 Nitra Ave Maple Heights, OH | 3.0 | 1.0 | 1170 | $1,450 | $1.24 | 17d | 1 | 1.41mi |
| 18990 Raymond St Maple Heights, OH | 4.0 | 1.5 | 1480 | $1,750 | $1.18 | 3d | 1 | 1.43mi |
| 5440 Hollywood Ave Maple Heights, OH | 3.0 | 1.0 | 1080 | $1,445 | $1.34 | 22d | 1 | 1.43mi |
| 5470 Hollywood Ave Maple Heights, OH | 3.0 | 1.0 | 1150 | $1,375 | $1.20 | 45d | 1 | 1.44mi |
| 14 Ennis Ave Bedford, OH | 3.0 | 2.0 | 1064 | $1,495 | $1.41 | 45d | 1 | 1.44mi |
| 18851 Raymond St Maple Heights, OH | 4.0 | 2.0 | 1330 | $2,500 | $1.88 | 9d | 1 | 1.48mi |
Listing history 6 events
-
2026-05-22$99,999 Active
-
2009-03-09soldstatus $35,000 97-char remark
Show marketing remark (97 chars)
Three Bedroom Split With Vaulted Ceiling And Lower Level Family Room And A Full Finished Basement
-
2009-01-23historical 97-char remark
Show marketing remark (97 chars)
Three Bedroom Split With Vaulted Ceiling And Lower Level Family Room And A Full Finished Basement
-
2008-10-28$39,900 97-char remark
Show marketing remark (97 chars)
Three Bedroom Split With Vaulted Ceiling And Lower Level Family Room And A Full Finished Basement
-
1988-08-25soldstatus $69,000
-
1986-05-02soldstatus $63,000
ⓘ Source: listings_history table (triggers on properties + properties_extension) + one-shot
backfill from property_details.listing_events for pre-trigger history.
Tax reassessment forecast OH · Partial reset (capped growth)
- Current annual tax
- $4,582 · $382/mo
- Projected year-2 tax
- $4,582 · $382/mo
- Expected delta
- $0/yr ($0/mo · 0.0%)
ⓘ Screening estimate from a state-policy table — verify with the county assessor before closing.
Climate risk First Street
- Flood 1/10 Low FEMA zone X (unshaded) · 0% chance over 30 yrs
- Wildfire 1/10 Low
- Heat 2/10 Low 7 d/yr ≥96°F today · 16 d/yr by 30 yrs out
- Wind 1/10 Low
- Air quality 3/10 Moderate 2 unhealthy d/yr today · 4 by 30 yrs out
Nearby sold comps map
Loading sold comps map…
Walkable amenities ~0.75 mi
Loading nearby amenities…
Taxation est. · year 1
- Rental income
- $18,032
- − Mortgage interest
- −$5,601
- − Property taxes
- −$4,582
- − Insurance
- −$500
- − Repairs & maintenance
- −$1,443
- − Management
- −$1,443
- − Depreciation
- −$2,909
- Taxable income
- $1,554
- Est. tax owed @ 24.0%
- −$373
- After-tax cash flow
- $2,497/yr
For passive investors: Depreciation is non-cash, so a rental often shows a tax loss while cash-flowing — sheltering income. Rental losses are passive: they offset passive income freely, and up to $25,000/yr can offset ordinary (W-2) income if you actively participate and your MAGI is under $100k (phasing out to $0 by $150k); unused losses carry forward. On sale, claimed depreciation is recaptured at up to 25%, and gains may owe capital-gains tax (a 1031 exchange can defer both). Figures are a year-1 estimate at your 24.0% rate — not tax advice; consult a CPA.
Schools (NCES district)
- District
- Bedford City
- NCES district ID
- 3910017
- Math proficiency
- 19% ▼ -23.00%
- Reading proficiency
- 32% ▼ -16.00%
- Median HH income
- $42,353
- Composite
- 21.69/100
- National rank
- #8273
- State rank
- #597 of 656 in OH
Livability — Bedford Heights
- Score
- 68/100
- State rank
- #573
- US rank
- #9748
Category grades
Schools grade is shown separately in the Schools card above.
Census & demographics
- Census place
- Bedford Heights, OH
- County
- Cuyahoga County · 1,090,369 people
- Metro
- Cleveland-Elyria, OH
- Population (ZIP)
- 29,349
- Household income
- $54,925
- Rent vs Own
- Severe rent burden
- 1314.0
Population outlook (Cuyahoga County) Hauer SSP2
- Today (2025)
- 1,244,621 people
- By 2030
- 1,230,093 · -1.2%
- By 2040
- 1,189,108 · -4.5%
- By 2050
- 1,145,706 · -7.9%
- By 2075
- 1,076,557 · -13.5%
- By 2100
- 978,987 · -21.3%
Race, ethnicity, and origin ACS 2023
- Neighborhood character
- Majority Black (59%)
- Race & ethnicity
- Black 59% White 33% Two or more races 6% Hispanic / Latino 3%
- Common ancestry
- Romanian 5% Serbian 1% Armenian 1%
- Foreign-born
- 2% · Canada
- Languages at home
- 96% English-only · Spanish 2% Arabic 1%
Political lean MEDSL · Cuyahoga
- 2024 margin
- Solid D (+31.5) · D 65.4% · R 33.9%
- 2008→2024 swing
- -7.4pp toward R · 2008: 38.9pp · 2024: 31.5pp
- All cycles
- 2024: D+31.5 2020: D+34.1 2016: D+35.0 2012: D+38.7 2008: D+38.9
Not yet ingested
- Civics
- —
Market trends
- HPI YoY
- ▼ -114.08%
- Current HPI
- 172.9421
- Rent YoY
- ▲ 5.83%
- Metro
- Cleveland-Elyria, OH
- State GDP YoY
- ▲ 1.98%
- F500 in state
- 48
Industry mix (Fortune 500 HQ in OH)
| Industry | F500 HQs | Revenue |
|---|---|---|
| Insurance | 3 | $145B |
|
||
| Industrial Machinery | 3 | $49B |
|
||
| Financial Services | 3 | $24B |
|
||
| Consumer Goods | 2 | $93B |
|
||
| Aerospace / Defense | 2 | $47B |
|
||
| Utilities | 2 | $33B |
|
||
Price history
+58.7% since first listed6 events — show timeline
- 2026-05-22 Listed $99,999 MLSNOW
- 2009-03-09 Sold (MLS) $35,000 MLSNOW
- 2009-01-23 Listing Removed — MLSNOW
- 2008-10-28 Listed $39,900 MLSNOW
- 1988-08-25 Sold (Public Records) $69,000 Public Records
- 1986-05-02 Sold (Public Records) $63,000 Public Records
Property tax history
+4.2%/yrLatest (2025): $4,582 · -0.0% YoY. Source: county tax records.
Cash-flow waterfall
monthlySold comps — $/sqft
last 12 mo · ≤1 miLoading sold comps…