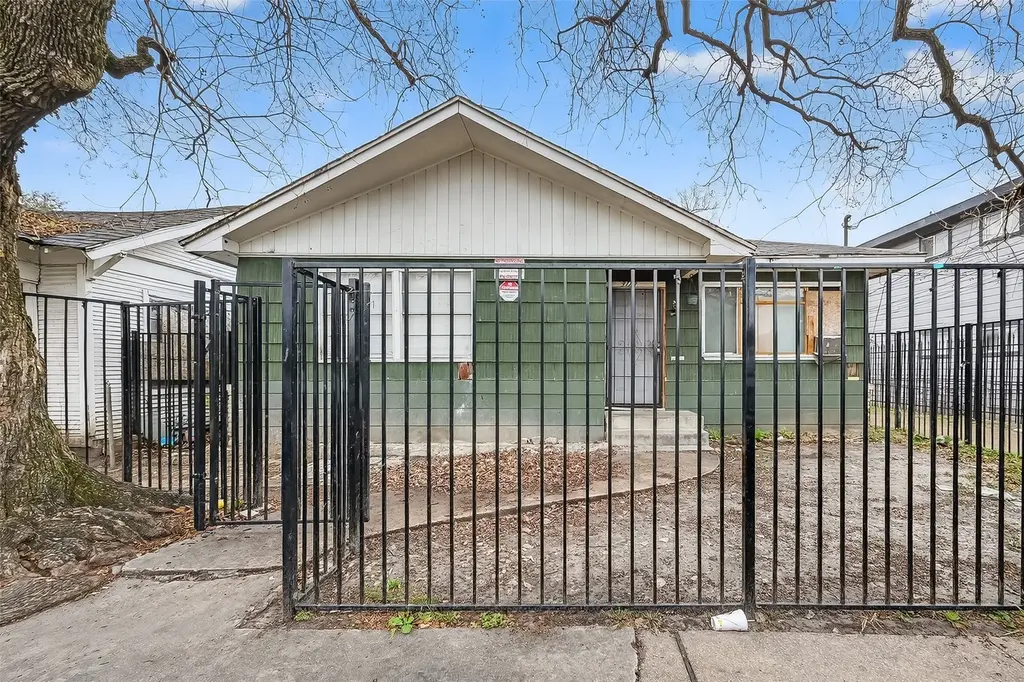
3113 Anita St · Houston, TX
Flood risk 5/10 · Moderate
- FEMA flood zone
- X (unshaded)
- Chance of flooding over 30 yrs
- 0.66%
- Est. flood insurance / yr
- $507 – $1,088
Fire risk 1/10 · Minimal
- Est. fire insurance / yr
- $1,222 – $2,270
Heat risk 9/10 · Severe
- Hot days now (above 109°F)
- 7 days/yr
- Hot days in 30 yrs
- 24 days/yr
Wind risk 9/10 · Severe
- Chance of severe wind over 30 yrs
- 99.0%
Air-quality risk 2/10 · Minimal
- Unhealthy air days now
- 2 days/yr
- Unhealthy air days in 30 yrs
- 2 days/yr
Risk factors via First Street. Map © Google.
Why this score? — see what drove the B- grade
The composite is a weighted blend of 9 inputs, each scored 0–100. Each bar is that input's sub-score; the figure is the points it added to the 100-point composite (weight × sub-score).
- Cash flow +26.1/30.0
- ARV discount +15.0/15.0
- DSCR +8.8/10.0
- 1% rule +8.4/10.0
- Livability +3.7/5.0
- Schools +2.7/10.0
- Condition / age +2.5/5.0
- Rent growth +2.4/5.0
- Appreciation +0.0/10.0
$139,900
🖨 Deal sheet (PDF) 📄 Offer letter ✓ Due diligence
Listing remarks
Great investment opportunity with great locations. This 3 bedroom, 1 and 1/2 bathroom has a great location near the museum district, medical center and Houston downtown.
Key facts
- Medical center
- Houston downtown
- Museum district
Tags
Property features AI
Finance
- Financial info: Lease not considered
- HOA & community: Community curbs
Exterior
- Parking: No designated parking
- Utilities: Public water; Public sewer
- Home design: Residential property; Faces southwest; Built in 1950; Single-level living area of 1,282
- Construction: Cement siding; Composition roof; Slab foundation
- Exterior features: Concrete road access; Located in a subdivision
Interior
- Kitchen: Gas range; Microwave; Oven
- Bedrooms: 3 total rooms (includes bedrooms and living spaces)
- Flooring: Laminate flooring
- Bathrooms: 1 full bathroom; 1 half bathroom
- Heating & cooling: Central heating (gas); Window cooling units
- Interior features: Primary bedroom has a private bath; Tub/shower combination
- Laundry & utility: Washer hookup; Gas dryer hookup
Neighborhood map
What this means for you Summary
Snapshot
- This is a 3-bed/1.5-bath single-family listed at $140k.
Deal economics
- At list price, monthly cash flow is $351 ($4k/yr) — positive.
- The deal already cash-flows at list — no discount required.
- Meets the 1% rule at list price ($2k rent vs $140k).
- Recommended offer: $136k (3.0% below list) — sets the bar for market timing.
- Cap rate 9.3% vs local median 3.2% in Houston — top-decile yield for the area; either an underpriced asset or a hidden risk that comps aren't pricing in. Stress-test before assuming the spread holds.
Location & tenants
- Location reads 74/100 on livability (#184 in TX, #4,771 nationally) — a middle-class / working-renter tenant base. Strengths: amenities A+, cost of living A+, housing A+; Watch: crime F.
- Houston ISD (urban): math 27% / reading 35% proficiency, ranked #593 of 826 in TX (top 72%) — families likely to look elsewhere, expect single-tenant / working-renter base with shorter leases; 71% free/reduced lunch — lower-income household profile, screen leases tightly.
- Zoned schools: Blackshear El (math 27% / reading 32%, grade F, #2,525 of 4,322 statewide, top 62%, 308 students, 99% FRL); Cullen Middle (math 6% / reading 14%, grade F, #1,641 of 1,662 statewide, top 99%, 324 students, 100% FRL); Yates H S (math 12% / reading 23%, grade F, #1,451 of 1,632 statewide, top 89%, 851 students, 96% FRL) — zoned schools average 98% FRL vs 71% district-wide (27 pts higher); higher-poverty schools than district average — tighter screening recommended.
- Zoned-school proficiency averages 19% at this address vs 31% district-wide (-12 pts) — the specific schools serving this property underperform the Houston ISD average; the district grade overstates school quality for this exact location.
- Market conditions: Rents soft (-0.3%/yr); 585 active listings in the ZIP; 40 comparable units currently listed for rent nearby; rentals at typical pace (median 22d on market — plan ~3-4 weeks tenant-placement turnaround); 29,883 units permitted in Harris County in 2024 (8,621 in 5+ unit buildings).
- This rent runs 32% of the median local income ($71k/yr) — at the standard rent-burdened threshold; future hikes will face affordability resistance.
Forward outlook
- Local home prices are declining (-3.0%/yr); year-one equity from $967 of loan paydown is wiped out by about $4k of value loss. Plan a longer hold.
- Harris County population projected at +47% by 2050 — long-run rental-demand tailwind backs the buy-and-hold thesis.
Negotiation context
- It's been on market 39 days — a 3% lower offer ($136k) is reasonable based on typical stale-listing flexibility.
- 8 sale attempts since 2y ago with the ask held roughly flat each time — persistent listings suggest the price (not the market) is what's stuck; bring a comps-based counter.
Risks & watch-outs
- Watch-outs: property tax is 2.9% of price; built in 1950 — expect roof / HVAC / electrical / plumbing capex.
- Climate carrying-cost: moderate flood risk; severe wind risk, 99% chance of damaging wind over 30y; extreme-heat days projected 7→24/yr by 2055 (HVAC capex compounding) — expect insurance premiums to compound above CPI over the hold.
Questions for the listing agent
- It's been on market 39 days. Have you received any prior offers? Is the seller open to a 3% concession, seller financing, or rate buy-down credit?
- Built in 1950 — when were the roof, HVAC, electrical panel, plumbing, and water heater last replaced?
- Property tax is high relative to price — has the assessment been appealed recently, and will the sale trigger a re-assessment?
- Is there a deadline driving the sale (1031 exchange, divorce, estate, relocation)? That informs how much negotiation room exists.
- Schools are D-rated, which usually means shorter tenancies and higher turnover. Who's the typical renter profile here, and what's been the actual vacancy rate?
- Crime grade is F in this area — have there been break-ins, vandalism, or insurance claims at this property in the last 3 years? What carrier currently insures it and at what premium?
- What's the average days-on-market for RENTAL listings here right now (not sales)? A rising rental-DOM trend means longer vacancies and softer asking-rent achievability than the comps imply.
- What's the recent tenant-quality profile in this submarket — average credit score on applications, eviction rate, late-payment / NSF rate, and stable-employment percentage? A property-management company in the area should have these aggregated.
- How much new for-sale + rental construction is in the pipeline within 1–3 miles? Heavy new supply typically softens prices + rents 12–24 months out; constrained supply supports both.
Investment metrics
- 1% rule
- 1.34% ✓
- Cap rate
- 9.31%
- Cash-on-cash
- 10.76%
- DSCR
- 1.48
- GRM
- 6.2
CMA / ARV
- ARV (median comp)
- $220,893
- List price
- $139,900
- Delta
- -36.67%
- Verdict
- UNDERPRICED
- Comps
- 20 within 1.0 mi
Show comp detail 12 sales within ~0.75 mi
| Address | Dist | Beds/Ba | Sqft | Sold | Price | $/sf | Match |
|---|---|---|---|---|---|---|---|
| 3022 Mcilhenny St | 0.27mi | 3/2.0 | 1,319 (+3%) | 8mo | $179,900 | $136 | 74 |
| 3704 Sauer St | 0.42mi | 3/2.0 | 1,232 (-4%) | 1mo | $219,900 | $178 | 71 |
| 1747 Aden Mist Dr | 0.64mi | 2/2.0 (-1) | 1,283 (+0%) | 0mo | $279,000 | $217 | 63 |
| 3605 Mcgowen St | 0.59mi | 3/2.0 | 1,254 (-2%) | 7mo | $205,000 | $163 | 61 |
| 3135 Webster St | 0.43mi | 3/2.0 | 1,189 (-7%) | 12mo | $299,000 | $251 | 56 |
| 1723 Aden Dr | 0.67mi | 2/2.0 (-1) | 1,298 (+1%) | 13mo | $299,000 | $230 | 49 |
| 3313 Sampson St | 0.35mi | 2/1.5 (-1) | 1,092 (-15%) | 8mo | $90,000 | $82 | 47 |
| 2513 Isabella St | 0.68mi | 3/1.0 | 1,176 (-8%) | 8mo | $274,299 | $233 | 46 |
| 3609 Beulah St | 0.58mi | 3/2.0 | 1,427 (+11%) | 12mo | $240,000 | $168 | 42 |
| 1721 Aden Dr | 0.67mi | 3/2.5 | 1,410 (+10%) | 12mo | $295,000 | $209 | 38 |
| 1774 Aden Dr | 0.64mi | 2/2.5 (-1) | 1,410 (+10%) | 8mo | $289,000 | $205 | 38 |
| 1773 Aden Dr | 0.64mi | 2/2.5 (-1) | 1,410 (+10%) | 10mo | $284,900 | $202 | 36 |
Match score weights: distance 35% · size 25% · config 20% · recency 20%. Top-matched comps best support the ARV.
Projected returns pro-forma
-3.0% appreciation · 0.0% rent growth · sell at horizon
- IRR
- -4.0%
- Equity multiple
- 0.86×
- Total profit
- $-5,660
- Equity at exit
- $20,860
- IRR
- 1.4%
- Equity multiple
- 1.08×
- Total profit
- $3,191
- Equity at exit
- $12,096
Cash invested: $39,172 (down + closing). Projections, not guarantees.
Landlord ↔ Tenant lean methodology
- Overall (STATE)
- 87 Strongly Landlord-Friendly
- State Texas
- 87 Strongly Landlord-Friendly · R+5
- County
- — inherits STATE
- City
- — inherits STATE
ZIP-level market 77004
- Rents YoY
- -0.3%
- Active inventory
- 585
- Price-to-rent
- 6.2×
Monthly cashflow live
- Estimated rent
- $1,872 high interval (Pro) →
- Mortgage (P&I)
- −$734
- Tax from tax record
- −$336 /mo · $4,026/yr
- Insurance
- −$58
- HOA
- −$0
- Vacancy / Maint / Mgmt
- −$393
- Net cashflow
- $351
Break-even live
Sensitivity live
| Price | -10% $430 | -5% $391 | +0% $351 | +5% $312 | +10% $272 |
|---|---|---|---|---|---|
| Rent | -10% $203 | -5% $277 | +0% $351 | +5% $425 | +10% $499 |
| Rate | -1.0pp $422 | -0.5pp $387 | base $351 | +0.5pp $315 | +1.0pp $278 |
UW: 25.0% down · 7.5% · 30yr · 1.5% tax · 5.0% vac · 8.0% maint · 8.0% mgmt
Financing live
Cash to close
- Down payment
- $34,975
- Closing costs
- $4,197
- Reserves months
- —
- Total cash needed
- —
Loan-product check · same deal, 3 products live
Conventional
25% down · 7.5% · 30yr
- Down + closing
- —
- Monthly P&I
- —
- Monthly cashflow
- —
- DSCR
- —
- Eligible?
- —
Personal DTI + credit; lowest rate.
DSCR
20% down · 8.5% · 30yr
- Down + closing
- —
- Monthly P&I
- —
- Monthly cashflow
- —
- DSCR
- —
- Eligible?
- —
No personal income docs; deal must DSCR.
Hard money
10% down · 12.0% · 12mo
- Down + closing
- —
- Monthly P&I
- —
- Monthly cashflow
- —
- DSCR
- —
- Eligible?
- —
Short-term bridge; refi at stabilization.
Rent comps 40 comps
| Address | Beds | Baths | Sqft | Rent | $/sqft | DOM | Units | Dist |
|---|---|---|---|---|---|---|---|---|
| 3270 Reeves St Unit 3274 Houston, TX | 2.0 | 1.0 | 1044 | $875 | $0.84 | 26d | 1 | 0.29mi |
| 3229 Holman St Houston, TX | 4.0 | 4.0 | 1632 | $1,200 | $0.74 | 45d | 1 | 0.29mi |
| 3012 Live Oak St Unit A Houston, TX | 3.0 | 2.0 | 1188 | $1,395 | $1.17 | 22d | 1 | 0.39mi |
| 3210 Winbern St Unit B Houston, TX | 2.0 | 1.0 | 1000 | $1,095 | $1.09 | 22d | 1 | 0.41mi |
| 3309 Webster St Unit 1472545P Houston, TX | 3.0 | 2.0 | 1334 | $3,335 | $2.50 | 1d | 1 | 0.48mi |
| 2675 Gray St Houston, TX | 1.0–2.0 | 1.0–2.0 | 838 | $1,057 | $1.26 | 45d | 6 | 0.54mi |
| 3015 Isabella St Houston, TX | 3.0 | 1.0 | 1452 | $1,399 | $0.96 | 1d | 1 | 0.55mi |
| 3719 Elgin St Houston, TX | 1.0–5.0 | 1.0–5.0 | 1241 | $1,374 | $1.11 | 26d | 14 | 0.62mi |
| 3448 Coyle St Unit 3174 Houston, TX | 3.0 | 2.0 | 1151 | $1,199 | $1.04 | 0d | 1 | 0.66mi |
| 3448 Coyle St Unit 2174 Houston, TX | 2.0 | 2.0 | 1024 | $928 | $0.91 | 0d | 1 | 0.66mi |
| 3448 Coyle St Unit 510 Houston, TX | 3.0 | 2.0 | 1151 | $1,215 | $1.06 | 17d | 1 | 0.66mi |
| 3448 Coyle St Unit 2162 Houston, TX | 2.0 | 2.0 | 1024 | $944 | $0.92 | 6d | 1 | 0.66mi |
| 3448 Coyle St Unit 421 Houston, TX | 2.0 | 2.0 | 1024 | $944 | $0.92 | 9d | 1 | 0.66mi |
| 2202 Hutchins St Houston, TX | 2.0 | 2.0 | 887 | $1,500 | $1.69 | 45d | 1 | 0.74mi |
| 2102 Gray St Unit Na Houston, TX | 3.0 | 1.0 | 1267 | $2,200 | $1.74 | 23d | 1 | 0.80mi |
| 2401 Eagle St Houston, TX | 4.0 | 4.0 | 1700 | $2,800 | $1.65 | 45d | 1 | 0.81mi |
| 2311 Eagle St Houston, TX | 3.0 | 4.0 | 1783 | $2,500 | $1.40 | 45d | 1 | 0.84mi |
| 2301 Chenevert St Houston, TX | 2.0 | 2.0 | 1029 | $1,900 | $1.85 | 26d | 1 | 0.93mi |
| 3603 Chenevert St Houston, TX | 1.0–2.0 | 1.0–2.0 | 1020 | $2,129 | $2.09 | 15d | 8 | 0.93mi |
| 1907 Cullen Blvd Houston, TX | 2.0 | 2.0 | 950 | $1,509 | $1.59 | 19d | 1 | 0.95mi |
| 1907 Cullen Blvd Houston, TX | 2.0 | 2.0 | 950 | $1,509 | $1.59 | 22d | 1 | 0.95mi |
| 2216 Chenevert St Houston, TX | 1.0–2.0 | 1.5–2.5 | 1380 | $2,800 | $2.03 | 26d | 3 | 0.95mi |
| 2703 Blodgett St Unit 1047952P Houston, TX | 1.0–5.0 | 1.5–5.5 | 2497 | $12,804 | $5.13 | 0d | 2 | 0.96mi |
| 3609 Chenevert St Houston, TX | 2.0 | 2.0 | 1168 | $1,749 | $1.50 | 23d | 1 | 0.96mi |
| 3609 Chenevert St Houston, TX | 2.0 | 2.0 | 1168 | $1,749 | $1.50 | 21d | 1 | 0.96mi |
| 2319 Rosewood St Unit A Houston, TX | 3.0 | 1.0 | 1333 | $1,515 | $1.14 | 26d | 1 | 0.96mi |
| 2425 Bell St Houston, TX | 2.0 | 1.0–2.0 | 860 | $2,806 | $3.26 | 1d | 72 | 0.97mi |
| 1920 Hamilton St Houston, TX | 2.0 | 2.0 | 1117 | $2,160 | $1.93 | 45d | 1 | 1.00mi |
| 1800 Saint Joseph Pkwy Unit 2165 Houston, TX | 2.0 | 2.0 | 1117 | $1,729 | $1.55 | 0d | 1 | 1.01mi |
| 1800 Saint Joseph Pkwy Unit 2187 Houston, TX | 2.0 | 2.0 | 1117 | $1,770 | $1.58 | 0d | 1 | 1.01mi |
| 1800 Saint Joseph Pkwy Unit 2187 Houston, TX | 2.0 | 2.0 | 1117 | $1,780 | $1.59 | 6d | 1 | 1.01mi |
| 2401 Crawford St Unit A210 Houston, TX | 2.0 | 2.5 | 963 | $2,800 | $2.91 | 26d | 1 | 1.01mi |
| 1800 Saint Joseph Pkwy Houston, TX | 2.0 | 2.0 | 1029 | $1,900 | $1.85 | 45d | 1 | 1.01mi |
| 1800 Saint Joseph Pkwy Unit 1837 Houston, TX | 2.0 | 2.0 | 1117 | $1,769 | $1.58 | 12d | 1 | 1.01mi |
| 1800 St Joseph Pkwy Houston, TX | 1.0–2.0 | 1.0–2.0 | 950 | $1,900 | $2.00 | 9d | 3 | 1.01mi |
| 2615 Arbor St Unit 1047947P Houston, TX | 2.0 | 2.0 | 1194 | $2,342 | $1.96 | 0d | 1 | 1.07mi |
| 2615 Arbor St Unit 1047942P Houston, TX | 2.0 | 2.0 | 1194 | $2,742 | $2.30 | 23d | 1 | 1.07mi |
| 3237 Rosedale St #4 Houston, TX | 2.0 | 1.0 | 1000 | $1,600 | $1.60 | 12d | 1 | 1.08mi |
| 2340 Polk St Unit EEL1 Houston, TX | 2.0 | 2.0 | 1053 | $1,775 | $1.69 | 45d | 1 | 1.09mi |
| 2511 Arbor St Houston, TX | 2.0 | 1.0 | 1368 | $2,450 | $1.79 | 12d | 1 | 1.10mi |
Listing history 31 events
-
2026-06-21days on market $139,900 Active 39 DOM
-
2026-06-18days on market $139,900 Active 36 DOM
-
2026-06-17days on market $139,900 Active 35 DOM
-
2026-06-16days on market $139,900 Active 34 DOM
-
2026-06-15days on market $139,900 Active 33 DOM
-
2026-06-13days on market $139,900 Active 31 DOM
-
2026-06-10days on market $139,900 Active 27 DOM
-
2026-06-08days on market $139,900 Active 26 DOM
-
2026-06-07days on market $139,900 Active 25 DOM
-
2026-06-04days on market $139,900 Active 22 DOM
-
2026-06-01days on market $139,900 Active 19 DOM
-
2026-05-31days on market $139,900 Active 18 DOM
-
2026-05-13$139,900 Active 169-char remark
-
2026-04-22historical
-
2026-01-26$139,900 Active
-
2026-01-26historical
-
2025-12-19$139,900 Active
-
2025-12-19historical
-
2025-10-30price $139,900
-
2025-02-03status Active
-
2025-01-31historical
-
2024-12-30status Active
-
2024-12-26historical
-
2024-09-26price $155,000
-
2024-09-26status Active
-
2024-09-24historical
-
2024-09-05status Active
-
2024-08-28status Option Pending
-
2024-07-02$180,000 Active
-
1988-01-02soldstatus
-
1988-01-02soldstatus
ⓘ Source: listings_history table (triggers on properties + properties_extension) + one-shot
backfill from property_details.listing_events for pre-trigger history.
Tax reassessment forecast TX · Resets to sale price
- Current annual tax
- $4,026 · $336/mo
- Projected year-2 tax
- $4,026 · $336/mo
- Expected delta
- $0/yr ($0/mo · 0.0%)
ⓘ Screening estimate from a state-policy table — verify with the county assessor before closing.
Climate risk First Street
- Flood 5/10 Major FEMA zone X (unshaded) · 66% chance over 30 yrs
- Wildfire 1/10 Low
- Heat 9/10 Extreme 7 d/yr ≥109°F today · 24 d/yr by 30 yrs out
- Wind 9/10 Extreme 99% chance of damaging wind over 30 yrs
- Air quality 2/10 Low 2 unhealthy d/yr today · 2 by 30 yrs out
Nearby sold comps map
Loading sold comps map…
Walkable amenities ~0.75 mi
Loading nearby amenities…
Taxation est. · year 1
- Rental income
- $22,461
- − Mortgage interest
- −$7,837
- − Property taxes
- −$4,026
- − Insurance
- −$700
- − Repairs & maintenance
- −$1,797
- − Management
- −$1,797
- − Depreciation
- −$4,070
- Taxable income
- $2,235
- Est. tax owed @ 24.0%
- −$536
- After-tax cash flow
- $3,678/yr
For passive investors: Depreciation is non-cash, so a rental often shows a tax loss while cash-flowing — sheltering income. Rental losses are passive: they offset passive income freely, and up to $25,000/yr can offset ordinary (W-2) income if you actively participate and your MAGI is under $100k (phasing out to $0 by $150k); unused losses carry forward. On sale, claimed depreciation is recaptured at up to 25%, and gains may owe capital-gains tax (a 1031 exchange can defer both). Figures are a year-1 estimate at your 24.0% rate — not tax advice; consult a CPA.
Schools (NCES district)
- District
- Houston ISD
- NCES district ID
- 4823640
- Math proficiency
- 27% ▼ -18.00%
- Reading proficiency
- 35% ▼ -6.00%
- Median HH income
- $46,054
- Composite
- 26.63/100
- National rank
- #7173
- State rank
- #593 of 826 in TX
Livability — Houston
- Score
- 74/100
- State rank
- #184
- US rank
- #4771
Category grades
Schools grade is shown separately in the Schools card above.
Census & demographics
- Census place
- Houston, TX
- County
- Harris County · 4,702,590 people
- City population
- 3,226,434
- Metro
- Houston-The Woodlands-Sugar Land, TX
- Population (ZIP)
- 35,997
- Household income
- $71,199
- Rent vs Own
- Severe rent burden
- 3072.0
Population outlook (Harris County) Hauer SSP2
- Today (2025)
- 5,571,493 people
- By 2030
- 6,089,821 · +9.3%
- By 2040
- 7,142,806 · +28.2%
- By 2050
- 8,185,864 · +46.9%
- By 2075
- 10,574,329 · +89.8%
- By 2100
- 12,109,958 · +117.4%
Race, ethnicity, and origin ACS 2023
- Neighborhood character
- Diverse neighborhood (Simpson 0.68)
- Race & ethnicity
- Black 48% White 27% Hispanic / Latino 13% Two or more races 11% Asian 8%
- Hispanic origin (detail)
- Mexican 9%
- Common ancestry
- Lithuanian 1% Romanian 1% Italian 1%
- Foreign-born
- 14% · Canada, China, South Korea
- Languages at home
- 82% English-only · Spanish 10% Chinese 2% Other Indo-European 2%
Political lean MEDSL · Harris
- 2024 margin
- Lean D (+5.5) · D 52.0% · R 46.4% · Other 1.6%
- 2008→2024 swing
- +3.9pp toward D · 2008: 1.6pp · 2024: 5.5pp
- All cycles
- 2024: D+5.5 2020: D+13.3 2016: D+12.4 2012: D+0.1 2008: D+1.6
Not yet ingested
- Civics
- —
Market trends
- HPI YoY
- ▼ -139.34%
- Current HPI
- 199.6066
- Rent YoY
- ▼ -0.32%
- Metro
- Houston-The Woodlands-Sugar Land, TX
- State GDP YoY
- ▲ 3.95%
- F500 in state
- 110
Industry mix (Fortune 500 HQ in TX)
| Industry | F500 HQs | Revenue |
|---|---|---|
| Energy | 16 | $1,198B |
|
||
| Technology | 5 | $198B |
|
||
| Engineering / Construction | 4 | $72B |
|
||
| Energy Services | 3 | $60B |
|
||
| Utilities | 3 | $41B |
|
||
| Healthcare | 2 | $330B |
|
||
Price history
-22.3% since first listed19 events — show timeline
- 2026-05-13 Listed $139,900 HARMLS
- 2026-04-22 Listing Removed — HARMLS
- 2026-01-26 Listing Removed — HARMLS
- 2026-01-26 Listed $139,900 HARMLS
- 2025-12-19 Listing Removed — HARMLS
- 2025-12-19 Listed $139,900 HARMLS
- 2025-10-30 Price Changed $139,900 HARMLS
- 2025-02-03 Relisted — HARMLS
- 2025-01-31 Listing Removed — HARMLS
- 2024-12-30 Relisted — HARMLS
- 2024-12-26 Listing Removed — HARMLS
- 2024-09-26 Price Changed $155,000 HARMLS
- 2024-09-26 Relisted — HARMLS
- 2024-09-24 Listing Removed — HARMLS
- 2024-09-05 Relisted — HARMLS
- 2024-08-28 Pending — HARMLS
- 2024-07-02 Listed $180,000 HARMLS
- 1988-01-02 Sold (Public Records) — Public Records
- 1988-01-02 Sold (Public Records) — Public Records
Property tax history
+8.0%/yrLatest (2025): $4,026 · +14.4% YoY. Source: county tax records.
Cash-flow waterfall
monthlySold comps — $/sqft
last 12 mo · ≤1 miLoading sold comps…