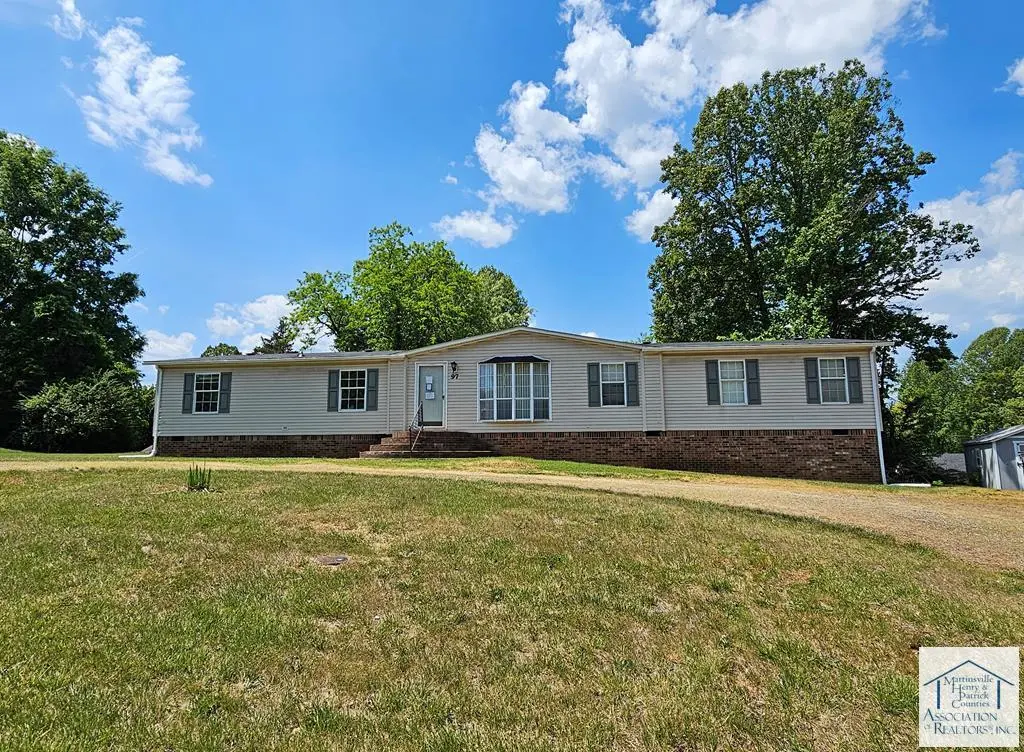
97 Southland Dr · Martinsville, VA
Flood risk 1/10 · Minimal
- FEMA flood zone
- X (unshaded)
- Chance of flooding over 30 yrs
- 0.0%
- Est. flood insurance / yr
- $507 – $1,088
Fire risk 3/10 · Minor
- Est. fire insurance / yr
- $666 – $1,236
Heat risk 6/10 · Moderate
- Hot days now (above 103°F)
- 7 days/yr
- Hot days in 30 yrs
- 18 days/yr
Wind risk 3/10 · Minor
- Chance of severe wind over 30 yrs
- 4.0%
Air-quality risk 2/10 · Minimal
- Unhealthy air days now
- 1 days/yr
- Unhealthy air days in 30 yrs
- 2 days/yr
Risk factors via First Street. Map © Google.
Why this score? — see what drove the B grade
The composite is a weighted blend of 9 inputs, each scored 0–100. Each bar is that input's sub-score; the figure is the points it added to the 100-point composite (weight × sub-score).
- Cash flow +29.2/30.0
- ARV discount +15.0/15.0
- DSCR +10.0/10.0
- 1% rule +7.0/10.0
- Schools +4.7/10.0
- Livability +3.5/5.0
- Rent growth +2.5/5.0
- Condition / age +2.5/5.0
- Appreciation +0.0/10.0
$101,078
🖨 Deal sheet 📄 Offer letter ✓ Due diligence
Listing remarks
Opportunity knocks with this spacious 1999 doublewide manufactured home offering over 2,000 sq. ft. of potential. With 4 bedrooms and 2.5 baths, the layout provides plenty of room to reimagine and create value for homeowners or investors alike. Inside, you'll find a generous kitchen with ample cabinetry, a center island, and an open flow into the family room highlights by a cozy fireplace. The home is situated on a manageable . 34-acre lot with a gravel driveway. This property does require renovation and is priced with that in mind. Needed repairs include, but not limited to, flooring, HVAC, plumbing, interior paint, & a new rear deck. Both the main bath & half bath are currently
Key facts
- 0.34 acre lot
- Built 1999
- Listed 54 days
Property features AI
Exterior
- Parking: Gravel parking
- Utilities: Public water; Public sewer
- Home design: Residential property
- Construction: Composition roof; Crawl space foundation
- Exterior features: Deck; Level lot
Interior
- Kitchen: Electric water heater
- Bathrooms: 2 full bathrooms; 1 half bathroom
- Heating & cooling: Central air; Ceiling fans; Electric heating
- Interior features: Walk-in closets; Wood-burning fireplace (1)
Neighborhood map
What this means for you Summary
Snapshot
- This is a 3-bed/2.0-bath single-family listed at $101k.
Deal economics
- At list price, monthly cash flow is $354 ($4k/yr) — positive.
- The deal already cash-flows at list — no discount required.
- Meets the 1% rule at list price ($1k rent vs $101k).
- Recommended offer: $98k (3.0% below list) — sets the bar for market timing.
- Cap rate 10.5% vs local median 5.9% in Martinsville — top-decile yield for the area; either an underpriced asset or a hidden risk that comps aren't pricing in. Stress-test before assuming the spread holds.
Location & tenants
- Location reads 70/100 on livability (#231 in VA) — a middle-class / working-renter tenant base. Strengths: cost of living A+, health & safety A+, schools B; Watch: amenities F, commute F, employment D-.
- Henry County Public School District (rural): math 45% / reading 69% proficiency, ranked #78 of 131 in VA (top 60%) — acceptable for families but not a draw, mixed tenant base, ~2y average lease; 62% free/reduced lunch — lower-income household profile, screen leases tightly.
- Market conditions: 256 active listings in the ZIP; 33 units permitted in Henry County in 2024 (0 in 5+ unit buildings).
Forward outlook
- Local home prices are declining (-3.0%/yr); year-one equity from $698 of loan paydown is wiped out by about $3k of value loss. Plan a longer hold.
- Henry County population projected at -28% by 2050 — secular population decline; favor cash flow + early exit over multi-decade hold.
- At projected returns (-3.0% appreciation + 3.0% rent growth), your $28k cash investment doubles in ~8 years — after that, you're playing with house money.
Negotiation context
- It's been on market 55 days — a 3% lower offer ($98k) is reasonable based on typical stale-listing flexibility.
- 2 sale attempts with the ask held roughly flat each time — persistent listings suggest the price (not the market) is what's stuck; bring a comps-based counter.
Risks & watch-outs
- Climate carrying-cost: extreme-heat days projected 7→18/yr by 2055 (HVAC capex compounding) — expect insurance premiums to compound above CPI over the hold.
Questions for the listing agent
- It's been on market 55 days. Have you received any prior offers? Is the seller open to a 3% concession, seller financing, or rate buy-down credit?
- Is there a deadline driving the sale (1031 exchange, divorce, estate, relocation)? That informs how much negotiation room exists.
- Schools are B-rated — typically a magnet for longer-tenancy family renters. What's the average tenant stay here, and is there a school-zone premium baked into asking?
- What's the average days-on-market for RENTAL listings here right now (not sales)? A rising rental-DOM trend means longer vacancies and softer asking-rent achievability than the comps imply.
- What's the recent tenant-quality profile in this submarket — average credit score on applications, eviction rate, late-payment / NSF rate, and stable-employment percentage? A property-management company in the area should have these aggregated.
- How much new for-sale + rental construction is in the pipeline within 1–3 miles? Heavy new supply typically softens prices + rents 12–24 months out; constrained supply supports both.
Investment metrics
- 1% rule
- 1.20% ✓
- Cap rate
- 10.49%
- Cash-on-cash
- 15.00%
- DSCR
- 1.67
- GRM
- 6.9
CMA / ARV
- ARV (median comp)
- $165,000
- List price
- $101,078
- Delta
- -38.74%
- Verdict
- UNDERPRICED
- Comps
- 9 within 1.0 mi
Show comp detail 2 sales within ~0.75 mi
| Address | Dist | Beds/Ba | Sqft | Sold | Price | $/sf | Match |
|---|---|---|---|---|---|---|---|
| 500 Fisher Farm Rd | 0.11mi | 3/2.0 | 2,112 (+3%) | 22mo | $170,000 | $80 | 72 |
| 300 Oxford Dr | 0.50mi | 3/2.5 | 1,804 (-12%) | 2mo | $235,000 | $130 | 53 |
Match score weights: distance 35% · size 25% · config 20% · recency 20%. Top-matched comps best support the ARV.
Projected returns pro-forma
-3.0% appreciation · 3.0% rent growth · sell at horizon
- IRR
- 5.6%
- Equity multiple
- 1.22×
- Total profit
- $6,111
- Equity at exit
- $15,071
- IRR
- 14.9%
- Equity multiple
- 2.21×
- Total profit
- $34,176
- Equity at exit
- $8,739
Cash invested: $28,302 (down + closing). Projections, not guarantees.
Landlord ↔ Tenant lean methodology
- Overall (STATE)
- 55 Moderately Landlord-Leaning
- State Virginia
- 55 Moderately Landlord-Leaning · D+2
- County
- — inherits STATE
- City
- — inherits STATE
ZIP-level market 24112
- Active inventory
- 256
- Price-to-rent
- 6.9×
Monthly cashflow live
- Estimated rent
- $1,216 medium interval (Pro) →
- Mortgage (P&I)
- −$530
- Tax from tax record
- −$35 /mo · $415/yr
- Insurance
- −$42
- HOA
- −$0
- Vacancy / Maint / Mgmt
- −$255
- Net cashflow
- $354
Break-even live
UW: 25.0% down · 7.5% · 30yr · 1.5% tax · 5.0% vac · 8.0% maint · 8.0% mgmt
Financing live
Cash to close
- Down payment
- $25,270
- Closing costs
- $3,032
- Reserves months
- —
- Total cash needed
- —
Loan-product check · same deal, 3 products live
Conventional
25% down · 7.5% · 30yr
- Down + closing
- —
- Monthly P&I
- —
- Monthly cashflow
- —
- DSCR
- —
- Eligible?
- —
Personal DTI + credit; lowest rate.
DSCR
20% down · 8.5% · 30yr
- Down + closing
- —
- Monthly P&I
- —
- Monthly cashflow
- —
- DSCR
- —
- Eligible?
- —
No personal income docs; deal must DSCR.
Hard money
10% down · 12.0% · 12mo
- Down + closing
- —
- Monthly P&I
- —
- Monthly cashflow
- —
- DSCR
- —
- Eligible?
- —
Short-term bridge; refi at stabilization.
Listing history 17 events
-
2026-06-19days on market $101,078 Active 55 DOM
-
2026-06-18days on market $101,078 Active 54 DOM
-
2026-06-17days on market $101,078 Active 53 DOM
-
2026-06-16days on market $101,078 Active 52 DOM
-
2026-06-15days on market $101,078 Active 51 DOM
-
2026-06-14days on market $101,078 Active 49 DOM
-
2026-06-12statusdays on market $101,078 Active 48 DOM
-
2026-06-09days on market $101,078 Active Under Contract 45 DOM
-
2026-06-08days on market $101,078 Active Under Contract 44 DOM
-
2026-06-07days on market $101,078 Active Under Contract 43 DOM
-
2026-06-03days on market $101,078 Active Under Contract 39 DOM
-
2026-06-02days on market $101,078 Active Under Contract 38 DOM
-
2026-06-01days on market $101,078 Active Under Contract 37 DOM
-
2026-05-31days on market $101,078 Active Under Contract 36 DOM
-
2026-05-30days on market $101,078 Active Under Contract 35 DOM
-
2026-05-14historical Active Under Contract 1135-char remark
-
2026-04-25$101,078 Active 1135-char remark
ⓘ Source: listings_history table (triggers on properties + properties_extension) + one-shot
backfill from property_details.listing_events for pre-trigger history.
Tax reassessment forecast VA · Resets to sale price
- Current annual tax
- $415 · $35/mo
- Projected year-2 tax
- $829 · $69/mo
- Expected delta
- +$414/yr (+$34/mo · 99.7%)
ⓘ Screening estimate from a state-policy table — verify with the county assessor before closing.
Climate risk First Street
- Flood 1/10 Low FEMA zone X (unshaded) · 0% chance over 30 yrs
- Wildfire 3/10 Moderate
- Heat 6/10 Major 7 d/yr ≥103°F today · 18 d/yr by 30 yrs out
- Wind 3/10 Moderate 4% chance of damaging wind over 30 yrs
- Air quality 2/10 Low 1 unhealthy d/yr today · 2 by 30 yrs out
Nearby sold comps map
Loading sold comps map…
Walkable amenities ~0.75 mi
Loading nearby amenities…
Taxation est. · year 1
- Rental income
- $14,590
- − Mortgage interest
- −$5,662
- − Property taxes
- −$415
- − Insurance
- −$505
- − Repairs & maintenance
- −$1,167
- − Management
- −$1,167
- − Depreciation
- −$2,940
- Taxable income
- $2,732
- Est. tax owed @ 24.0%
- −$656
- After-tax cash flow
- $3,589/yr
For passive investors: Depreciation is non-cash, so a rental often shows a tax loss while cash-flowing — sheltering income. Rental losses are passive: they offset passive income freely, and up to $25,000/yr can offset ordinary (W-2) income if you actively participate and your MAGI is under $100k (phasing out to $0 by $150k); unused losses carry forward. On sale, claimed depreciation is recaptured at up to 25%, and gains may owe capital-gains tax (a 1031 exchange can defer both). Figures are a year-1 estimate at your 24.0% rate — not tax advice; consult a CPA.
Schools (NCES district)
- District
- Henry County Public School District
- NCES district ID
- 5101920
- Math proficiency
- 45% ▼ -37.00%
- Reading proficiency
- 69% ▼ -6.00%
- Median HH income
- $34,579
- Composite
- 47.02/100
- National rank
- #2345
- State rank
- #78 of 131 in VA
Livability — Martinsville
- Score
- 70/100
- State rank
- #231
- US rank
- #7826
Category grades
Schools grade is shown separately in the Schools card above.
Census & demographics
- County
- Martinsville City · 31,028 people
- City population
- 31,028
- Metro
- Martinsville, VA
- Population (ZIP)
- 31,028
- Household income
- $48,770
- Rent vs Own
- Severe rent burden
- 888.0
Population outlook (Henry County) Hauer SSP2
- Today (2025)
- 46,903 people
- By 2030
- 44,141 · -5.9%
- By 2040
- 38,687 · -17.5%
- By 2050
- 33,742 · -28.1%
- By 2075
- 25,720 · -45.2%
- By 2100
- 19,868 · -57.6%
Race, ethnicity, and origin ACS 2023
- Neighborhood character
- Diverse neighborhood (Simpson 0.60)
- Race & ethnicity
- White 50% Black 38% Hispanic / Latino 7% Two or more races 5% Asian 1%
- Hispanic origin (detail)
- Mexican 3% Puerto Rican 1%
- Common ancestry
- Slovak 1% Italian 1% Lithuanian 1%
- Foreign-born
- 5% · Canada
- Languages at home
- 92% English-only · Spanish 6% Other Indo-European 1%
Political lean MEDSL · Henry
- 2024 margin
- Solid R (+32.8) · D 33.3% · R 66.1%
- 2008→2024 swing
- -22.4pp toward R · 2008: -10.5pp · 2024: -32.8pp
- All cycles
- 2024: R+32.8 2020: R+29.1 2016: R+29.2 2012: R+14.7 2008: R+10.5
Not yet ingested
- Civics
- —
Market trends
- HPI YoY
- ▼ -95.37%
- Current HPI
- 172.4393
- Rent YoY
- —
- Metro
- Martinsville, VA
- State GDP YoY
- ▲ 2.40%
- F500 in state
- 50
Industry mix (Fortune 500 HQ in VA)
| Industry | F500 HQs | Revenue |
|---|---|---|
| Aerospace / Defense | 4 | $236B |
|
||
| Technology / Defense | 3 | $32B |
|
||
| Financial Services | 2 | $176B |
|
||
| Utilities | 2 | $27B |
|
||
| Insurance | 2 | $25B |
|
||
| Technology | 2 | $15B |
|
||
Price history
3 events — show timeline
- 2026-06-11 Relisted — MHPCAR
- 2026-05-14 Contingent — MHPCAR
- 2026-04-25 Listed $101,078 MHPCAR
Property tax history
+0.7%/yrLatest (2025): $415 · +0.0% YoY. Source: county tax records.
Cash-flow waterfall
monthlySold comps — $/sqft
last 12 mo · ≤1 miLoading sold comps…