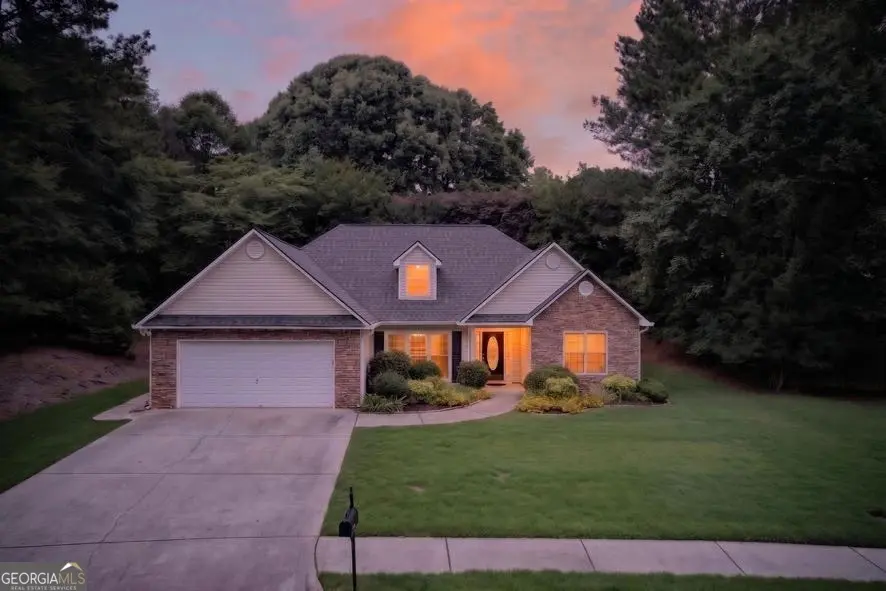
24 Prestwick Dr · Fayetteville, GA
Flood risk 1/10 · Minimal
- FEMA flood zone
- X (unshaded)
- Chance of flooding over 30 yrs
- 0.0%
- Est. flood insurance / yr
- $507 – $1,088
Fire risk 3/10 · Minor
- Est. fire insurance / yr
- $963 – $1,789
Heat risk 6/10 · Moderate
- Hot days now (above 105°F)
- 7 days/yr
- Hot days in 30 yrs
- 19 days/yr
Wind risk 6/10 · Moderate
- Chance of severe wind over 30 yrs
- 27.0%
Air-quality risk 4/10 · Minor
- Unhealthy air days now
- 3 days/yr
- Unhealthy air days in 30 yrs
- 5 days/yr
Risk factors via First Street. Map © Google.
Why this score? — see what drove the F grade
The composite is a weighted blend of 9 inputs, each scored 0–100. Each bar is that input's sub-score; the figure is the points it added to the 100-point composite (weight × sub-score).
- Cash flow +13.7/30.0
- DSCR +4.1/10.0
- Livability +3.6/5.0
- Rent growth +3.3/5.0
- 1% rule +3.1/10.0
- ARV discount +2.9/15.0
- Condition / age +2.5/5.0
- Schools +1.3/10.0
- Appreciation +0.0/10.0
$315,000
🖨 Deal sheet 📄 Offer letter ✓ Due diligence
Listing remarks
Welcome home to this adorable stepless ranch nestled in a peaceful setting with green space both beside and across the street, offering added privacy and beautiful views. The private backyard is a true retreat, complete with mature landscaping, colorful flowers, and a lovely patio perfect for relaxing or entertaining. Inside, you'll love the functional split-bedroom floor plan designed for both comfort and privacy. The spacious living room features soaring vaulted ceilings, a cozy gas log fireplace, and direct access to the backyard patio. The open-concept living and dining areas create an inviting space for gatherings and everyday living. The beautifully updated kitchen has been recently r
Key facts
- Stepless ranch
- Private backyard
- Gas log fireplace
Tags
Property features AI
Finance
- Other: Listing accepts multiple financing types including cash, conventional, FHA, VA, and 1031 exchange
- HOA & community: Homeowners association with annual fee (includes grounds maintenance)
Exterior
- Parking: Attached garage with garage door opener (kitchen level access)
- Security: Security system; Smoke detectors
- Utilities: Public water; Public sewer; Electricity available; Natural gas available; High-speed internet available; Cable available
- Home design: Single-family house; One level
- Construction: Built in 1998; Vinyl siding with stone accents; Composition roof; Slab foundation
- Exterior features: Patio; Corner lot; Gazebo; Resale condition; Community amenities include clubhouse, lake, playground, pool, street lights, tennis courts, and nearby shopping
Interior
- Kitchen: Breakfast area; Dishwasher; Microwave; Refrigerator
- Bedrooms: Three bedrooms on the main level
- Flooring: Vinyl flooring
- Bathrooms: Two full bathrooms (main level); Double vanity
- Heating & cooling: Natural gas heating; Central electric air conditioning; Ceiling fans
- Interior features: Double vanity in bathrooms; High ceilings with tray and vaulted ceiling details; Split bedroom floor plan; Tile baths; Walk-in closets; Gas log fireplace with gas starter in the living room
- Laundry & utility: Mud room / laundry area; Gas water heater
Neighborhood map
What this means for you Summary
Snapshot
- This is a 3-bed/2.0-bath single-family listed at $315k.
Deal economics
- At list price, monthly cash flow is $24 ($290/yr) — positive.
- The deal already cash-flows at list — no discount required.
- To meet the 1% rule (rent ≥ 1% of price), the offer needs to be $256k (18.8% below list).
- Recommended offer: $256k (18.8% below list) — sets the bar for 1% rule.
- Cap rate 6.4% vs local median 4.4% in Fayetteville — top-decile yield for the area; either an underpriced asset or a hidden risk that comps aren't pricing in. Stress-test before assuming the spread holds.
Location & tenants
- Location reads 71/100 on livability (#86 in GA) — a middle-class / working-renter tenant base. Strengths: housing A+, health & safety B+, employment B; Watch: amenities F, commute F.
- Clayton County (suburban): math 11% / reading 20% proficiency, ranked #155 of 174 in GA (top 89%) — low school quality limits family demand, transient renter base, plan for 1-2y turnover; 78% free/reduced lunch — lower-income household profile, screen leases tightly.
- Zoned schools: Lovejoy High School (math 7% / reading 8%, grade F, #378 of 424 statewide, top 91%, 2,136 students, 90% FRL).
- Market conditions: Rents rising (+3.2%/yr); 306 active listings in the ZIP; 9 comparable units currently listed for rent nearby; rentals leasing fast (median 5d on market — plan ~1-2 weeks tenant-placement turnaround); high-income renter base; 865 units permitted in Clayton County in 2024 (448 in 5+ unit buildings).
Forward outlook
- Local home prices are declining (-3.0%/yr); year-one equity from $2k of loan paydown is wiped out by about $9k of value loss. Plan a longer hold.
- Clayton County population projected at +29% by 2050 — long-run rental-demand tailwind backs the buy-and-hold thesis.
Negotiation context
- Only 7 days on market — expect competitive offers; lowballing is unlikely to land.
Risks & watch-outs
- Climate carrying-cost: major wind risk, 27% chance of damaging wind over 30y; extreme-heat days projected 7→19/yr by 2055 (HVAC capex compounding) — expect insurance premiums to compound above CPI over the hold.
Questions for the listing agent
- What does the HOA fee cover, when was the last increase, and are there any pending special assessments or reserve-fund shortfalls?
- Is there a deadline driving the sale (1031 exchange, divorce, estate, relocation)? That informs how much negotiation room exists.
- Schools are B-rated — typically a magnet for longer-tenancy family renters. What's the average tenant stay here, and is there a school-zone premium baked into asking?
- The area grade is low — what's the realistic commute time and amenity access for the typical tenant pool here? Any planned neighborhood developments (good or bad) we should know about?
- What's the average days-on-market for RENTAL listings here right now (not sales)? A rising rental-DOM trend means longer vacancies and softer asking-rent achievability than the comps imply.
- What's the recent tenant-quality profile in this submarket — average credit score on applications, eviction rate, late-payment / NSF rate, and stable-employment percentage? A property-management company in the area should have these aggregated.
- How much new for-sale + rental construction is in the pipeline within 1–3 miles? Heavy new supply typically softens prices + rents 12–24 months out; constrained supply supports both.
Investment metrics
- 1% rule
- 0.81% ✗
- Cap rate
- 6.39%
- Cash-on-cash
- 0.33%
- DSCR
- 1.01
- GRM
- 10.3
CMA / ARV
- ARV (on-the-fly)
- $285,852
- Comps found
- 12
Show comp detail 12 sales within ~0.75 mi
| Address | Dist | Beds/Ba | Sqft | Sold | Price | $/sf | Match |
|---|---|---|---|---|---|---|---|
| 316 Players Cir | 0.09mi | 3/2.0 | 1,587 (-8%) | 8mo | $236,000 | $149 | 76 |
| 11970 Fairway Overlook | 0.26mi | 3/2.0 | 1,748 (+2%) | 11mo | $299,900 | $172 | 76 |
| 11765 Fairway Overlook | 0.25mi | 3/2.0 | 1,616 (-6%) | 8mo | $269,000 | $166 | 72 |
| 11853 Fairway Overlook | 0.30mi | 3/2.0 | 1,595 (-7%) | 9mo | $269,900 | $169 | 66 |
| 509 Fielding Ct | 0.54mi | 3/2.0 | 1,807 (+5%) | 4mo | $310,000 | $172 | 63 |
| 12238 Cypress Way | 0.51mi | 3/2.5 | 1,768 (+3%) | 8mo | $295,000 | $167 | 63 |
| 12237 Cypress Ln | 0.58mi | 3/2.5 | 1,662 (-4%) | 4mo | $275,000 | $165 | 62 |
| 11853 Harbour Town Pkwy | 0.31mi | 4/2.5 (+1) | 1,835 (+7%) | 12mo | $269,000 | $147 | 58 |
| 11937 Spring Lake Way | 0.52mi | 4/2.5 (+1) | 1,786 (+4%) | 8mo | $290,000 | $162 | 56 |
| 12241 Cypress Way | 0.54mi | 3/2.5 | 1,608 (-7%) | 8mo | $270,000 | $168 | 55 |
| 11827 Spring Lake Way | 0.56mi | 4/2.5 (+1) | 1,786 (+4%) | 12mo | $289,900 | $162 | 51 |
| 120 Fontaine Way | 0.73mi | 4/2.5 (+1) | 1,928 (+12%) | 1mo | $310,000 | $161 | 38 |
Match score weights: distance 35% · size 25% · config 20% · recency 20%. Top-matched comps best support the ARV.
Projected returns pro-forma
-3.0% appreciation · 3.22% rent growth · sell at horizon
- IRR
- -15.6%
- Equity multiple
- 0.44×
- Total profit
- $-49,007
- Equity at exit
- $46,968
- IRR
- -6.8%
- Equity multiple
- 0.56×
- Total profit
- $-38,641
- Equity at exit
- $27,235
Cash invested: $88,200 (down + closing). Projections, not guarantees.
Landlord ↔ Tenant lean methodology
- Overall (STATE)
- 90 Strongly Landlord-Friendly
- State Georgia
- 90 Strongly Landlord-Friendly · R+3
- County
- — inherits STATE
- City
- — inherits STATE
ZIP-level market 30215
- Rents YoY
- 3.2%
- Active inventory
- 306
- Price-to-rent
- 10.3×
Monthly cashflow live
- Estimated rent
- $2,559 high interval (Pro) →
- Mortgage (P&I)
- −$1,652
- Tax from tax record
- −$164 /mo · $1,974/yr
- Insurance
- −$131
- HOA
- −$50
- Vacancy / Maint / Mgmt
- −$537
- Net cashflow
- $24
Break-even live
UW: 25.0% down · 7.5% · 30yr · 1.5% tax · 5.0% vac · 8.0% maint · 8.0% mgmt
Financing live
Cash to close
- Down payment
- $78,750
- Closing costs
- $9,450
- Reserves months
- —
- Total cash needed
- —
Loan-product check · same deal, 3 products live
Conventional
25% down · 7.5% · 30yr
- Down + closing
- —
- Monthly P&I
- —
- Monthly cashflow
- —
- DSCR
- —
- Eligible?
- —
Personal DTI + credit; lowest rate.
DSCR
20% down · 8.5% · 30yr
- Down + closing
- —
- Monthly P&I
- —
- Monthly cashflow
- —
- DSCR
- —
- Eligible?
- —
No personal income docs; deal must DSCR.
Hard money
10% down · 12.0% · 12mo
- Down + closing
- —
- Monthly P&I
- —
- Monthly cashflow
- —
- DSCR
- —
- Eligible?
- —
Short-term bridge; refi at stabilization.
Rent comps 9 comps
| Address | Beds | Baths | Sqft | Rent | $/sqft | DOM | Units | Dist |
|---|---|---|---|---|---|---|---|---|
| 11945 Harbour Town Pkwy Fayetteville, GA | 4.0 | 3.5 | 1844 | $2,220 | $1.20 | 1d | 1 | 0.15mi |
| 11993 Red Ivy Ln Fayetteville, GA | 4.0 | 2.5 | 2116 | $2,700 | $1.28 | 43d | 1 | 0.17mi |
| 12012 Red Ivy Ln Fayetteville, GA | 3.0 | 2.0 | 1745 | $2,000 | $1.15 | 43d | 1 | 0.18mi |
| 11964 Red Ivy Ln Fayetteville, GA | 4.0 | 2.0 | 2128 | $2,295 | $1.08 | 11d | 1 | 0.21mi |
| 11949 Fairway Overlook Fayetteville, GA | 4.0 | 3.0 | 2166 | $2,450 | $1.13 | 24d | 1 | 0.23mi |
| 12245 Cypress Ln Fayetteville, GA | 3.0 | 2.5 | 1582 | $2,130 | $1.35 | 5d | 1 | 0.60mi |
| 12264 Crestwood Ct Fayetteville, GA | 4.0 | 2.5 | 2222 | $2,249 | $1.01 | 1d | 1 | 0.64mi |
| 162 Olympic Dr Fayetteville, GA | 4.0 | 2.5 | 2220 | $2,391 | $1.08 | 1d | 1 | 0.86mi |
| 137 Odith Rd Fayetteville, GA | 3.0 | 2.0 | 1875 | $2,300 | $1.23 | 1d | 1 | 1.43mi |
HOA detail
- Monthly dues
- $50 · $600/yr
- Likely covers
- gaslandscaping
Listing history 7 events
-
2026-06-10status $315,000 Under Contract 7 DOM
-
2026-06-09days on market $315,000 Active 7 DOM
-
2026-06-08days on market $315,000 Active 6 DOM
-
2026-06-07pricestatusdays on market $315,000 Active 5 DOM
-
2026-06-04days on market $309,900 New 2 DOM
-
2026-06-02remarks 699-char remark
-
2026-06-02$309,900 New 1 DOM
ⓘ Source: listings_history table (triggers on properties + properties_extension) + one-shot
backfill from property_details.listing_events for pre-trigger history.
Tax reassessment forecast GA · Resets to sale price
- Current annual tax
- $1,974 · $164/mo
- Projected year-2 tax
- $2,898 · $242/mo
- Expected delta
- +$924/yr (+$77/mo · 46.8%)
ⓘ Screening estimate from a state-policy table — verify with the county assessor before closing.
Climate risk First Street
- Flood 1/10 Low FEMA zone X (unshaded) · 0% chance over 30 yrs
- Wildfire 3/10 Moderate
- Heat 6/10 Major 7 d/yr ≥105°F today · 19 d/yr by 30 yrs out
- Wind 6/10 Major 27% chance of damaging wind over 30 yrs
- Air quality 4/10 Moderate 3 unhealthy d/yr today · 5 by 30 yrs out
Nearby sold comps map
Loading sold comps map…
Walkable amenities ~0.75 mi
Loading nearby amenities…
Taxation est. · year 1
- Rental income
- $30,711
- − Mortgage interest
- −$17,645
- − Property taxes
- −$1,974
- − Insurance
- −$1,575
- − Repairs & maintenance
- −$2,457
- − Management
- −$2,457
- − HOA
- −$600
- − Depreciation
- −$9,164
- Taxable loss
- −$5,160
- Est. tax savings @ 24.0%
- +$1,238
- After-tax cash flow
- $1,529/yr
For passive investors: Depreciation is non-cash, so a rental often shows a tax loss while cash-flowing — sheltering income. Rental losses are passive: they offset passive income freely, and up to $25,000/yr can offset ordinary (W-2) income if you actively participate and your MAGI is under $100k (phasing out to $0 by $150k); unused losses carry forward. On sale, claimed depreciation is recaptured at up to 25%, and gains may owe capital-gains tax (a 1031 exchange can defer both). Figures are a year-1 estimate at your 24.0% rate — not tax advice; consult a CPA.
Schools (NCES district)
- District
- Clayton County
- NCES district ID
- 1301230
- Math proficiency
- 11% ▼ -13.00%
- Reading proficiency
- 20% ▼ -9.00%
- Median HH income
- $42,266
- Composite
- 13.41/100
- National rank
- #9527
- State rank
- #155 of 174 in GA
Livability — Fayetteville
- Score
- 71/100
- State rank
- #86
- US rank
- #7167
Category grades
Schools grade is shown separately in the Schools card above.
Census & demographics
- County
- Fayette County · 112,821 people
- City population
- 72,287
- Metro
- Atlanta-Sandy Springs-Alpharetta, GA
- Population (ZIP)
- 40,476
- Household income
- $118,436
- Rent vs Own
- Severe rent burden
- 415.0
Population outlook (Clayton County) Hauer SSP2
- Today (2025)
- 310,777 people
- By 2030
- 329,762 · +6.1%
- By 2040
- 368,052 · +18.4%
- By 2050
- 401,196 · +29.1%
- By 2075
- 472,488 · +52.0%
- By 2100
- 500,446 · +61.0%
Race, ethnicity, and origin ACS 2023
- Neighborhood character
- Diverse neighborhood (Simpson 0.60)
- Race & ethnicity
- White 57% Black 26% Two or more races 7% Hispanic / Latino 6% Asian 3%
- Hispanic origin (detail)
- Mexican 2% Puerto Rican 1%
- Common ancestry
- Slovak 3% Italian 2% Lithuanian 2%
- Foreign-born
- 7% · Canada, China, Vietnam
- Languages at home
- 90% English-only · Spanish 5% Other Indo-European 1% German/W. Germanic 1%
Political lean MEDSL · Clayton
- 2024 margin
- Solid D (+69.2) · D 84.3% · R 15.1%
- 2008→2024 swing
- +2.8pp toward D · 2008: 66.4pp · 2024: 69.2pp
- All cycles
- 2024: D+69.2 2020: D+70.9 2016: D+71.9 2012: D+70.1 2008: D+66.4
Not yet ingested
- Civics
- —
Market trends
- HPI YoY
- ▼ -146.38%
- Current HPI
- 238.3395
- Rent YoY
- ▲ 3.22%
- Metro
- Atlanta-Sandy Springs-Alpharetta, GA
- State GDP YoY
- ▲ 2.66%
- F500 in state
- 28
Industry mix (Fortune 500 HQ in GA)
| Industry | F500 HQs | Revenue |
|---|---|---|
| Paper / Packaging | 2 | $29B |
|
||
| Retail | 1 | $160B |
|
||
| Transportation / Logistics | 1 | $91B |
|
||
| Airlines | 1 | $62B |
|
||
| Consumer Goods | 1 | $47B |
|
||
| Utilities | 1 | $25B |
|
||
Price history
1 event — show timeline
- 2026-06-02 Listed $309,900 GAMLS
Property tax history
+2.6%/yrLatest (2025): $1,974 · -51.3% YoY. Source: county tax records.
Cash-flow waterfall
monthlySold comps — $/sqft
last 12 mo · ≤1 miLoading sold comps…