1304 E Avenue I #8 · Lancaster, CA
Flood risk 1/10 · Minimal
- FEMA flood zone
- X (unshaded)
- Chance of flooding over 30 yrs
- 0.0%
- Est. flood insurance / yr
- $507 – $1,088
Fire risk 5/10 · Moderate
- Est. fire insurance / yr
- $659 – $1,223
Heat risk 7/10 · Major
- Hot days now (above 101°F)
- 7 days/yr
- Hot days in 30 yrs
- 18 days/yr
Wind risk 1/10 · Minimal
- Chance of severe wind over 30 yrs
- —
Air-quality risk 8/10 · Major
- Unhealthy air days now
- 16 days/yr
- Unhealthy air days in 30 yrs
- 21 days/yr
Risk factors via First Street. Map © Google.
Why this score? — see what drove the B- grade
The composite is a weighted blend of 9 inputs, each scored 0–100. Each bar is that input's sub-score; the figure is the points it added to the 100-point composite (weight × sub-score).
- Cash flow +30.0/30.0
- 1% rule +10.0/10.0
- DSCR +10.0/10.0
- ARV discount +7.5/15.0
- Livability +3.4/5.0
- Rent growth +2.5/5.0
- Schools +2.5/10.0
- Condition / age +2.5/5.0
- Appreciation +0.0/10.0
$65,000
🖨 Deal sheet (PDF) 📄 Offer letter ✓ Due diligence
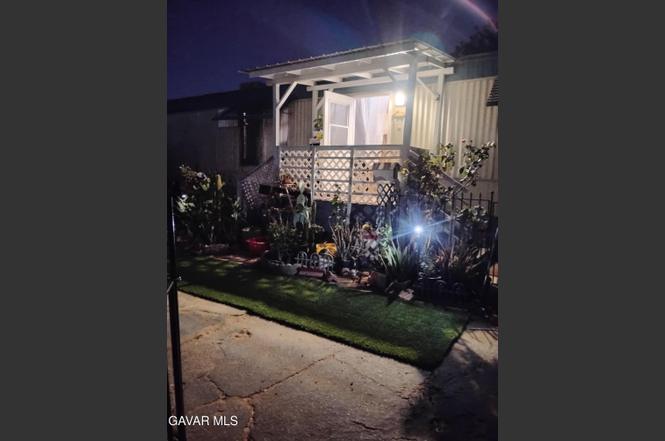
Listing remarks
This Mobil Home perfect for first time home buyers downsizing or investment two bedroom two bath mobile homes is priced to sell.
Key facts
- 3.5 acre lot
- Built 1974
- Listed 121 days
Property features AI
Finance
- Other: Mobile home label/insignia: CA1014641; Dec number: AAB3164; Serial number: 0403; Manufacturer/trade name: Fleetwood; Model name: --------
- HOA & community: Monthly space rent: $860; Park deposit: see park for details; Deposit: $2,000; Manager: Kare (phone: (661)886-5256); Park name: Clears Sky
Exterior
- Parking: Garage
- Utilities: Individual meters; Cable TV available; Natural gas; 220V outlet in laundry
- Home design: Manufactured home (Fleetwood, 1976); 60 ft. by 12 ft.; Space number 8; All ages park
- Construction: Metal and wood exterior; Metal and tile roof; Skirting: other (see remarks)
- Exterior features: Chain link and wood fencing; front yard fenced; Shed; Garage; RV park on-site (park features)
Interior
- Kitchen: Gas range
- Bathrooms: 2 full bathrooms
- Heating & cooling: Central air; Evaporative cooling; Natural gas
- Interior features: Gas range
Neighborhood map
What this means for you Summary
Snapshot
- This is a 2-bed/2.0-bath manufactured listed at $65k.
Deal economics
- At list price, monthly cash flow is $1k ($15k/yr) — positive.
- The deal already cash-flows at list — no discount required.
- Meets the 1% rule at list price ($2k rent vs $65k).
- Recommended offer: $57k (12.0% below list) — sets the bar for market timing.
- Cap rate 29.4% vs local median 4.3% in Lancaster — top-decile yield for the area; either an underpriced asset or a hidden risk that comps aren't pricing in. Stress-test before assuming the spread holds.
Location & tenants
- Location reads 68/100 on livability (#282 in CA) — a middle-class / working-renter tenant base. Strengths: commute A+, housing A+, amenities B+; Watch: health & safety C-, crime F, cost of living F.
- Lancaster Elementary (suburban): math 18% / reading 32% proficiency, ranked #1,161 of 1,400 in CA (top 83%) — low school quality limits family demand, transient renter base, plan for 1-2y turnover; 72% free/reduced lunch — lower-income household profile, screen leases tightly.
- Zoned schools: Discovery (693 students, 94% FRL); Piute Middle (731 students, 96% FRL); Eastside High (2,650 students, 61% FRL).
- Market conditions: Rents flat; 1178 active listings in the ZIP; 14 comparable units currently listed for rent nearby; rentals leasing fast (median 4d on market — plan ~1-2 weeks tenant-placement turnaround); 19,697 units permitted in Los Angeles County in 2024 (9,426 in 5+ unit buildings).
- This rent runs 37% of the median local income ($70k/yr) — at the standard rent-burdened threshold; future hikes will face affordability resistance.
Forward outlook
- Local home prices are declining (-3.0%/yr); year-one equity from $449 of loan paydown is wiped out by about $2k of value loss. Plan a longer hold.
- Los Angeles County population projected at +9% by 2050 — modest demand growth; plan on rents tracking national, not racing it.
- At projected returns (-3.0% appreciation + 0.1% rent growth), your $18k cash investment doubles in ~2 years — after that, you're playing with house money.
Negotiation context
- It's been on market 121 days — a 12% lower offer ($57k) is reasonable based on typical stale-listing flexibility.
Risks & watch-outs
- Climate carrying-cost: moderate wildfire risk; extreme-heat days projected 7→18/yr by 2055 (HVAC capex compounding) — expect insurance premiums to compound above CPI over the hold.
Questions for the listing agent
- It's been on market 121 days. Have you received any prior offers? Is the seller open to a 12% concession, seller financing, or rate buy-down credit?
- Built in 1974 — when were the roof, HVAC, electrical panel, plumbing, and water heater last replaced?
- Why hasn't it sold? Are there any deal-killer items the seller is aware of (foundation, flood, title, zoning, code violations)?
- Is there a deadline driving the sale (1031 exchange, divorce, estate, relocation)? That informs how much negotiation room exists.
- Schools are F-rated, which usually means shorter tenancies and higher turnover. Who's the typical renter profile here, and what's been the actual vacancy rate?
- Crime grade is F in this area — have there been break-ins, vandalism, or insurance claims at this property in the last 3 years? What carrier currently insures it and at what premium?
- What's the average days-on-market for RENTAL listings here right now (not sales)? A rising rental-DOM trend means longer vacancies and softer asking-rent achievability than the comps imply.
- What's the recent tenant-quality profile in this submarket — average credit score on applications, eviction rate, late-payment / NSF rate, and stable-employment percentage? A property-management company in the area should have these aggregated.
- How much new for-sale + rental construction is in the pipeline within 1–3 miles? Heavy new supply typically softens prices + rents 12–24 months out; constrained supply supports both.
Investment metrics
- 1% rule
- 3.31% ✓
- Cap rate
- 29.41%
- Cash-on-cash
- 82.57%
- DSCR
- 4.67
- GRM
- 2.5
CMA / ARV
- ARV (on-the-fly)
- $134,260
- Comps found
- 3
Show comp detail 3 sales within ~0.75 mi
| Address | Dist | Beds/Ba | Sqft | Sold | Price | $/sf | Match |
|---|---|---|---|---|---|---|---|
| 1304 E I Ave #32 | 0.01mi | 1/1.0 (-1) | 900 (-8%) | 8mo | $55,000 | $61 | 70 |
| 1301 E Avenue I #240 | 0.49mi | 2/2.0 | 1,056 (+8%) | 9mo | $145,000 | $137 | 56 |
| 1501 East Ave I #174 | 0.37mi | 3/2.0 (+1) | 1,104 (+13%) | 12mo | $195,000 | $177 | 46 |
Match score weights: distance 35% · size 25% · config 20% · recency 20%. Top-matched comps best support the ARV.
Projected returns pro-forma
-3.0% appreciation · 0.14% rent growth · sell at horizon
- IRR
- 79.6%
- Equity multiple
- 4.47×
- Total profit
- $63,238
- Equity at exit
- $9,692
- IRR
- 82.4%
- Equity multiple
- 8.39×
- Total profit
- $134,556
- Equity at exit
- $5,620
Cash invested: $18,200 (down + closing). Projections, not guarantees.
Landlord ↔ Tenant lean methodology
- Overall (STATE)
- 18 Strongly Tenant-Friendly
- State California
- 18 Strongly Tenant-Friendly · D+13
- County
- — inherits STATE
- City
- — inherits STATE
ZIP-level market 93535
- Home prices YoY
- -24.3%
- Rents YoY
- 0.1%
- Active inventory
- 1178
- Price-to-rent
- 2.5×
Monthly cashflow live
- Estimated rent
- $2,154 high interval (Pro) →
- Mortgage (P&I)
- −$341
- Tax est. 1.5%
- −$81 /mo · $975/yr
- Insurance
- −$27
- HOA
- −$0
- Vacancy / Maint / Mgmt
- −$452
- Net cashflow
- $1,252
Break-even live
Sensitivity live
| Price | -10% $1,297 | -5% $1,275 | +0% $1,252 | +5% $1,230 | +10% $1,207 |
|---|---|---|---|---|---|
| Rent | -10% $1,082 | -5% $1,167 | +0% $1,252 | +5% $1,337 | +10% $1,423 |
| Rate | -1.0pp $1,285 | -0.5pp $1,269 | base $1,252 | +0.5pp $1,236 | +1.0pp $1,218 |
UW: 25.0% down · 7.5% · 30yr · 1.5% tax · 5.0% vac · 8.0% maint · 8.0% mgmt
Financing live
Cash to close
- Down payment
- $16,250
- Closing costs
- $1,950
- Reserves months
- —
- Total cash needed
- —
Loan-product check · same deal, 3 products live
Conventional
25% down · 7.5% · 30yr
- Down + closing
- —
- Monthly P&I
- —
- Monthly cashflow
- —
- DSCR
- —
- Eligible?
- —
Personal DTI + credit; lowest rate.
DSCR
20% down · 8.5% · 30yr
- Down + closing
- —
- Monthly P&I
- —
- Monthly cashflow
- —
- DSCR
- —
- Eligible?
- —
No personal income docs; deal must DSCR.
Hard money
10% down · 12.0% · 12mo
- Down + closing
- —
- Monthly P&I
- —
- Monthly cashflow
- —
- DSCR
- —
- Eligible?
- —
Short-term bridge; refi at stabilization.
Rent comps 14 comps
| Address | Beds | Baths | Sqft | Rent | $/sqft | DOM | Units | Dist |
|---|---|---|---|---|---|---|---|---|
| 45118 Parkview Ln Lancaster, CA | 2.0 | 2.0 | 980 | $2,500 | $2.55 | 26d | 1 | 0.52mi |
| 44532 15th St E #7 Lancaster, CA | 2.0 | 2.0 | 1062 | $2,050 | $1.93 | 0d | 1 | 0.57mi |
| 44532 15th St E #7 Lancaster, CA | 2.0 | 2.0 | 1062 | $2,150 | $2.02 | 26d | 1 | 0.57mi |
| 1628 Cactus Dr Apt B Lancaster, CA | 2.0 | 1.5 | 1000 | $1,999 | $2.00 | 0d | 1 | 0.64mi |
| 1647 Orchid Ln Lancaster, CA | 2.0 | 2.0 | 1000 | $1,875 | $1.88 | 4d | 1 | 0.69mi |
| 1647 Orchid Ln Lancaster, CA | 3.0 | 3.0 | 1084 | $1,950 | $1.80 | 24d | 1 | 0.69mi |
| 44436 15th St E Lancaster, CA | 2.0 | 2.0 | 1056 | $2,024 | $1.92 | 0d | 1 | 0.76mi |
| 550 E Avenue H14 Lancaster, CA | 2.0 | 1.0 | 850 | $2,050 | $2.41 | 0d | 1 | 0.90mi |
| 1827 East Avenue J Unit 2 Lancaster, CA | 2.0 | 2.0 | 1050 | $1,850 | $1.76 | 18d | 1 | 0.91mi |
| 1743 , CA | 1.0–4.0 | 1.0–2.0 | 934 | $1,803 | $1.93 | 0d | 17 | 1.08mi |
| 44236 20th St E Lancaster, CA | 2.0 | 1.0–2.5 | 900 | $1,712 | $1.90 | 0d | 1 | 1.17mi |
| 43942 18th St E Unit 3 Lancaster, CA | 2.0 | 2.0 | 1000 | $2,300 | $2.30 | 0d | 1 | 1.42mi |
| 43942 18th St E Unit 3 Lancaster, CA | 2.0 | 2.0 | 1000 | $2,300 | $2.30 | 12d | 1 | 1.42mi |
| 44221 4th St E Lancaster, CA | 1.0–3.0 | 1.0–2.0 | 885 | $1,988 | $2.25 | 3d | 2 | 1.48mi |
Listing history 16 events
-
2026-06-21days on market $65,000 Active 121 DOM
-
2026-06-18days on market $65,000 Active 118 DOM
-
2026-06-17days on market $65,000 Active 117 DOM
-
2026-06-16days on market $65,000 Active 116 DOM
-
2026-06-15days on market $65,000 Active 115 DOM
-
2026-06-13days on market $65,000 Active 113 DOM
-
2026-06-13days on market $65,000 Active 112 DOM
-
2026-06-09days on market $65,000 Active 109 DOM
-
2026-06-08days on market $65,000 Active 108 DOM
-
2026-06-07days on market $65,000 Active 107 DOM
-
2026-06-04days on market $65,000 Active 104 DOM
-
2026-06-03days on market $65,000 Active 103 DOM
-
2026-06-02days on market $65,000 Active 102 DOM
-
2026-06-01days on market $65,000 Active 101 DOM
-
2026-05-31days on market $65,000 Active 100 DOM
-
2026-02-20$65,000 Active
ⓘ Source: listings_history table (triggers on properties + properties_extension) + one-shot
backfill from property_details.listing_events for pre-trigger history.
Climate risk First Street
- Flood 1/10 Low FEMA zone X (unshaded) · 0% chance over 30 yrs
- Wildfire 5/10 Major
- Heat 7/10 Severe 7 d/yr ≥101°F today · 18 d/yr by 30 yrs out
- Wind 1/10 Low
- Air quality 8/10 Severe 16 unhealthy d/yr today · 21 by 30 yrs out
Nearby sold comps map
Loading sold comps map…
Walkable amenities ~0.75 mi
Loading nearby amenities…
Taxation est. · year 1
- Rental income
- $25,847
- − Mortgage interest
- −$3,641
- − Property taxes
- −$975
- − Insurance
- −$325
- − Repairs & maintenance
- −$2,068
- − Management
- −$2,068
- − Depreciation
- −$1,891
- Taxable income
- $14,879
- Est. tax owed @ 24.0%
- −$3,571
- After-tax cash flow
- $11,457/yr
For passive investors: Depreciation is non-cash, so a rental often shows a tax loss while cash-flowing — sheltering income. Rental losses are passive: they offset passive income freely, and up to $25,000/yr can offset ordinary (W-2) income if you actively participate and your MAGI is under $100k (phasing out to $0 by $150k); unused losses carry forward. On sale, claimed depreciation is recaptured at up to 25%, and gains may owe capital-gains tax (a 1031 exchange can defer both). Figures are a year-1 estimate at your 24.0% rate — not tax advice; consult a CPA.
Schools (NCES district)
- District
- Lancaster Elementary
- NCES district ID
- 0620880
- Math proficiency
- 18% ▲ 1.00%
- Reading proficiency
- 32% ▬ 0.00%
- Median HH income
- $46,440
- Composite
- 24.73/100
- National rank
- #13028
- State rank
- #1161 of 1400 in CA
Livability — Lancaster
- Score
- 68/100
- State rank
- #282
- US rank
- #9504
Category grades
Schools grade is shown separately in the Schools card above.
Census & demographics
- Census place
- Lancaster, CA
- County
- Los Angeles County · 9,444,647 people
- City population
- 194,251
- Metro
- Los Angeles-Long Beach-Anaheim, CA
- Population (ZIP)
- 79,409
- Household income
- $70,360
- Rent vs Own
- Severe rent burden
- 2494.0
Population outlook (Los Angeles County) Hauer SSP2
- Today (2025)
- 10,940,515 people
- By 2030
- 11,256,481 · +2.9%
- By 2040
- 11,729,929 · +7.2%
- By 2050
- 11,948,407 · +9.2%
- By 2075
- 11,818,114 · +8.0%
- By 2100
- 10,842,928 · -0.9%
Race, ethnicity, and origin ACS 2023
- Neighborhood character
- Diverse neighborhood (Simpson 0.63)
- Race & ethnicity
- Hispanic / Latino 55% Two or more races 25% Black 21% White 17% Asian 2% Native American 1%
- Hispanic origin (detail)
- Mexican 42%
- Common ancestry
- Romanian 1% Italian 1% Lithuanian 1%
- Foreign-born
- 13% · Canada
- Languages at home
- 60% English-only · Spanish 37% Tagalog/Filipino 1% Other Indo-European 1%
Political lean MEDSL · Los Angeles
- 2024 margin
- Solid D (+32.9) · D 64.8% · R 31.9% · Other 3.3%
- 2008→2024 swing
- -7.4pp toward R · 2008: 40.4pp · 2024: 32.9pp
- All cycles
- 2024: D+32.9 2020: D+44.2 2016: D+48.0 2012: D+40.0 2008: D+40.4
Not yet ingested
- Civics
- —
Market trends
- HPI YoY
- ▼ -144.13%
- Current HPI
- 449.4494
- Rent YoY
- ▲ 0.14%
- Metro
- Los Angeles-Long Beach-Anaheim, CA
- State GDP YoY
- ▲ 3.21%
- F500 in state
- 116
Industry mix (Fortune 500 HQ in CA)
| Industry | F500 HQs | Revenue |
|---|---|---|
| Technology | 27 | $1,492B |
|
||
| Financial Services | 3 | $174B |
|
||
| Retail | 3 | $44B |
|
||
| Insurance | 3 | $26B |
|
||
| Media / Entertainment | 2 | $115B |
|
||
| Pharmaceuticals / Biotech | 2 | $62B |
|
||
Price history
1 event — show timeline
- 2026-02-20 Listed $65,000 AVMLS
Cash-flow waterfall
monthlySold comps — $/sqft
last 12 mo · ≤1 miLoading sold comps…