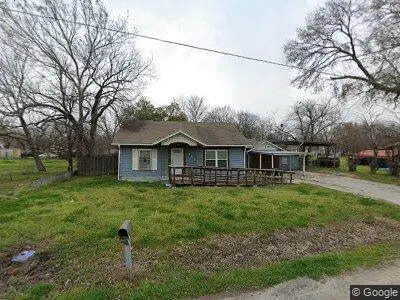
1418 W 11th Ave · Corsicana, TX
Flood risk 1/10 · Minimal
- FEMA flood zone
- X (unshaded)
- Chance of flooding over 30 yrs
- 0.0%
- Est. flood insurance / yr
- $507 – $1,088
Fire risk 5/10 · Moderate
- Est. fire insurance / yr
- $1,222 – $2,270
Heat risk 7/10 · Major
- Hot days now (above 109°F)
- 7 days/yr
- Hot days in 30 yrs
- 25 days/yr
Wind risk 6/10 · Moderate
- Chance of severe wind over 30 yrs
- 57.0%
Air-quality risk 2/10 · Minimal
- Unhealthy air days now
- 0 days/yr
- Unhealthy air days in 30 yrs
- 1 days/yr
Risk factors via First Street. Map © Google.
Why this score? — see what drove the B- grade
The composite is a weighted blend of 9 inputs, each scored 0–100. Each bar is that input's sub-score; the figure is the points it added to the 100-point composite (weight × sub-score).
- Cash flow +25.7/30.0
- ARV discount +15.0/15.0
- DSCR +8.6/10.0
- 1% rule +6.7/10.0
- Livability +3.6/5.0
- Schools +3.2/10.0
- Condition / age +2.5/5.0
- Rent growth +2.1/5.0
- Appreciation +0.0/10.0
$150,000
🖨 Deal sheet (PDF) 📄 Offer letter ✓ Due diligence
Listing remarks
4/2 with a big fenced back yard, central heat and air, back porch, wheel chair ramp, 1 car carport with a 1 car garage (online). Needs new exterior paint.
Key facts
- Fenced back yard
- Garage
- Carport
Tags
Neighborhood map
What this means for you Summary
Snapshot
- This is a 4-bed/1.0-bath single-family listed at $150k.
Deal economics
- At list price, monthly cash flow is $361 ($4k/yr) — positive.
- The deal already cash-flows at list — no discount required.
- Meets the 1% rule at list price ($2k rent vs $150k).
- Recommended offer: $148k (1.5% below list) — sets the bar for market timing.
- Cap rate 9.2% vs local median 4.4% in Corsicana — top-decile yield for the area; either an underpriced asset or a hidden risk that comps aren't pricing in. Stress-test before assuming the spread holds.
Location & tenants
- Location reads 71/100 on livability (#283 in TX) — a middle-class / working-renter tenant base. Strengths: cost of living A+, housing A+, health & safety A+; Watch: amenities D, crime F, commute F.
- Corsicana ISD (town): math 39% / reading 37% proficiency, ranked #471 of 826 in TX (top 57%) — families likely to look elsewhere, expect single-tenant / working-renter base with shorter leases; 65% free/reduced lunch — lower-income household profile, screen leases tightly.
- Zoned schools: Carroll El (math 32% / reading 27%, grade F, #2,525 of 4,322 statewide, top 62%, 502 students, 96% FRL); Corsicana Middle (math 35% / reading 43%, grade F, #690 of 1,662 statewide, top 42%, 928 students, 76% FRL); Corsicana H S (math 42% / reading 47%, grade F, #652 of 1,632 statewide, top 43%, 1,805 students, 73% FRL) — zoned schools average 81% FRL vs 65% district-wide (16 pts higher); higher-poverty schools than district average — tighter screening recommended.
- Market conditions: Rents soft (-1.5%/yr); 273 active listings in the ZIP; 6 comparable units currently listed for rent nearby; rentals lingering (median 46d on market — plan ~5-8 weeks vacancy on turnover, expect pricing pressure); 50% of comp listings sitting > 30 days — soft ceiling on asking rent; 522 units permitted in Navarro County in 2024 (0 in 5+ unit buildings).
- This rent runs 37% of the median local income ($57k/yr) — at the standard rent-burdened threshold; future hikes will face affordability resistance.
Forward outlook
- Local home prices are declining (-3.0%/yr); year-one equity from $1k of loan paydown is wiped out by about $4k of value loss. Plan a longer hold.
- Navarro County population projected to shrink 4% by 2050 — rents likely to lag national; underwrite the cash flow, not the appreciation.
Negotiation context
- It's been on market 27 days — a 2% lower offer ($148k) is reasonable based on typical stale-listing flexibility.
Risks & watch-outs
- Climate carrying-cost: major wind risk, 57% chance of damaging wind over 30y; moderate wildfire risk; extreme-heat days projected 7→25/yr by 2055 (HVAC capex compounding) — expect insurance premiums to compound above CPI over the hold.
Questions for the listing agent
- Is there a deadline driving the sale (1031 exchange, divorce, estate, relocation)? That informs how much negotiation room exists.
- Schools are F-rated, which usually means shorter tenancies and higher turnover. Who's the typical renter profile here, and what's been the actual vacancy rate?
- Crime grade is F in this area — have there been break-ins, vandalism, or insurance claims at this property in the last 3 years? What carrier currently insures it and at what premium?
- What's the average days-on-market for RENTAL listings here right now (not sales)? A rising rental-DOM trend means longer vacancies and softer asking-rent achievability than the comps imply.
- What's the recent tenant-quality profile in this submarket — average credit score on applications, eviction rate, late-payment / NSF rate, and stable-employment percentage? A property-management company in the area should have these aggregated.
- How much new for-sale + rental construction is in the pipeline within 1–3 miles? Heavy new supply typically softens prices + rents 12–24 months out; constrained supply supports both.
Investment metrics
- 1% rule
- 1.17% ✓
- Cap rate
- 9.18%
- Cash-on-cash
- 10.30%
- DSCR
- 1.46
- GRM
- 7.1
CMA / ARV
- ARV (on-the-fly)
- $211,200
- Comps found
- 5
Show comp detail 5 sales within ~0.75 mi
| Address | Dist | Beds/Ba | Sqft | Sold | Price | $/sf | Match |
|---|---|---|---|---|---|---|---|
| 811 S 18th St | 0.35mi | 3/2.0 (-1) | 1,148 (-4%) | 1mo | $190,000 | $166 | 67 |
| 400 S 26th St | 0.20mi | 3/2.0 (-1) | 1,134 (-6%) | 19mo | $199,999 | $176 | 56 |
| 2410 W Collin St | 0.74mi | 4/2.0 | 1,280 (+7%) | 9mo | $206,990 | $162 | 43 |
| 2201 W 12th Ave | 0.56mi | 3/2.0 (-1) | 1,078 (-10%) | 13mo | $190,000 | $176 | 38 |
| 813 W 10th Ave | 0.35mi | 3/2.0 (-1) | 1,348 (+12%) | 24mo | $245,000 | $182 | 34 |
Match score weights: distance 35% · size 25% · config 20% · recency 20%. Top-matched comps best support the ARV.
Projected returns pro-forma
-3.0% appreciation · 0.0% rent growth · sell at horizon
- IRR
- -4.3%
- Equity multiple
- 0.85×
- Total profit
- $-6,468
- Equity at exit
- $22,365
- IRR
- 1.6%
- Equity multiple
- 1.10×
- Total profit
- $4,117
- Equity at exit
- $12,969
Cash invested: $42,000 (down + closing). Projections, not guarantees.
Landlord ↔ Tenant lean methodology
- Overall (STATE)
- 87 Strongly Landlord-Friendly
- State Texas
- 87 Strongly Landlord-Friendly · R+5
- County
- — inherits STATE
- City
- — inherits STATE
ZIP-level market 75110
- Rents YoY
- -1.5%
- Active inventory
- 273
- Price-to-rent
- 7.1×
Monthly cashflow live
- Estimated rent
- $1,758 high interval (Pro) →
- Mortgage (P&I)
- −$787
- Tax from tax record
- −$179 /mo · $2,153/yr
- Insurance
- −$62
- HOA
- −$0
- Lot rent
- −$0
- Vacancy / Maint / Mgmt
- −$369
- Net cashflow
- $361
Break-even live
Sensitivity live
| Price | -10% $446 | -5% $403 | +0% $361 | +5% $318 | +10% $276 |
|---|---|---|---|---|---|
| Rent | -10% $222 | -5% $291 | +0% $361 | +5% $430 | +10% $500 |
| Rate | -1.0pp $436 | -0.5pp $399 | base $361 | +0.5pp $322 | +1.0pp $282 |
UW: 25.0% down · 7.5% · 30yr · 1.5% tax · 5.0% vac · 8.0% maint · 8.0% mgmt
Financing live
Cash to close
- Down payment
- $37,500
- Closing costs
- $4,500
- Reserves months
- —
- Total cash needed
- —
Loan-product check · same deal, 3 products live
Conventional
25% down · 7.5% · 30yr
- Down + closing
- —
- Monthly P&I
- —
- Monthly cashflow
- —
- DSCR
- —
- Eligible?
- —
Personal DTI + credit; lowest rate.
DSCR
20% down · 8.5% · 30yr
- Down + closing
- —
- Monthly P&I
- —
- Monthly cashflow
- —
- DSCR
- —
- Eligible?
- —
No personal income docs; deal must DSCR.
Hard money
10% down · 12.0% · 12mo
- Down + closing
- —
- Monthly P&I
- —
- Monthly cashflow
- —
- DSCR
- —
- Eligible?
- —
Short-term bridge; refi at stabilization.
Rent comps 6 comps
| Address | Beds | Baths | Sqft | Rent | $/sqft | DOM | Units | Dist |
|---|---|---|---|---|---|---|---|---|
| 1509 W Collin St Corsicana, TX | 3.0 | 2.0 | 1290 | $1,850 | $1.43 | 46d | 1 | 0.32mi |
| 1505 Woodlawn Ave Corsicana, TX | 3.0 | 2.0 | 1220 | $1,900 | $1.56 | 46d | 1 | 0.86mi |
| 208 N 36th St Corsicana, TX | 3.0 | 1.0 | 1200 | $1,400 | $1.17 | 46d | 1 | 0.90mi |
| 1306 Liveoak Ave Corsicana, TX | 3.0 | 1.0 | 1080 | $1,300 | $1.20 | 7d | 1 | 0.92mi |
| 2928 College Cir Corsicana, TX | 3.0 | 2.0 | 1360 | $1,650 | $1.21 | 12d | 1 | 1.07mi |
| 544 N 37th St Corsicana, TX | 3.0 | 1.0 | 1080 | $1,590 | $1.47 | 26d | 1 | 1.18mi |
Listing history 21 events
-
2026-06-22days on market $150,000 Active 27 DOM
-
2026-06-21days on market $150,000 Active 26 DOM
-
2026-06-19days on market $150,000 Active 24 DOM
-
2026-06-18days on market $150,000 Active 23 DOM
-
2026-06-17days on market $150,000 Active 22 DOM
-
2026-06-16days on market $150,000 Active 21 DOM
-
2026-06-15days on market $150,000 Active 20 DOM
-
2026-06-14days on market $150,000 Active 18 DOM
-
2026-06-12days on market $150,000 Active 17 DOM
-
2026-06-09days on market $150,000 Active 14 DOM
-
2026-06-08days on market $150,000 Active 13 DOM
-
2026-06-07days on market $150,000 Active 12 DOM
-
2026-06-02days on market $150,000 Active 7 DOM
-
2026-06-01days on market $150,000 Active 6 DOM
-
2026-05-31days on market $150,000 Active 5 DOM
-
2026-05-30days on market $150,000 Active 4 DOM
-
2026-05-26$150,000 Active
-
2024-12-23soldstatus
-
2020-03-19soldstatus
-
2012-10-18soldstatus
-
1985-10-28soldstatus
ⓘ Source: listings_history table (triggers on properties + properties_extension) + one-shot
backfill from property_details.listing_events for pre-trigger history.
Tax reassessment forecast TX · Resets to sale price
- Current annual tax
- $2,153 · $179/mo
- Projected year-2 tax
- $2,745 · $229/mo
- Expected delta
- +$592/yr (+$49/mo · 27.5%)
ⓘ Screening estimate from a state-policy table — verify with the county assessor before closing.
Climate risk First Street
- Flood 1/10 Low FEMA zone X (unshaded) · 0% chance over 30 yrs
- Wildfire 5/10 Major
- Heat 7/10 Severe 7 d/yr ≥109°F today · 25 d/yr by 30 yrs out
- Wind 6/10 Major 57% chance of damaging wind over 30 yrs
- Air quality 2/10 Low 0 unhealthy d/yr today · 1 by 30 yrs out
Nearby sold comps map
Loading sold comps map…
Walkable amenities ~0.75 mi
Loading nearby amenities…
Taxation est. · year 1
- Rental income
- $21,102
- − Mortgage interest
- −$8,402
- − Property taxes
- −$2,153
- − Insurance
- −$750
- − Repairs & maintenance
- −$1,688
- − Management
- −$1,688
- − Depreciation
- −$4,364
- Taxable income
- $2,056
- Est. tax owed @ 24.0%
- −$494
- After-tax cash flow
- $3,834/yr
For passive investors: Depreciation is non-cash, so a rental often shows a tax loss while cash-flowing — sheltering income. Rental losses are passive: they offset passive income freely, and up to $25,000/yr can offset ordinary (W-2) income if you actively participate and your MAGI is under $100k (phasing out to $0 by $150k); unused losses carry forward. On sale, claimed depreciation is recaptured at up to 25%, and gains may owe capital-gains tax (a 1031 exchange can defer both). Figures are a year-1 estimate at your 24.0% rate — not tax advice; consult a CPA.
Schools (NCES district)
- District
- Corsicana ISD
- NCES district ID
- 4815330
- Math proficiency
- 39% ▼ -9.00%
- Reading proficiency
- 37% ▬ 0.00%
- Median HH income
- $39,948
- Composite
- 31.89/100
- National rank
- #5862
- State rank
- #471 of 826 in TX
Livability — Corsicana
- Score
- 71/100
- State rank
- #283
- US rank
- #6570
Category grades
Schools grade is shown separately in the Schools card above.
Census & demographics
- Census place
- Corsicana, TX
- County
- Navarro County · 31,552 people
- City population
- 31,552
- Metro
- Corsicana, TX
- Population (ZIP)
- 31,552
- Household income
- $57,370
- Rent vs Own
- Severe rent burden
- 663.0
Population outlook (Navarro County) Hauer SSP2
- Today (2025)
- 48,397 people
- By 2030
- 48,096 · -0.6%
- By 2040
- 47,394 · -2.1%
- By 2050
- 46,541 · -3.8%
- By 2075
- 44,940 · -7.1%
- By 2100
- 42,288 · -12.6%
Race, ethnicity, and origin ACS 2023
- Neighborhood character
- Diverse neighborhood (Simpson 0.68)
- Race & ethnicity
- White 41% Hispanic / Latino 37% Two or more races 16% Black 13% Pacific Islander 2% Asian 1%
- Hispanic origin (detail)
- Mexican 34%
- Common ancestry
- Lithuanian 2% Slovak 1% Romanian 1%
- Foreign-born
- 17% · Canada
- Languages at home
- 68% English-only · Spanish 29% Other Asian/Pacific 2%
Political lean MEDSL · Navarro
- 2024 margin
- Solid R (+51.8) · D 23.7% · R 75.6%
- 2008→2024 swing
- -18.7pp toward R · 2008: -33.1pp · 2024: -51.8pp
- All cycles
- 2024: R+51.8 2020: R+45.5 2016: R+48.8 2012: R+42.4 2008: R+33.1
Not yet ingested
- Civics
- —
Market trends
- HPI YoY
- ▼ -248.01%
- Current HPI
- 224.5566
- Rent YoY
- ▼ -1.47%
- Metro
- Corsicana, TX
- State GDP YoY
- ▲ 3.95%
- F500 in state
- 110
Industry mix (Fortune 500 HQ in TX)
| Industry | F500 HQs | Revenue |
|---|---|---|
| Energy | 16 | $1,198B |
|
||
| Technology | 5 | $198B |
|
||
| Engineering / Construction | 4 | $72B |
|
||
| Energy Services | 3 | $60B |
|
||
| Utilities | 3 | $41B |
|
||
| Healthcare | 2 | $330B |
|
||
Price history
5 events — show timeline
- 2026-05-26 Listed $150,000 FSBO.com
- 2024-12-23 Sold (Public Records) — Public Records
- 2020-03-19 Sold (Public Records) — Public Records
- 2012-10-18 Sold (Public Records) — Public Records
- 1985-10-28 Sold (Public Records) — Public Records
Property tax history
+9.7%/yrLatest (2025): $2,153 · -1.5% YoY. Source: county tax records.
Cash-flow waterfall
monthlySold comps — $/sqft
last 12 mo · ≤1 miLoading sold comps…