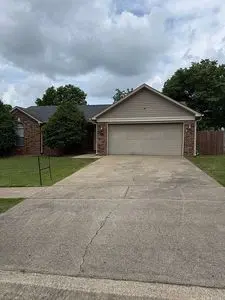
3403 Forest Dr · Bryant, AR
Flood risk 1/10 · Minimal
- FEMA flood zone
- X (unshaded)
- Chance of flooding over 30 yrs
- 0.0%
- Est. flood insurance / yr
- $507 – $1,088
Fire risk 4/10 · Minor
- Est. fire insurance / yr
- $1,499 – $2,785
Heat risk 7/10 · Major
- Hot days now (above 110°F)
- 7 days/yr
- Hot days in 30 yrs
- 20 days/yr
Wind risk 4/10 · Minor
- Chance of severe wind over 30 yrs
- 10.0%
Air-quality risk 2/10 · Minimal
- Unhealthy air days now
- 0 days/yr
- Unhealthy air days in 30 yrs
- 1 days/yr
Risk factors via First Street. Map © Google.
Why this score? — see what drove the D grade
The composite is a weighted blend of 9 inputs, each scored 0–100. Each bar is that input's sub-score; the figure is the points it added to the 100-point composite (weight × sub-score).
- Cash flow +12.7/30.0
- ARV discount +9.8/15.0
- Schools +4.2/10.0
- DSCR +3.8/10.0
- Livability +3.7/5.0
- 1% rule +2.6/10.0
- Rent growth +2.5/5.0
- Condition / age +2.5/5.0
- Appreciation +0.0/10.0
$210,000
🖨 Deal sheet 📄 Offer letter ✓ Due diligence
Listing remarks MLS
Move in ready home on a corner lot. Come see the open floor plan, neutral paint colors, and fully fenced backyard. RV parking helps with those large or small recreational vehicles that you don't want in the garage. Close to restaurants, shopping, and the interstate. Come see this home before it slips away.
Key facts
- Concrete pad
- Garage has ac vents
- Rv hook up
Tags
Neighborhood map
What this means for you Summary
Snapshot
- This is a 3-bed/2.0-bath single-family listed at $210k.
Deal economics
- At list price, monthly cash flow is $-21 ($-255/yr) — negative.
- To cash-flow at today's rent, offer at most $206k (1.8% below list).
- To meet the 1% rule (rent ≥ 1% of price), the offer needs to be $160k (23.7% below list).
- Recommended offer: $160k (23.7% below list) — sets the bar for 1% rule.
- Cap rate 6.2% vs local median 3.9% in Bryant — top-decile yield for the area; either an underpriced asset or a hidden risk that comps aren't pricing in. Stress-test before assuming the spread holds.
Location & tenants
- Location reads 74/100 on livability (#16 in AR, #4,487 nationally) — a middle-class / working-renter tenant base. Strengths: cost of living A+, housing A+, health & safety A+; Watch: amenities F, commute F.
- Bryant School District (suburban): math 49% / reading 48% proficiency, ranked #16 of 238 in AR (top 7%) — families likely to look elsewhere, expect single-tenant / working-renter base with shorter leases.
- Market conditions: 97 active listings in the ZIP; 4 comparable units currently listed for rent nearby; rentals at typical pace (median 14d on market — plan ~3-4 weeks tenant-placement turnaround); 446 units permitted in Saline County in 2024 (0 in 5+ unit buildings).
Forward outlook
- Local home prices are declining (-3.0%/yr); year-one equity from $1k of loan paydown is wiped out by about $6k of value loss. Plan a longer hold.
- Saline County population projected at +39% by 2050 — long-run rental-demand tailwind backs the buy-and-hold thesis.
Negotiation context
- It's been on market 20 days — a 2% lower offer ($207k) is reasonable based on typical stale-listing flexibility.
- 3 sale attempts since 13y ago with the ask held roughly flat each time — persistent listings suggest the price (not the market) is what's stuck; bring a comps-based counter.
Risks & watch-outs
- Climate carrying-cost: extreme-heat days projected 7→20/yr by 2055 (HVAC capex compounding) — expect insurance premiums to compound above CPI over the hold.
Questions for the listing agent
- What do current leases actually rent for vs. the listed asking? Can we see a recent rent roll and the last 12 months of T-12 income?
- Is there a deadline driving the sale (1031 exchange, divorce, estate, relocation)? That informs how much negotiation room exists.
- Schools are B-rated — typically a magnet for longer-tenancy family renters. What's the average tenant stay here, and is there a school-zone premium baked into asking?
- The area grade is low — what's the realistic commute time and amenity access for the typical tenant pool here? Any planned neighborhood developments (good or bad) we should know about?
- What's the average days-on-market for RENTAL listings here right now (not sales)? A rising rental-DOM trend means longer vacancies and softer asking-rent achievability than the comps imply.
- What's the recent tenant-quality profile in this submarket — average credit score on applications, eviction rate, late-payment / NSF rate, and stable-employment percentage? A property-management company in the area should have these aggregated.
- How much new for-sale + rental construction is in the pipeline within 1–3 miles? Heavy new supply typically softens prices + rents 12–24 months out; constrained supply supports both.
Investment metrics
- 1% rule
- 0.76% ✗
- Cap rate
- 6.17%
- Cash-on-cash
- -0.43%
- DSCR
- 0.98
- GRM
- 10.9
CMA / ARV
- ARV (on-the-fly)
- $221,265
- Comps found
- 12
Show comp detail 12 sales within ~0.75 mi
| Address | Dist | Beds/Ba | Sqft | Sold | Price | $/sf | Match |
|---|---|---|---|---|---|---|---|
| 3419 Forest Dr | 0.04mi | 3/2.0 | 1,576 (+6%) | 5mo | $229,000 | $145 | 84 |
| 1101 Sunset Gdns E | 0.31mi | 3/2.0 | 1,470 (-1%) | 7mo | $244,500 | $166 | 78 |
| 2918 Forest Dr | 0.31mi | 3/2.0 | 1,532 (+3%) | 4mo | $231,900 | $151 | 77 |
| 3501 Andrew Dr | 0.11mi | 3/2.0 | 1,625 (+9%) | 4mo | $242,000 | $149 | 76 |
| 2902 Andrew Dr | 0.32mi | 3/2.0 | 1,391 (-6%) | 2mo | $205,000 | $147 | 73 |
| 2102 Justus Loop | 0.23mi | 3/2.0 | 1,352 (-9%) | 4mo | $195,000 | $144 | 71 |
| 3000 Andrew Dr | 0.28mi | 3/2.0 | 1,378 (-7%) | 6mo | $220,000 | $160 | 70 |
| 4215 Stillman Loop | 0.40mi | 3/2.0 | 1,415 (-5%) | 5mo | $147,000 | $104 | 69 |
| 2010 Turtle Cv | 0.69mi | 3/2.0 | 1,474 (-1%) | 2mo | $216,000 | $147 | 65 |
| 4019 Stillman Loop | 0.32mi | 3/2.0 | 1,344 (-10%) | 6mo | $220,000 | $164 | 64 |
| 4014 Stillman Loop | 0.30mi | 3/1.5 | 1,310 (-12%) | 1mo | $199,000 | $152 | 63 |
| 3401 Vickie Dr | 0.44mi | 3/2.0 | 1,649 (+11%) | 6mo | $200,000 | $121 | 56 |
Match score weights: distance 35% · size 25% · config 20% · recency 20%. Top-matched comps best support the ARV.
Projected returns pro-forma
-3.0% appreciation · 3.0% rent growth · sell at horizon
- IRR
- -17.1%
- Equity multiple
- 0.40×
- Total profit
- $-35,462
- Equity at exit
- $31,312
- IRR
- -9.1%
- Equity multiple
- 0.44×
- Total profit
- $-32,939
- Equity at exit
- $18,157
Cash invested: $58,800 (down + closing). Projections, not guarantees.
Landlord ↔ Tenant lean methodology
- Overall (STATE)
- 92 Strongly Landlord-Friendly
- State Arkansas
- 92 Strongly Landlord-Friendly · R+14
- County
- — inherits STATE
- City
- — inherits STATE
ZIP-level market 72022
- Home prices YoY
- -16.5%
- Active inventory
- 97
- Price-to-rent
- 10.9×
Monthly cashflow live
- Estimated rent
- $1,601 medium interval (Pro) →
- Mortgage (P&I)
- −$1,101
- Tax from tax record
- −$98 /mo · $1,172/yr
- Insurance
- −$88
- HOA
- −$0
- Vacancy / Maint / Mgmt
- −$336
- Net cashflow
- $-21
Break-even live
UW: 25.0% down · 7.5% · 30yr · 1.5% tax · 5.0% vac · 8.0% maint · 8.0% mgmt
Financing live
Cash to close
- Down payment
- $52,500
- Closing costs
- $6,300
- Reserves months
- —
- Total cash needed
- —
Loan-product check · same deal, 3 products live
Conventional
25% down · 7.5% · 30yr
- Down + closing
- —
- Monthly P&I
- —
- Monthly cashflow
- —
- DSCR
- —
- Eligible?
- —
Personal DTI + credit; lowest rate.
DSCR
20% down · 8.5% · 30yr
- Down + closing
- —
- Monthly P&I
- —
- Monthly cashflow
- —
- DSCR
- —
- Eligible?
- —
No personal income docs; deal must DSCR.
Hard money
10% down · 12.0% · 12mo
- Down + closing
- —
- Monthly P&I
- —
- Monthly cashflow
- —
- DSCR
- —
- Eligible?
- —
Short-term bridge; refi at stabilization.
Rent comps 4 comps
| Address | Beds | Baths | Sqft | Rent | $/sqft | DOM | Units | Dist |
|---|---|---|---|---|---|---|---|---|
| 1612 Waldron Cv Bryant, AR | 3.0 | 2.5 | 1824 | $1,786 | $0.98 | 23d | 1 | 0.29mi |
| 1916 Brandon Cv Bryant, AR | 2.0–3.0 | 2.0 | 1160 | $1,385 | $1.19 | 14d | 1 | 0.93mi |
| 1810 Melba Cir Unit 2 Bryant, AR | 3.0 | 2.0 | 1200 | $1,395 | $1.16 | 14d | 1 | 1.19mi |
| 3500 Double Eagle Way Bryant, AR | 1.0–2.0 | 1.0–2.0 | 818 | $1,065 | $1.30 | 14d | 1 | 1.48mi |
Listing history 25 events
-
2026-06-18days on market $210,000 Active 20 DOM
-
2026-06-17days on market $210,000 Active 19 DOM
-
2026-06-16days on market $210,000 Active 18 DOM
-
2026-06-15days on market $210,000 Active 17 DOM
-
2026-06-14days on market $210,000 Active 15 DOM
-
2026-06-13days on market $210,000 Active 14 DOM
-
2026-06-10days on market $210,000 Active 12 DOM
-
2026-06-09days on market $210,000 Active 11 DOM
-
2026-06-08days on market $210,000 Active 10 DOM
-
2026-06-07days on market $210,000 Active 9 DOM
-
2026-06-05days on market $210,000 Active 6 DOM
-
2026-06-03days on market $210,000 Active 5 DOM
-
2026-06-02days on market $210,000 Active 4 DOM
-
2026-06-01days on market $210,000 Active 3 DOM
-
2026-05-31days on market $210,000 Active 2 DOM
-
2026-05-29$210,000 Active
-
2021-10-05soldstatus $192,000
-
2021-09-28soldstatus $192,000 Sold 307-char remark
Show marketing remark (307 chars)
Move in ready home on a corner lot. Come see the open floor plan, neutral paint colors, and fully fenced backyard. RV parking helps with those large or small recreational vehicles that you don't want in the garage. Close to restaurants, shopping, and the interstate. Come see this home before it slips away.
-
2021-09-03status Under Contract 307-char remark
Show marketing remark (307 chars)
Move in ready home on a corner lot. Come see the open floor plan, neutral paint colors, and fully fenced backyard. RV parking helps with those large or small recreational vehicles that you don't want in the garage. Close to restaurants, shopping, and the interstate. Come see this home before it slips away.
-
2021-09-01price $180,000 307-char remark
Show marketing remark (307 chars)
Move in ready home on a corner lot. Come see the open floor plan, neutral paint colors, and fully fenced backyard. RV parking helps with those large or small recreational vehicles that you don't want in the garage. Close to restaurants, shopping, and the interstate. Come see this home before it slips away.
-
2021-08-30$178,000 New Listing 307-char remark
Show marketing remark (307 chars)
Move in ready home on a corner lot. Come see the open floor plan, neutral paint colors, and fully fenced backyard. RV parking helps with those large or small recreational vehicles that you don't want in the garage. Close to restaurants, shopping, and the interstate. Come see this home before it slips away.
-
2014-01-08soldstatus $127,500 370-char remark
Show marketing remark (370 chars)
Nice home on corner lot. This 3 BR, 2 bath home has great curb appeal. Living room with vaulted ceiling has gas log fireplace. Eat-in kitchen with pantry. 285 sq. ft. is enclosed garage. Nice size bedrooms. Texas-style master bath. Roof 2 years old. Heat/AC 1 year old. Great fully fenced backyard wtih double gate off side street to RV pad. Make your appointment today.
-
2013-12-05historical 370-char remark
Show marketing remark (370 chars)
Nice home on corner lot. This 3 BR, 2 bath home has great curb appeal. Living room with vaulted ceiling has gas log fireplace. Eat-in kitchen with pantry. 285 sq. ft. is enclosed garage. Nice size bedrooms. Texas-style master bath. Roof 2 years old. Heat/AC 1 year old. Great fully fenced backyard wtih double gate off side street to RV pad. Make your appointment today.
-
2013-10-11$134,500 370-char remark
Show marketing remark (370 chars)
Nice home on corner lot. This 3 BR, 2 bath home has great curb appeal. Living room with vaulted ceiling has gas log fireplace. Eat-in kitchen with pantry. 285 sq. ft. is enclosed garage. Nice size bedrooms. Texas-style master bath. Roof 2 years old. Heat/AC 1 year old. Great fully fenced backyard wtih double gate off side street to RV pad. Make your appointment today.
-
2004-10-14soldstatus $134,000
ⓘ Source: listings_history table (triggers on properties + properties_extension) + one-shot
backfill from property_details.listing_events for pre-trigger history.
Tax reassessment forecast AR · Resets to sale price
- Current annual tax
- $1,172 · $98/mo
- Projected year-2 tax
- $1,344 · $112/mo
- Expected delta
- +$172/yr (+$14/mo · 14.7%)
ⓘ Screening estimate from a state-policy table — verify with the county assessor before closing.
Climate risk First Street
- Flood 1/10 Low FEMA zone X (unshaded) · 0% chance over 30 yrs
- Wildfire 4/10 Moderate
- Heat 7/10 Severe 7 d/yr ≥110°F today · 20 d/yr by 30 yrs out
- Wind 4/10 Moderate 10% chance of damaging wind over 30 yrs
- Air quality 2/10 Low 0 unhealthy d/yr today · 1 by 30 yrs out
Nearby sold comps map
Loading sold comps map…
Walkable amenities ~0.75 mi
Loading nearby amenities…
Taxation est. · year 1
- Rental income
- $19,218
- − Mortgage interest
- −$11,763
- − Property taxes
- −$1,172
- − Insurance
- −$1,050
- − Repairs & maintenance
- −$1,537
- − Management
- −$1,537
- − Depreciation
- −$6,109
- Taxable loss
- −$3,952
- Est. tax savings @ 24.0%
- +$948
- After-tax cash flow
- $693/yr
For passive investors: Depreciation is non-cash, so a rental often shows a tax loss while cash-flowing — sheltering income. Rental losses are passive: they offset passive income freely, and up to $25,000/yr can offset ordinary (W-2) income if you actively participate and your MAGI is under $100k (phasing out to $0 by $150k); unused losses carry forward. On sale, claimed depreciation is recaptured at up to 25%, and gains may owe capital-gains tax (a 1031 exchange can defer both). Figures are a year-1 estimate at your 24.0% rate — not tax advice; consult a CPA.
Schools (NCES district)
- District
- Bryant School District
- NCES district ID
- 0503690
- Math proficiency
- 49% ▼ -13.00%
- Reading proficiency
- 48% ▼ -8.00%
- Median HH income
- $57,578
- Composite
- 42.28/100
- National rank
- #3266
- State rank
- #16 of 238 in AR
Livability — Bryant
- Score
- 74/100
- State rank
- #16
- US rank
- #4487
Category grades
Schools grade is shown separately in the Schools card above.
Census & demographics
- Census place
- Bryant, AR
- City population
- 18,350
- Population (ZIP)
- 18,350
Population outlook (Saline County) Hauer SSP2
- Today (2025)
- 140,141 people
- By 2030
- 151,233 · +7.9%
- By 2040
- 173,100 · +23.5%
- By 2050
- 194,368 · +38.7%
- By 2075
- 245,295 · +75.0%
- By 2100
- 279,117 · +99.2%
Race, ethnicity, and origin ACS 2023
- Neighborhood character
- Predominantly White (75%)
- Race & ethnicity
- White 75% Black 13% Two or more races 7% Hispanic / Latino 4% Asian 2%
- Common ancestry
- Slovak 1% Lithuanian 1% Romanian 1%
- Foreign-born
- 3% · Canada, South Korea
- Languages at home
- 94% English-only · Spanish 4% Korean 1% Other Indo-European 1%
Political lean MEDSL · Saline
- 2024 margin
- Solid R (+40.1) · D 28.8% · R 69.0% · Other 2.2%
- 2008→2024 swing
- +0.8pp no change · 2008: -41.0pp · 2024: -40.1pp
- All cycles
- 2024: R+40.1 2020: R+41.2 2016: R+43.5 2012: R+42.7 2008: R+41.0
Not yet ingested
- Civics
- —
Market trends
- HPI YoY
- ▼ -42.32%
- Current HPI
- 213.5119
- Rent YoY
- —
- Metro
- —
- State GDP YoY
- ▲ 3.80%
- F500 in state
- 10
Industry mix (Fortune 500 HQ in AR)
| Industry | F500 HQs | Revenue |
|---|---|---|
| Retail | 1 | $681B |
|
||
| Food / Agriculture | 1 | $53B |
|
||
| Retail / Energy | 1 | $22B |
|
||
| Transportation / Logistics | 1 | $12B |
|
||
| Energy | 1 | $4B |
|
||
Price history
+56.7% since first listed10 events — show timeline
- 2026-05-29 Listed $210,000 FSBO.com
- 2021-10-05 Sold (Public Records) $192,000 Public Records
- 2021-09-28 Sold (MLS) $192,000 CARMLS
- 2021-09-03 Pending — CARMLS
- 2021-09-01 Price Changed $180,000 CARMLS
- 2021-08-30 Listed $178,000 CARMLS
- 2014-01-08 Sold (MLS) $127,500 CARMLS
- 2013-12-05 Listing Removed — CARMLS
- 2013-10-11 Listed $134,500 CARMLS
- 2004-10-14 Sold (Public Records) $134,000 Public Records
Property tax history
+3.7%/yrLatest (2025): $1,172 · -7.9% YoY. Source: county tax records.
Cash-flow waterfall
monthlySold comps — $/sqft
last 12 mo · ≤1 miLoading sold comps…