 Duplex
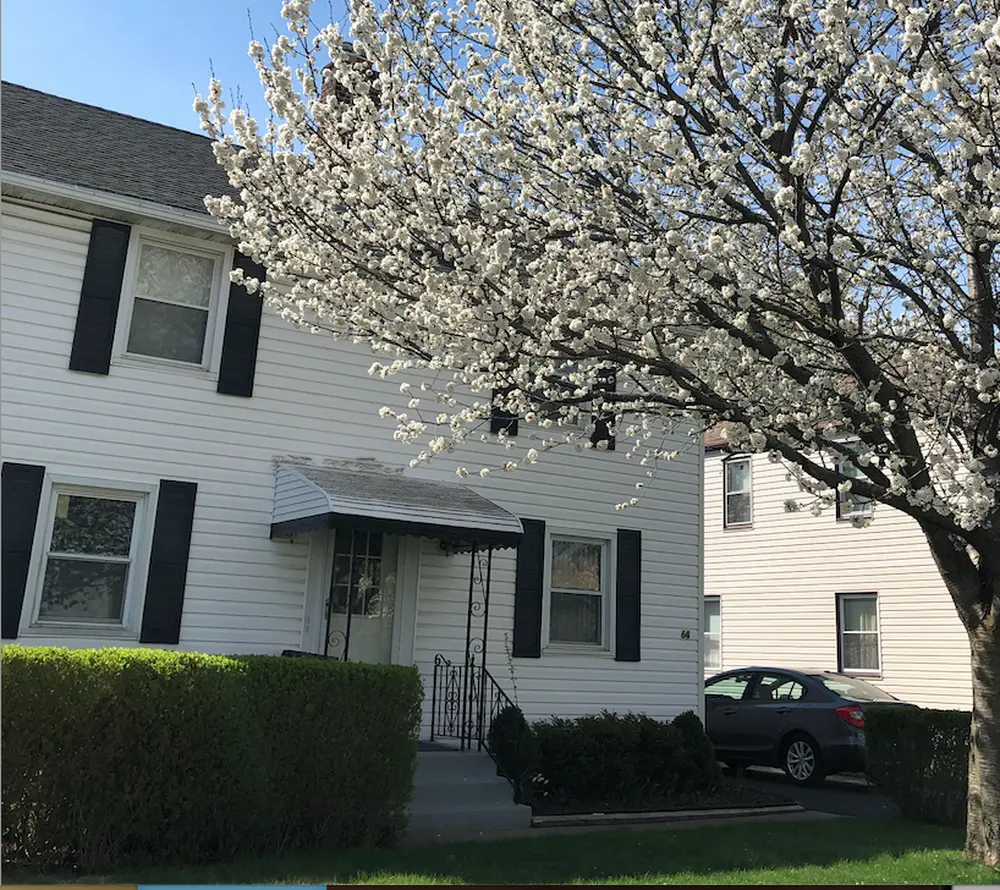
64 Virginia Rd · Cheektowaga, NY
Flood risk 1/10 · Minimal
- FEMA flood zone
- X (unshaded)
- Chance of flooding over 30 yrs
- 0.0%
- Est. flood insurance / yr
- $473 – $860
Fire risk 1/10 · Minimal
- Est. fire insurance / yr
- $691 – $1,283
Heat risk 2/10 · Minimal
- Hot days now (above 92°F)
- 7 days/yr
- Hot days in 30 yrs
- 15 days/yr
Wind risk 1/10 · Minimal
- Chance of severe wind over 30 yrs
- —
Air-quality risk 3/10 · Minor
- Unhealthy air days now
- 2 days/yr
- Unhealthy air days in 30 yrs
- 3 days/yr
Risk factors via First Street. Map © Google.
Why this score? — see what drove the D grade
The composite is a weighted blend of 9 inputs, each scored 0–100. Each bar is that input's sub-score; the figure is the points it added to the 100-point composite (weight × sub-score).
- Cash flow +15.6/30.0
- Schools +5.9/10.0
- 1% rule +4.8/10.0
- DSCR +4.8/10.0
- Livability +4.2/5.0
- Rent growth +2.5/5.0
- Condition / age +2.5/5.0
- ARV discount +1.7/15.0
- Appreciation +0.0/10.0
$289,000
🖨 Deal sheet 📄 Offer letter ✓ Due diligence
Multi-family units
County records classify this as Multi-Family (2-4 Unit). Listing-text estimate: 2 units. confirmed
Listing remarks MLS
Rare opportunity to own a meticulously maintained 2-unit duplex with both units vacant, offering excellent flexibility for investors seeking rental income or owner-occupants looking to live in one unit while renting the other. Nestled in a quiet residential neighborhood just minutes from the Village of Williamsville, the thruway, shopping, dining, and public transportation.
Key facts
- Vacant units
- 2 unit duplex
- Built 1942
Tags
Neighborhood map
What this means for you Summary
Snapshot
- This is a 2 × 2-bed/1.5-bath units multifamily listed at $289k.
Deal economics
- At list price, monthly cash flow is $119 ($1k/yr) — positive. Per door: $60/mo.
- The deal already cash-flows at list — no discount required.
- To meet the 1% rule (rent ≥ 1% of price), the offer needs to be $284k (1.7% below list).
- Recommended offer: $284k (1.7% below list) — sets the bar for 1% rule.
- Cap rate 6.8% vs local median 3.8% in Cheektowaga — top-decile yield for the area; either an underpriced asset or a hidden risk that comps aren't pricing in. Stress-test before assuming the spread holds.
Location & tenants
- Location reads 84/100 on livability (#54 in NY, #811 nationally) — a professional / high-income tenant draw. Strengths: commute A+, housing A+, health & safety A+; Watch: crime C-.
- Cheektowaga-Maryvale Union Free School District (urban): math 67% / reading 73% proficiency, ranked #154 of 590 in NY (top 26%) — strong family-tenant draw, lease renewals of 3-5y typical.
- Market conditions: 207 active listings in the ZIP; 3 comparable units currently listed for rent nearby; rentals leasing fast (median 3d on market — plan ~1-2 weeks tenant-placement turnaround); 1,244 units permitted in Erie County in 2024 (563 in 5+ unit buildings).
- At $2,841/mo this rent would consume 51% of the median local household income ($67k/yr) (locally 991% of renters already pay >50% of income on rent) — very limited rent-growth headroom before tenants either downsize or default.
Forward outlook
- Local home prices are declining (-3.0%/yr); year-one equity from $2k of loan paydown is wiped out by about $9k of value loss. Plan a longer hold.
Negotiation context
- It's been on market 23 days — a 2% lower offer ($285k) is reasonable based on typical stale-listing flexibility.
- 2 sale attempts with the ask held roughly flat each time — persistent listings suggest the price (not the market) is what's stuck; bring a comps-based counter.
Risks & watch-outs
- Watch-outs: built in 1942 — expect roof / HVAC / electrical / plumbing capex.
Questions for the listing agent
- Can we see the unit-by-unit rent roll, current vacancy, and any below-market leases? What's the average tenancy length?
- What capital expenditures (roof, boiler, parking lot, exteriors) have been made in the last 5 years, and what's planned in the next 2?
- Built in 1942 — when were the roof, HVAC, electrical panel, plumbing, and water heater last replaced?
- Is there a deadline driving the sale (1031 exchange, divorce, estate, relocation)? That informs how much negotiation room exists.
- Schools are B-rated — typically a magnet for longer-tenancy family renters. What's the average tenant stay here, and is there a school-zone premium baked into asking?
- The area grade is low — what's the realistic commute time and amenity access for the typical tenant pool here? Any planned neighborhood developments (good or bad) we should know about?
- What's the average days-on-market for RENTAL listings here right now (not sales)? A rising rental-DOM trend means longer vacancies and softer asking-rent achievability than the comps imply.
- What's the recent tenant-quality profile in this submarket — average credit score on applications, eviction rate, late-payment / NSF rate, and stable-employment percentage? A property-management company in the area should have these aggregated.
- How much new apartment / multifamily construction is in the pipeline within 1–3 miles? Heavy new supply (>2% of stock underway) typically softens rents 12–24 months out; light construction supports rent growth.
Investment metrics
- 1% rule
- 0.98% ✗
- Cap rate
- 6.79%
- Cash-on-cash
- 1.77%
- DSCR
- 1.08
- GRM
- 8.5
CMA / ARV
- ARV (median comp)
- $255,970
- List price
- $289,000
- Delta
- 12.90%
- Verdict
- OVERPRICED
- Comps
- 20 within 1.0 mi
Show comp detail 5 sales within ~0.75 mi
| Address | Dist | Beds/Ba | Sqft | Sold | Price | $/sf | Match |
|---|---|---|---|---|---|---|---|
| 7 Matthew Ln | 0.13mi | 4/2.0 | 1,792 (+11%) | 4mo | $250,000 | $140 | 71 |
| 4613 Union Rd | 0.53mi | 4/2.0 | 1,612 (0%) | 9mo | $200,000 | $124 | 68 |
| 1 Jean | 0.15mi | 4/2.0 | 1,798 (+12%) | 22mo | $270,000 | $150 | 56 |
| 620 Beach Rd | 0.73mi | 4/2.0 | 1,600 (-1%) | 14mo | $224,000 | $140 | 53 |
| 302 S Forest Rd | 0.38mi | 5/2.0 (+1) | 1,822 (+13%) | 6mo | $282,500 | $155 | 51 |
Match score weights: distance 35% · size 25% · config 20% · recency 20%. Top-matched comps best support the ARV.
Projected returns pro-forma
-3.0% appreciation · 3.0% rent growth · sell at horizon
- IRR
- -13.4%
- Equity multiple
- 0.52×
- Total profit
- $-39,122
- Equity at exit
- $43,091
- IRR
- -4.5%
- Equity multiple
- 0.71×
- Total profit
- $-23,803
- Equity at exit
- $24,987
Cash invested: $80,920 (down + closing). Projections, not guarantees.
Landlord ↔ Tenant lean methodology
- Overall (STATE)
- 15 Strongly Tenant-Friendly
- State New York
- 15 Strongly Tenant-Friendly · D+10
- County
- — inherits STATE
- City
- — inherits STATE
ZIP-level market 14225
- Home prices YoY
- -27.3%
- Active inventory
- 207
- Price-to-rent
- 17.0×
Monthly cashflow live
- Estimated rent
- $2,841 high interval (Pro) →
- Mortgage (P&I)
- −$1,516
- Tax from tax record
- −$489 /mo · $5,872/yr
- Insurance
- −$120
- HOA
- −$0
- Vacancy / Maint / Mgmt
- −$597
- Net cashflow
- $119
Break-even live
2-unit breakdown (identical units grouped — click to expand)
| Units | Beds | Baths | Est. rent |
|---|---|---|---|
| 2× units | 2 | 1.5 | $2,842 |
| #1 | 2 | 1.5 | $1,421 |
| #2 | 2 | 1.5 | $1,421 |
| Total (2 units) | $2,841 | ||
UW: 25.0% down · 7.5% · 30yr · 1.5% tax · 5.0% vac · 8.0% maint · 8.0% mgmt
Financing live
Cash to close
- Down payment
- $72,250
- Closing costs
- $8,670
- Reserves months
- —
- Total cash needed
- —
Loan-product check · same deal, 3 products live
Conventional
25% down · 7.5% · 30yr
- Down + closing
- —
- Monthly P&I
- —
- Monthly cashflow
- —
- DSCR
- —
- Eligible?
- —
Personal DTI + credit; lowest rate.
DSCR
20% down · 8.5% · 30yr
- Down + closing
- —
- Monthly P&I
- —
- Monthly cashflow
- —
- DSCR
- —
- Eligible?
- —
No personal income docs; deal must DSCR.
Hard money
10% down · 12.0% · 12mo
- Down + closing
- —
- Monthly P&I
- —
- Monthly cashflow
- —
- DSCR
- —
- Eligible?
- —
Short-term bridge; refi at stabilization.
Rent comps 3 comps
| Address | Beds | Baths | Sqft | Rent | $/sqft | DOM | Units | Dist |
|---|---|---|---|---|---|---|---|---|
| 758 S Huth Rd Buffalo, NY | 5.0 | 2.0 | 2235 | $2,800 | $1.25 | 43d | 1 | 0.51mi |
| 512 Cayuga Rd Buffalo, NY | 3.0 | 1.0 | 1944 | $1,795 | $0.92 | 1d | 1 | 0.58mi |
| 239 Lehn Springs Dr Buffalo, NY | 3.0 | 1.0 | 1700 | $3,200 | $1.88 | 2d | 1 | 0.92mi |
Listing history 16 events
-
2026-06-18days on market $289,000 Active 23 DOM
-
2026-06-17days on market $289,000 Active 22 DOM
-
2026-06-16days on market $289,000 Active 21 DOM
-
2026-06-15days on market $289,000 Active 20 DOM
-
2026-06-13days on market $289,000 Active 18 DOM
-
2026-06-10days on market $289,000 Active 15 DOM
-
2026-06-09days on market $289,000 Active 14 DOM
-
2026-06-08days on market $289,000 Active 13 DOM
-
2026-06-07days on market $289,000 Active 12 DOM
-
2026-06-03days on market $289,000 Active 8 DOM
-
2026-06-02days on market $289,000 Active 7 DOM
-
2026-06-01days on market $289,000 Active 6 DOM
-
2026-05-31days on market $289,000 Active 5 DOM
-
2026-03-15$289,000 Active 376-char remark
Show marketing remark (376 chars)
Rare opportunity to own a meticulously maintained 2-unit duplex with both units vacant, offering excellent flexibility for investors seeking rental income or owner-occupants looking to live in one unit while renting the other. Nestled in a quiet residential neighborhood just minutes from the Village of Williamsville, the thruway, shopping, dining, and public transportation.
-
2025-12-07historical
-
2025-11-07$289,000 Active
ⓘ Source: listings_history table (triggers on properties + properties_extension) + one-shot
backfill from property_details.listing_events for pre-trigger history.
Tax reassessment forecast NY · Partial reset (capped growth)
- Current annual tax
- $5,872 · $489/mo
- Projected year-2 tax
- $5,872 · $489/mo
- Expected delta
- $0/yr ($0/mo · 0.0%)
ⓘ Screening estimate from a state-policy table — verify with the county assessor before closing.
Climate risk First Street
- Flood 1/10 Low FEMA zone X (unshaded) · 0% chance over 30 yrs
- Wildfire 1/10 Low
- Heat 2/10 Low 7 d/yr ≥92°F today · 15 d/yr by 30 yrs out
- Wind 1/10 Low
- Air quality 3/10 Moderate 2 unhealthy d/yr today · 3 by 30 yrs out
Nearby sold comps map
Loading sold comps map…
Walkable amenities ~0.75 mi
Loading nearby amenities…
Taxation est. · year 1
- Rental income
- $34,092
- − Mortgage interest
- −$16,188
- − Property taxes
- −$5,872
- − Insurance
- −$1,445
- − Repairs & maintenance
- −$2,727
- − Management
- −$2,727
- − Depreciation
- −$8,407
- Taxable loss
- −$3,275
- Est. tax savings @ 24.0%
- +$786
- After-tax cash flow
- $2,216/yr
For passive investors: Depreciation is non-cash, so a rental often shows a tax loss while cash-flowing — sheltering income. Rental losses are passive: they offset passive income freely, and up to $25,000/yr can offset ordinary (W-2) income if you actively participate and your MAGI is under $100k (phasing out to $0 by $150k); unused losses carry forward. On sale, claimed depreciation is recaptured at up to 25%, and gains may owe capital-gains tax (a 1031 exchange can defer both). Figures are a year-1 estimate at your 24.0% rate — not tax advice; consult a CPA.
Schools (NCES district)
- District
- Cheektowaga-Maryvale Union Free School District
- NCES district ID
- 3618600
- Math proficiency
- 67% ▲ 11.00%
- Reading proficiency
- 73% ▲ 23.00%
- Median HH income
- $46,537
- Composite
- 59.02/100
- National rank
- #960
- State rank
- #154 of 590 in NY
Livability — Cheektowaga
- Score
- 84/100
- State rank
- #54
- US rank
- #811
Category grades
Schools grade is shown separately in the Schools card above.
Census & demographics
- Census place
- Cheektowaga, NY
- County
- Erie County · 714,559 people
- City population
- 55,470
- Metro
- Buffalo-Cheektowaga, NY
- Population (ZIP)
- 33,620
- Household income
- $67,237
- Rent vs Own
- Severe rent burden
- 991.0
Population outlook (Erie County) Hauer SSP2
- Today (2025)
- 933,037 people
- By 2030
- 935,181 · +0.2%
- By 2040
- 928,531 · -0.5%
- By 2050
- 905,725 · -2.9%
- By 2075
- 834,037 · -10.6%
- By 2100
- 708,033 · -24.1%
Race, ethnicity, and origin ACS 2023
- Neighborhood character
- Predominantly White (74%)
- Race & ethnicity
- White 74% Black 13% Two or more races 7% Hispanic / Latino 4% Asian 3%
- Common ancestry
- Romanian 21% Lithuanian 3% Iranian 1%
- Foreign-born
- 6% · Canada, Vietnam
- Languages at home
- 92% English-only · Other Indo-European 2% Spanish 2% Arabic 1%
Political lean MEDSL · Erie
- 2024 margin
- Lean D (+9.7) · D 54.8% · R 45.2%
- 2008→2024 swing
- -7.9pp toward R · 2008: 17.5pp · 2024: 9.7pp
- All cycles
- 2024: D+9.7 2020: D+14.7 2016: D+4.8 2012: D+15.6 2008: D+17.5
Not yet ingested
- Civics
- —
Market trends
- HPI YoY
- ▼ -120.26%
- Current HPI
- 320.6248
- Rent YoY
- —
- Metro
- Buffalo-Cheektowaga, NY
- State GDP YoY
- ▲ 2.60%
- F500 in state
- 92
Industry mix (Fortune 500 HQ in NY)
| Industry | F500 HQs | Revenue |
|---|---|---|
| Financial Services | 10 | $950B |
|
||
| Consumer Goods | 9 | $162B |
|
||
| Insurance | 4 | $225B |
|
||
| Telecommunications | 2 | $144B |
|
||
| Pharmaceuticals | 2 | $112B |
|
||
| Media / Entertainment | 2 | $69B |
|
||
Price history
+0.0% since first listed3 events — show timeline
- 2026-03-15 Listed $289,000 ForSaleByOwner.com
- 2025-12-07 Listing Removed — WNYREIS
- 2025-11-07 Listed $289,000 WNYREIS
Property tax history
+5.4%/yrLatest (2025): $5,872 · +0.9% YoY. Source: county tax records.
Cash-flow waterfall
monthlySold comps — $/sqft
last 12 mo · ≤1 miLoading sold comps…