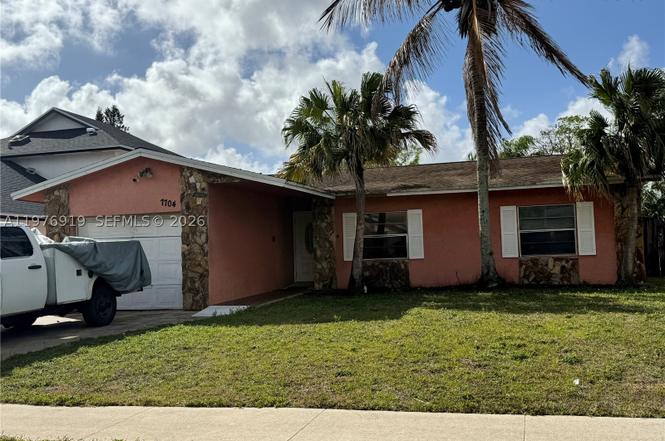
7704 SW 8th Ct · North Lauderdale, FL
Flood risk 1/10 · Minimal
- FEMA flood zone
- X (shaded)
- Chance of flooding over 30 yrs
- 0.0%
- Est. flood insurance / yr
- $507 – $1,088
Fire risk 1/10 · Minimal
- Est. fire insurance / yr
- $947 – $1,759
Heat risk 10/10 · Severe
- Hot days now (above 105°F)
- 7 days/yr
- Hot days in 30 yrs
- 27 days/yr
Wind risk 10/10 · Severe
- Chance of severe wind over 30 yrs
- 99.0%
Air-quality risk 3/10 · Minor
- Unhealthy air days now
- 3 days/yr
- Unhealthy air days in 30 yrs
- 3 days/yr
Risk factors via First Street. Map © Google.
Why this score? — see what drove the B grade
The composite is a weighted blend of 9 inputs, each scored 0–100. Each bar is that input's sub-score; the figure is the points it added to the 100-point composite (weight × sub-score).
- Cash flow +27.1/30.0
- ARV discount +15.0/15.0
- DSCR +9.4/10.0
- 1% rule +6.2/10.0
- Schools +4.1/10.0
- Livability +3.8/5.0
- Condition / age +2.5/5.0
- Rent growth +2.3/5.0
- Appreciation +0.0/10.0
$250,000
🖨 Deal sheet 📄 Offer letter ✓ Due diligence
Listing remarks MLS
STUNNING 3BEDROOM 2BATH 1 CAR GARAGE POOL LAKE VIEW HOME WITH AMAZING VIEWS! * * * * * * OPEN FLOOR PLAN WITH A KITCHEN ISLAND * * * * NEWER A/C AND POOL PUMP * * * TILE FLOORS * * HUGE FENCED IN YARD WITH A WRAP AROUND SCREEN IN PATIO GREAT SPACE FOR ENTERTAINING * * EXTENDED DRIVEWAY * * * GREAT LOCATION! * * * WON'T LAST! * * * *
Key facts
- 6,616 sq ft lot
- Garage
- Pool
Neighborhood map
What this means for you Summary
Snapshot
- This is a 3-bed/2.0-bath single-family listed at $250k.
Deal economics
- At list price, monthly cash flow is $709 ($9k/yr) — positive.
- The deal already cash-flows at list — no discount required.
- Meets the 1% rule at list price ($3k rent vs $250k).
- Cap rate 9.7% vs local median 4.3% in North Lauderdale — top-decile yield for the area; either an underpriced asset or a hidden risk that comps aren't pricing in. Stress-test before assuming the spread holds.
Location & tenants
- Location reads 76/100 on livability (#230 in FL, #3,635 nationally) — a middle-class / working-renter tenant base. Strengths: housing A+, health & safety A+, cost of living A; Watch: commute C-, employment D, amenities F.
- Broward (suburban): math 42% / reading 53% proficiency, ranked #46 of 73 in FL (top 63%) — families likely to look elsewhere, expect single-tenant / working-renter base with shorter leases.
- Market conditions: Rents soft (-0.7%/yr); 298 active listings in the ZIP; 40 comparable units currently listed for rent nearby; rentals at typical pace (median 25d on market — plan ~3-4 weeks tenant-placement turnaround); 2,111 units permitted in Broward County in 2024 (1,265 in 5+ unit buildings).
- At $2,796/mo this rent would consume 52% of the median local household income ($64k/yr) (locally 3073% of renters already pay >50% of income on rent) — very limited rent-growth headroom before tenants either downsize or default.
Forward outlook
- Local home prices are declining (-3.0%/yr); year-one equity from $2k of loan paydown is wiped out by about $8k of value loss. Plan a longer hold.
- Broward County population projected at +34% by 2050 — long-run rental-demand tailwind backs the buy-and-hold thesis.
Negotiation context
- Only 5 days on market — expect competitive offers; lowballing is unlikely to land.
- 3 sale attempts since 21y ago with the ask held roughly flat each time — persistent listings suggest the price (not the market) is what's stuck; bring a comps-based counter.
Risks & watch-outs
- Climate carrying-cost: severe wind risk, 99% chance of damaging wind over 30y; extreme-heat days projected 7→27/yr by 2055 (HVAC capex compounding) — expect insurance premiums to compound above CPI over the hold.
Questions for the listing agent
- Is there a deadline driving the sale (1031 exchange, divorce, estate, relocation)? That informs how much negotiation room exists.
- What's the average days-on-market for RENTAL listings here right now (not sales)? A rising rental-DOM trend means longer vacancies and softer asking-rent achievability than the comps imply.
- What's the recent tenant-quality profile in this submarket — average credit score on applications, eviction rate, late-payment / NSF rate, and stable-employment percentage? A property-management company in the area should have these aggregated.
- How much new for-sale + rental construction is in the pipeline within 1–3 miles? Heavy new supply typically softens prices + rents 12–24 months out; constrained supply supports both.
Investment metrics
- 1% rule
- 1.12% ✓
- Cap rate
- 9.70%
- Cash-on-cash
- 12.16%
- DSCR
- 1.54
- GRM
- 7.5
CMA / ARV
- ARV (on-the-fly)
- $437,540
- Comps found
- 12
Show comp detail 12 sales within ~0.75 mi
| Address | Dist | Beds/Ba | Sqft | Sold | Price | $/sf | Match |
|---|---|---|---|---|---|---|---|
| 7615 SW 8th Ct | 0.04mi | 3/2.0 | 1,170 (-11%) | 10mo | $391,000 | $334 | 72 |
| 719 SW 79th Ave | 0.23mi | 3/2.0 | 1,170 (-11%) | 3mo | $449,500 | $384 | 69 |
| 604 SW 76th Ter | 0.29mi | 3/1.0 | 1,196 (-9%) | 13mo | $361,000 | $302 | 58 |
| 8221 SW 10th St | 0.55mi | 4/3.0 (+1) | 1,267 (-3%) | 5mo | $400,000 | $316 | 56 |
| 1030 SW 82nd Ave | 0.52mi | 4/3.0 (+1) | 1,334 (+2%) | 10mo | $459,000 | $344 | 55 |
| 7699 SW 6th St | 0.31mi | 2/1.0 (-1) | 1,196 (-9%) | 9mo | $355,000 | $297 | 54 |
| 1221 SW 75th Ave | 0.50mi | 3/2.0 | 1,150 (-12%) | 5mo | $365,000 | $317 | 52 |
| 8200 SW 7th St | 0.56mi | 4/2.0 (+1) | 1,247 (-5%) | 12mo | $441,000 | $354 | 50 |
| 7907 NW 66th Ter | 0.73mi | 2/1.0 (-1) | 1,346 (+3%) | 3mo | $370,000 | $275 | 50 |
| 7435 SW 11th Ct | 0.44mi | 3/2.0 | 1,180 (-10%) | 17mo | $380,000 | $322 | 48 |
| 8211 SW 4th Pl | 0.68mi | 4/3.0 (+1) | 1,370 (+5%) | 11mo | $530,000 | $387 | 42 |
| 1213 SW 82nd Ave | 0.67mi | 4/3.0 (+1) | 1,450 (+11%) | 7mo | $505,000 | $348 | 36 |
Match score weights: distance 35% · size 25% · config 20% · recency 20%. Top-matched comps best support the ARV.
Projected returns pro-forma
-3.0% appreciation · 0.0% rent growth · sell at horizon
- IRR
- -1.4%
- Equity multiple
- 0.95×
- Total profit
- $-3,635
- Equity at exit
- $37,276
- IRR
- 5.1%
- Equity multiple
- 1.33×
- Total profit
- $22,932
- Equity at exit
- $21,615
Cash invested: $70,000 (down + closing). Projections, not guarantees.
Landlord ↔ Tenant lean methodology
- Overall (STATE)
- 87 Strongly Landlord-Friendly
- State Florida
- 87 Strongly Landlord-Friendly · R+3
- County
- — inherits STATE
- City
- — inherits STATE
ZIP-level market 33068
- Rents YoY
- -0.7%
- Active inventory
- 298
- Price-to-rent
- 7.5×
Monthly cashflow live
- Estimated rent
- $2,796 high interval (Pro) →
- Mortgage (P&I)
- −$1,311
- Tax from tax record
- −$84 /mo · $1,012/yr
- Insurance
- −$104
- HOA
- −$0
- Vacancy / Maint / Mgmt
- −$587
- Net cashflow
- $709
Break-even live
UW: 25.0% down · 7.5% · 30yr · 1.5% tax · 5.0% vac · 8.0% maint · 8.0% mgmt
Financing live
Cash to close
- Down payment
- $62,500
- Closing costs
- $7,500
- Reserves months
- —
- Total cash needed
- —
Loan-product check · same deal, 3 products live
Conventional
25% down · 7.5% · 30yr
- Down + closing
- —
- Monthly P&I
- —
- Monthly cashflow
- —
- DSCR
- —
- Eligible?
- —
Personal DTI + credit; lowest rate.
DSCR
20% down · 8.5% · 30yr
- Down + closing
- —
- Monthly P&I
- —
- Monthly cashflow
- —
- DSCR
- —
- Eligible?
- —
No personal income docs; deal must DSCR.
Hard money
10% down · 12.0% · 12mo
- Down + closing
- —
- Monthly P&I
- —
- Monthly cashflow
- —
- DSCR
- —
- Eligible?
- —
Short-term bridge; refi at stabilization.
Rent comps 40 comps
| Address | Beds | Baths | Sqft | Rent | $/sqft | DOM | Units | Dist |
|---|---|---|---|---|---|---|---|---|
| 7603 Kimberly Blvd North Lauderdale, FL | 3.0 | 2.0 | 1145 | $2,875 | $2.51 | 24d | 1 | 0.15mi |
| 7721 SW 10th Ct Unit B North Lauderdale, FL | 3.0 | 1.0 | 1050 | $1,950 | $1.86 | 24d | 1 | 0.20mi |
| 7701 SW 10th Ct Unit 1A North Lauderdale, FL | 3.0 | 1.0 | 1060 | $2,350 | $2.22 | 14d | 1 | 0.20mi |
| 7731 SW 10th Ct Unit 4 North Lauderdale, FL | 3.0 | 1.0 | 1200 | $2,500 | $2.08 | 17d | 1 | 0.20mi |
| 7816 SW 7th Pl North Lauderdale, FL | 3.0 | 2.0 | 1620 | $3,500 | $2.16 | 24d | 1 | 0.20mi |
| 7820 SW 9th St North Lauderdale, FL | 2.0 | 2.0 | 994 | $2,576 | $2.59 | 12d | 1 | 0.24mi |
| 7906 SW 8th St North Lauderdale, FL | 3.0 | 2.5 | 1440 | $3,500 | $2.43 | 5d | 1 | 0.26mi |
| 7830 SW 10th Ct Unit A North Lauderdale, FL | 3.0 | 2.0 | 960 | $2,750 | $2.86 | 24d | 1 | 0.27mi |
| 7710 SW 6th St North Lauderdale, FL | 2.0 | 1.0 | 1056 | $2,525 | $2.39 | 3d | 1 | 0.29mi |
| 861 SW 74th Ter Unit 102D North Lauderdale, FL | 3.0 | 2.0 | 1150 | $2,100 | $1.83 | 24d | 1 | 0.31mi |
| 881 SW 74th Ter Unit 102C North Lauderdale, FL | 3.0 | 2.0 | 1150 | $2,200 | $1.91 | 24d | 1 | 0.31mi |
| 7336 SW 8th Ct #6 North Lauderdale, FL | 2.0 | 2.0 | 1056 | $2,100 | $1.99 | 24d | 1 | 0.32mi |
| 7931 SW 7th Pl #7931 North Lauderdale, FL | 4.0 | 2.5 | 1620 | $3,300 | $2.04 | 14d | 1 | 0.33mi |
| 7931 SW 7th Pl North Lauderdale, FL | 4.0 | 2.5 | 1620 | $3,300 | $2.04 | 15d | 1 | 0.33mi |
| 7931 SW 7th Pl North Lauderdale, FL | 4.0 | 2.5 | 1620 | $3,300 | $2.04 | 17d | 1 | 0.33mi |
| 709 SW 79th Ter North Lauderdale, FL | 2.0 | 2.0 | 1152 | $2,950 | $2.56 | 24d | 1 | 0.33mi |
| 931 SW 80th Ave Unit A North Lauderdale, FL | 3.0 | 2.0 | 1000 | $2,795 | $2.79 | 24d | 1 | 0.35mi |
| 7966 SW 7th Ct North Lauderdale, FL | 4.0 | 2.5 | 1709 | $3,100 | $1.81 | 5d | 1 | 0.37mi |
| 726 SW 81st Ter Unit 14A North Lauderdale, FL | 3.0 | 2.0 | 990 | $2,350 | $2.37 | 24d | 1 | 0.39mi |
| 726 SW 81st Ter Unit 14A North Lauderdale, FL | 3.0 | 2.0 | 990 | $2,350 | $2.37 | 15d | 1 | 0.39mi |
| 7400 Kimberly Blvd Unit 202A North Lauderdale, FL | 3.0 | 2.0 | 1150 | $2,800 | $2.43 | 8d | 1 | 0.40mi |
| 7480 SW 10th Ct #1 North Lauderdale, FL | 3.0 | 2.0 | 1200 | $3,249 | $2.71 | 24d | 1 | 0.41mi |
| 1233 Hampton Blvd North Lauderdale, FL | 3.0 | 2.5 | 1612 | $2,750 | $1.71 | 24d | 1 | 0.42mi |
| 1177 Sussex Dr North Lauderdale, FL | 2.0 | 1.0 | 1236 | $2,370 | $1.92 | 24d | 1 | 0.43mi |
| 1001 SW 74th Ave Unit 201a North Lauderdale, FL | 3.0 | 2.0 | 1150 | $2,650 | $2.30 | 5d | 1 | 0.44mi |
| 401 SW 76th Ter North Lauderdale, FL | 4.0 | 2.0 | 1370 | $3,500 | $2.55 | 24d | 1 | 0.45mi |
| 8040 Hampton Blvd #508 North Lauderdale, FL | 2.0 | 2.0 | 1350 | $2,300 | $1.70 | 24d | 1 | 0.48mi |
| 8030 Hampton Blvd #414 North Lauderdale, FL | 2.0 | 2.0 | 1350 | $1,950 | $1.44 | 24d | 1 | 0.51mi |
| 1359 Avon Ln North Lauderdale, FL | 3.0 | 2.5 | 1632 | $3,300 | $2.02 | 24d | 1 | 0.57mi |
| 7900 Hampton Blvd North Lauderdale, FL | 1.0–2.0 | 1.0–2.0 | 925 | $2,364 | $2.56 | 2d | 35 | 0.57mi |
| 8210 SW 7th St North Lauderdale, FL | 3.0 | 2.0 | 1247 | $2,950 | $2.37 | 24d | 1 | 0.58mi |
| 1213 SW 74th Ave North Lauderdale, FL | 4.0 | 2.0 | 1150 | $4,100 | $3.57 | 24d | 1 | 0.59mi |
| 7306 SW 3rd Ct North Lauderdale, FL | 3.0 | 2.0 | 1288 | $2,685 | $2.08 | 21d | 1 | 0.62mi |
| 8120 SW 4th Ct North Lauderdale, FL | 4.0 | 3.0 | 1370 | $4,000 | $2.92 | 5d | 1 | 0.63mi |
| 7907 SW 3rd St North Lauderdale, FL | 4.0 | 2.0 | 1114 | $4,250 | $3.82 | 24d | 1 | 0.65mi |
| 1400 Avon Ln North Lauderdale, FL | 1.0–3.0 | 1.0–2.0 | 1070 | $2,876 | $2.69 | 2d | 58 | 0.67mi |
| 7901 Southgate Blvd Apt C5 North Lauderdale, FL | 2.0 | 2.0 | 1010 | $2,100 | $2.08 | 3d | 1 | 0.73mi |
| 6903 Rio Pinar North Lauderdale, FL | 4.0 | 2.0 | 1800 | $3,300 | $1.83 | 24d | 1 | 0.74mi |
| 7461 SW 1st St Margate, FL | 3.0 | 2.0 | 1350 | $3,200 | $2.37 | 13d | 1 | 0.75mi |
| 631 Kathy Ct Margate, FL | 2.0 | 2.0 | 875 | $1,995 | $2.28 | 17d | 1 | 0.75mi |
Listing history 12 events
-
2026-03-18status Pending
-
2026-03-05$250,000 Active
-
2018-07-20soldstatus $293,000 Sold 355-char remark
Show marketing remark (355 chars)
STUNNING 3BEDROOM 2BATH 1 CAR GARAGE POOL LAKE VIEW HOME WITH AMAZING VIEWS! * * * * * * OPEN FLOOR PLAN WITH A KITCHEN ISLAND * * * * NEWER A/C AND POOL PUMP * * * TILE FLOORS * * HUGE FENCED IN YARD WITH A WRAP AROUND SCREEN IN PATIO GREAT SPACE FOR ENTERTAINING * * EXTENDED DRIVEWAY * * * GREAT LOCATION! * * * WON'T LAST! * * * *
-
2018-07-20soldstatus $293,000
Show marketing remark (355 chars)
STUNNING 3BEDROOM 2BATH 1 CAR GARAGE POOL LAKE VIEW HOME WITH AMAZING VIEWS! * * * * * * OPEN FLOOR PLAN WITH A KITCHEN ISLAND * * * * NEWER A/C AND POOL PUMP * * * TILE FLOORS * * HUGE FENCED IN YARD WITH A WRAP AROUND SCREEN IN PATIO GREAT SPACE FOR ENTERTAINING * * EXTENDED DRIVEWAY * * * GREAT LOCATION! * * * WON'T LAST! * * * *
-
2018-06-15status Backup Contract 355-char remark
Show marketing remark (355 chars)
STUNNING 3BEDROOM 2BATH 1 CAR GARAGE POOL LAKE VIEW HOME WITH AMAZING VIEWS! * * * * * * OPEN FLOOR PLAN WITH A KITCHEN ISLAND * * * * NEWER A/C AND POOL PUMP * * * TILE FLOORS * * HUGE FENCED IN YARD WITH A WRAP AROUND SCREEN IN PATIO GREAT SPACE FOR ENTERTAINING * * EXTENDED DRIVEWAY * * * GREAT LOCATION! * * * WON'T LAST! * * * *
-
2018-05-24$289,900 Active 355-char remark
Show marketing remark (355 chars)
STUNNING 3BEDROOM 2BATH 1 CAR GARAGE POOL LAKE VIEW HOME WITH AMAZING VIEWS! * * * * * * OPEN FLOOR PLAN WITH A KITCHEN ISLAND * * * * NEWER A/C AND POOL PUMP * * * TILE FLOORS * * HUGE FENCED IN YARD WITH A WRAP AROUND SCREEN IN PATIO GREAT SPACE FOR ENTERTAINING * * EXTENDED DRIVEWAY * * * GREAT LOCATION! * * * WON'T LAST! * * * *
-
2006-03-23soldstatus $312,700
-
2006-03-20soldstatus $312,620 516-char remark
Show marketing remark (516 chars)
WOW! BIG PRICE REDUCTION - SELLER IS READY TO GO & WILLING TO PAY 2% TOWARD BUYER CLOSING COSTS! GRAB YOUR MARGARITA & SUN SHADES, BECAUSE YOU'LL THINK YOU ARE IN KEY WEST! LISTEN TO THE SOUND OF TRICKLING FOUNTAINS WHILE YOU'RE LOUNGING IN THE POOL, O N THE DECK, OR IN THE HUGE PATIO OVERLOOKING THE CANAL. BEAUTIFUL HOME, SHOWS LIKE A MODEL. THE MINUTE YOU SEE THIS HOME, YOU'LL WANT TO CALL IT YOUR OWN! TAX RECORDS DO NOT REFLECT THE HUGE SCREENED PATIO WHICH ADDS MUCH LIVING SPACE TO THE HOME.
-
2005-12-21$319,000 516-char remark
Show marketing remark (516 chars)
WOW! BIG PRICE REDUCTION - SELLER IS READY TO GO & WILLING TO PAY 2% TOWARD BUYER CLOSING COSTS! GRAB YOUR MARGARITA & SUN SHADES, BECAUSE YOU'LL THINK YOU ARE IN KEY WEST! LISTEN TO THE SOUND OF TRICKLING FOUNTAINS WHILE YOU'RE LOUNGING IN THE POOL, O N THE DECK, OR IN THE HUGE PATIO OVERLOOKING THE CANAL. BEAUTIFUL HOME, SHOWS LIKE A MODEL. THE MINUTE YOU SEE THIS HOME, YOU'LL WANT TO CALL IT YOUR OWN! TAX RECORDS DO NOT REFLECT THE HUGE SCREENED PATIO WHICH ADDS MUCH LIVING SPACE TO THE HOME.
-
2003-11-06soldstatus $182,000
-
1982-03-01soldstatus $64,500
-
1980-12-01soldstatus $145,000
ⓘ Source: listings_history table (triggers on properties + properties_extension) + one-shot
backfill from property_details.listing_events for pre-trigger history.
Tax reassessment forecast FL · Resets to sale price
- Current annual tax
- $1,012 · $84/mo
- Projected year-2 tax
- $2,075 · $173/mo
- Expected delta
- +$1,063/yr (+$89/mo · 105.0%)
ⓘ Screening estimate from a state-policy table — verify with the county assessor before closing.
Climate risk First Street
- Flood 1/10 Low FEMA zone X (shaded) · 0% chance over 30 yrs
- Wildfire 1/10 Low
- Heat 10/10 Extreme 7 d/yr ≥105°F today · 27 d/yr by 30 yrs out
- Wind 10/10 Extreme 99% chance of damaging wind over 30 yrs
- Air quality 3/10 Moderate 3 unhealthy d/yr today · 3 by 30 yrs out
Nearby sold comps map
Loading sold comps map…
Walkable amenities ~0.75 mi
Loading nearby amenities…
Taxation est. · year 1
- Rental income
- $33,550
- − Mortgage interest
- −$14,004
- − Property taxes
- −$1,012
- − Insurance
- −$1,250
- − Repairs & maintenance
- −$2,684
- − Management
- −$2,684
- − Depreciation
- −$7,273
- Taxable income
- $4,643
- Est. tax owed @ 24.0%
- −$1,114
- After-tax cash flow
- $7,396/yr
For passive investors: Depreciation is non-cash, so a rental often shows a tax loss while cash-flowing — sheltering income. Rental losses are passive: they offset passive income freely, and up to $25,000/yr can offset ordinary (W-2) income if you actively participate and your MAGI is under $100k (phasing out to $0 by $150k); unused losses carry forward. On sale, claimed depreciation is recaptured at up to 25%, and gains may owe capital-gains tax (a 1031 exchange can defer both). Figures are a year-1 estimate at your 24.0% rate — not tax advice; consult a CPA.
Schools (NCES district)
- District
- Broward
- NCES district ID
- 1200180
- Math proficiency
- 42% ▼ -18.00%
- Reading proficiency
- 53% ▼ -5.00%
- Median HH income
- $52,139
- Composite
- 40.88/100
- National rank
- #3621
- State rank
- #46 of 73 in FL
Livability — North Lauderdale
- Score
- 76/100
- State rank
- #230
- US rank
- #3635
Category grades
Schools grade is shown separately in the Schools card above.
Census & demographics
- Census place
- North Lauderdale, FL
- County
- Broward County · 1,963,430 people
- City population
- 54,439
- Metro
- Miami-Fort Lauderdale-Pompano Beach, FL
- Population (ZIP)
- 54,439
- Household income
- $64,051
- Rent vs Own
- Severe rent burden
- 3073.0
Population outlook (Broward County) Hauer SSP2
- Today (2025)
- 2,207,033 people
- By 2030
- 2,360,704 · +7.0%
- By 2040
- 2,661,208 · +20.6%
- By 2050
- 2,946,698 · +33.5%
- By 2075
- 3,602,273 · +63.2%
- By 2100
- 3,970,984 · +79.9%
Race, ethnicity, and origin ACS 2023
- Neighborhood character
- Diverse neighborhood (Simpson 0.61)
- Race & ethnicity
- Black 58% Hispanic / Latino 21% Two or more races 13% White 11% Asian 4%
- Hispanic origin (detail)
- Mexican 3% Puerto Rican 4% Cuban 1% Dominican 3%
- Common ancestry
- Hispanic 17% Estonian 1% Lithuanian 1%
- Foreign-born
- 47% · Canada, Jamaica, Vietnam
- Languages at home
- 59% English-only · Spanish 19% French/Haitian/Cajun 15% Other Indo-European 2%
Political lean MEDSL · Broward
- 2024 margin
- D (+17.0) · D 58.0% · R 41.0%
- 2008→2024 swing
- -17.8pp toward R · 2008: 34.7pp · 2024: 17.0pp
- All cycles
- 2024: D+17.0 2020: D+29.8 2016: D+35.0 2012: D+34.9 2008: D+34.7
Not yet ingested
- Civics
- —
Market trends
- HPI YoY
- ▼ -317.60%
- Current HPI
- 426.2972
- Rent YoY
- ▼ -0.74%
- Metro
- Miami-Fort Lauderdale-Pompano Beach, FL
- State GDP YoY
- ▲ 3.28%
- F500 in state
- 36
Industry mix (Fortune 500 HQ in FL)
| Industry | F500 HQs | Revenue |
|---|---|---|
| Industrial Technology | 2 | $29B |
|
||
| Insurance | 2 | $17B |
|
||
| Retail | 1 | $60B |
|
||
| Technology Distribution | 1 | $58B |
|
||
| Homebuilding | 1 | $35B |
|
||
| Technology Manufacturing | 1 | $35B |
|
||
Price history
+72.4% since first listed12 events — show timeline
- 2026-03-18 Pending — MARMLS
- 2026-03-05 Listed $250,000 MARMLS
- 2018-07-20 Sold (Public Records) $293,000 Public Records
- 2018-07-20 Sold (MLS) $293,000 MARMLS
- 2018-06-15 Pending — MARMLS
- 2018-05-24 Listed $289,900 MARMLS
- 2006-03-23 Sold (Public Records) $312,700 Public Records
- 2006-03-20 Sold (MLS) $312,620 MARMLS
- 2005-12-21 Listed $319,000 MARMLS
- 2003-11-06 Sold (Public Records) $182,000 Public Records
- 1982-03-01 Sold (Public Records) $64,500 Public Records
- 1980-12-01 Sold (Public Records) $145,000 Public Records
Property tax history
-5.8%/yrLatest (2025): $1,012 · +1.0% YoY. Source: county tax records.
Cash-flow waterfall
monthlySold comps — $/sqft
last 12 mo · ≤1 miLoading sold comps…