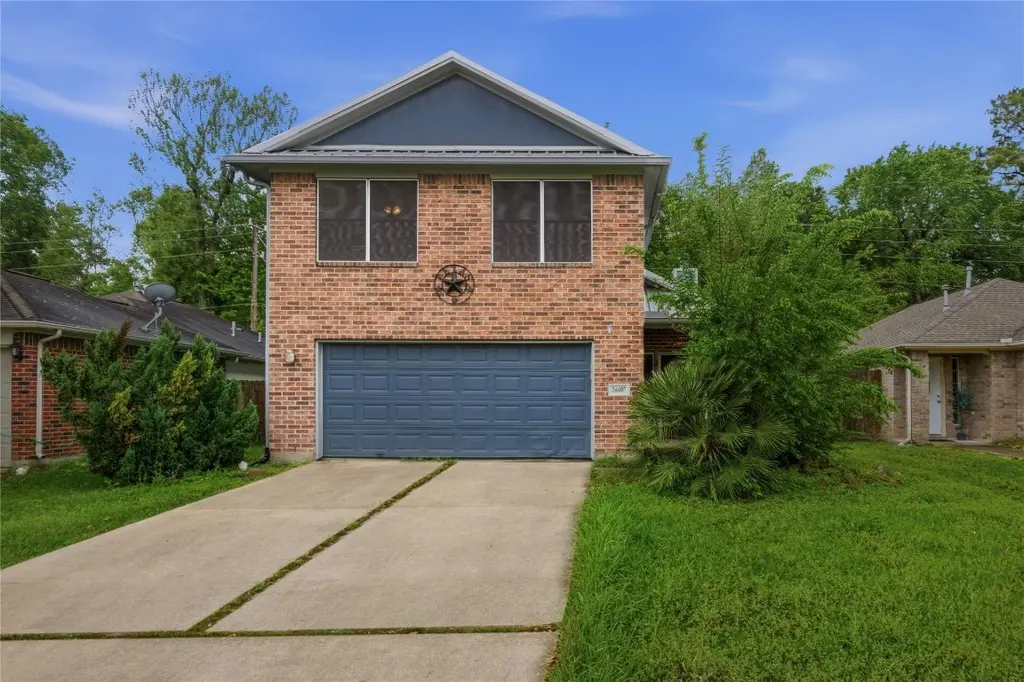
24407 Strong Pine Dr · Houston, TX
Flood risk 4/10 · Minor
- FEMA flood zone
- X (unshaded)
- Chance of flooding over 30 yrs
- 0.2%
- Est. flood insurance / yr
- $507 – $1,088
Fire risk 3/10 · Minor
- Est. fire insurance / yr
- $1,222 – $2,270
Heat risk 9/10 · Severe
- Hot days now (above 112°F)
- 7 days/yr
- Hot days in 30 yrs
- 24 days/yr
Wind risk 9/10 · Severe
- Chance of severe wind over 30 yrs
- 99.0%
Air-quality risk 2/10 · Minimal
- Unhealthy air days now
- 2 days/yr
- Unhealthy air days in 30 yrs
- 2 days/yr
Risk factors via First Street. Map © Google.
Why this score? — see what drove the B grade
The composite is a weighted blend of 9 inputs, each scored 0–100. Each bar is that input's sub-score; the figure is the points it added to the 100-point composite (weight × sub-score).
- Cash flow +26.0/30.0
- ARV discount +15.0/15.0
- 1% rule +8.8/10.0
- DSCR +8.8/10.0
- Livability +3.7/5.0
- Schools +3.1/10.0
- Rent growth +2.5/5.0
- Condition / age +2.5/5.0
- Appreciation +0.7/10.0
$149,900
🖨 Deal sheet (PDF) 📄 Offer letter ✓ Due diligence
Listing remarks
Opportunity knocks in Lakewood Village Estates! This 3-bedroom, 2.5-bath home offers great bones, a smart layout, and tons of potential just minutes from Lake Houston. Featuring a brick front, covered entry, and a long-lasting metal roof, this home is ready for its next chapter. Inside, enjoy high ceilings, a cozy gas fireplace, and laminate flooring throughout the main living areas. The kitchen opens to a bright breakfast nook with bay windows and comes fully equipped with appliances. Upstairs, the primary suite offers vaulted ceilings, a sitting area, and a spacious ensuite bath with garden tub and separate shower, along with two additional bedrooms include ceiling fans and generous space
Key facts
- Laminate flooring
- Metal roof
- Brick front
Tags
Property features AI
Finance
- HOA & community: Neighborhood features include curbs and gutters
Exterior
- Parking: Attached 2-car garage; Driveway; Garage with garage door opener
- Security: Owned security system
- Utilities: Public water; Public sewer
- Home design: Residential property; Full ownership; Living area reported; Entry level rooms on first and second floors
- Construction: Built in 2003; Brick construction; Metal roof; Slab foundation
- Exterior features: Subdivision lot; Concrete road/driveway
Interior
- Kitchen: Dishwasher; Disposal; Gas oven; Gas range; Microwave
- Bedrooms: Primary bedroom on second level (16 x 13); Two additional bedrooms on second level (each 10 x 10); Total rooms: 10
- Flooring: Laminate; Plank; Vinyl
- Bathrooms: Two full bathrooms; One half bathroom; Second-level baths include: 10 x 5 and 8 x 9 (dimensions provided)
- Heating & cooling: Central heating (gas); Central electric air conditioning
- Interior features: Gas log fireplace (1); Bath in primary bedroom; Soaking tub; Separate shower; Tub/shower; Window treatments/window coverings; Ceiling fans; Kitchen/dining combo
- Laundry & utility: Washer hookup; Electric dryer hookup; Gas dryer hookup; Utility room on first level (5 x 7)
Neighborhood map
What this means for you Summary
Snapshot
- This is a 3-bed/2.5-bath single-family listed at $150k.
Deal economics
- At list price, monthly cash flow is $375 ($5k/yr) — positive.
- The deal already cash-flows at list — no discount required.
- Meets the 1% rule at list price ($2k rent vs $150k).
- Cap rate 9.3% vs local median 3.2% in Houston — top-decile yield for the area; either an underpriced asset or a hidden risk that comps aren't pricing in. Stress-test before assuming the spread holds.
Location & tenants
- Location reads 74/100 on livability (#184 in TX, #4,771 nationally) — a middle-class / working-renter tenant base. Strengths: amenities A+, cost of living A+, housing A+; Watch: crime F.
- Huffman ISD (rural): math 32% / reading 35% proficiency, ranked #500 of 826 in TX (top 60%) — families likely to look elsewhere, expect single-tenant / working-renter base with shorter leases.
- Zoned schools: Huffman Middle (math 36% / reading 32%, grade F, #892 of 1,662 statewide, top 55%, 907 students, 42% FRL); Hargrave H S (math 31% / reading 46%, grade F, #866 of 1,632 statewide, top 54%, 1,125 students, 36% FRL) — zoned schools at 39% FRL track the district average.
- Market conditions: 587 active listings in the ZIP; 6 comparable units currently listed for rent nearby; rentals lingering (median 45d on market — plan ~5-8 weeks vacancy on turnover, expect pricing pressure); 83% of comp listings sitting > 30 days — soft ceiling on asking rent; solid renter incomes; 29,883 units permitted in Harris County in 2024 (8,621 in 5+ unit buildings).
Forward outlook
- Local home prices are declining (-3.0%/yr); year-one equity from $1k of loan paydown is wiped out by about $4k of value loss. Plan a longer hold.
- Harris County population projected at +47% by 2050 — long-run rental-demand tailwind backs the buy-and-hold thesis.
- At projected returns (-3.0% appreciation + 3.0% rent growth), your $42k cash investment doubles in ~10 years — after that, you're playing with house money.
Negotiation context
- Only 9 days on market — expect competitive offers; lowballing is unlikely to land.
- 9 sale attempts since 20y ago with the ask held roughly flat each time — persistent listings suggest the price (not the market) is what's stuck; bring a comps-based counter.
Risks & watch-outs
- Watch-outs: property tax is 3.3% of price.
- Climate carrying-cost: severe wind risk, 99% chance of damaging wind over 30y; extreme-heat days projected 7→24/yr by 2055 (HVAC capex compounding) — expect insurance premiums to compound above CPI over the hold.
Questions for the listing agent
- Property tax is high relative to price — has the assessment been appealed recently, and will the sale trigger a re-assessment?
- Is there a deadline driving the sale (1031 exchange, divorce, estate, relocation)? That informs how much negotiation room exists.
- Schools are D-rated, which usually means shorter tenancies and higher turnover. Who's the typical renter profile here, and what's been the actual vacancy rate?
- Crime grade is F in this area — have there been break-ins, vandalism, or insurance claims at this property in the last 3 years? What carrier currently insures it and at what premium?
- What's the average days-on-market for RENTAL listings here right now (not sales)? A rising rental-DOM trend means longer vacancies and softer asking-rent achievability than the comps imply.
- What's the recent tenant-quality profile in this submarket — average credit score on applications, eviction rate, late-payment / NSF rate, and stable-employment percentage? A property-management company in the area should have these aggregated.
- How much new for-sale + rental construction is in the pipeline within 1–3 miles? Heavy new supply typically softens prices + rents 12–24 months out; constrained supply supports both.
Investment metrics
- 1% rule
- 1.38% ✓
- Cap rate
- 9.30%
- Cash-on-cash
- 10.73%
- DSCR
- 1.48
- GRM
- 6.0
CMA / ARV
- ARV (on-the-fly)
- $238,944
- Comps found
- 12
Show comp detail 12 sales within ~0.75 mi
| Address | Dist | Beds/Ba | Sqft | Sold | Price | $/sf | Match |
|---|---|---|---|---|---|---|---|
| 24712 Stablewood Forest Ct | 0.50mi | 3/2.5 | 1,556 (-1%) | 0mo | $180,000 | $116 | 75 |
| 24034 E Lake Houston Pkwy | 0.41mi | 3/2.0 | 1,558 (-1%) | 4mo | $255,999 | $164 | 74 |
| 513 Emerald Thicket Ln | 0.47mi | 3/2.5 | 1,647 (+5%) | 1mo | $249,990 | $152 | 69 |
| 723 Pas Trl | 0.12mi | 3/2.0 | 1,365 (-13%) | 4mo | $220,000 | $161 | 67 |
| 24705 Sonora Crescent Cir | 0.44mi | 3/2.0 | 1,689 (+7%) | 3mo | $288,990 | $171 | 63 |
| 24402 Lightwoods Dr | 0.63mi | 3/2.0 | 1,607 (+2%) | 3mo | $254,900 | $159 | 63 |
| 331 Cherry Valley Dr | 0.56mi | 3/2.0 | 1,495 (-5%) | 2mo | $185,000 | $124 | 62 |
| 24414 Whitesail Dr | 0.56mi | 3/2.0 | 1,663 (+6%) | 3mo | $193,200 | $116 | 60 |
| 24702 Stablewood Frst | 0.50mi | 3/3.0 | 1,774 (+13%) | 2mo | $254,990 | $144 | 52 |
| 24506 Fir Ridge Ct | 0.59mi | 3/2.5 | 1,351 (-14%) | 1mo | $165,600 | $123 | 48 |
| 304 Emerald Thicket Ln | 0.69mi | 3/2.0 | 1,427 (-9%) | 5mo | $224,990 | $158 | 46 |
| 24702 Windward Birch Ln | 0.72mi | 3/3.0 | 1,774 (+13%) | 2mo | $254,990 | $144 | 41 |
Match score weights: distance 35% · size 25% · config 20% · recency 20%. Top-matched comps best support the ARV.
Projected returns pro-forma
-3.0% appreciation · 3.0% rent growth · sell at horizon
- IRR
- -0.1%
- Equity multiple
- 0.99×
- Total profit
- $-226
- Equity at exit
- $22,351
- IRR
- 9.6%
- Equity multiple
- 1.74×
- Total profit
- $31,260
- Equity at exit
- $12,961
Cash invested: $41,972 (down + closing). Projections, not guarantees.
Landlord ↔ Tenant lean methodology
- Overall (STATE)
- 87 Strongly Landlord-Friendly
- State Texas
- 87 Strongly Landlord-Friendly · R+5
- County
- — inherits STATE
- City
- — inherits STATE
ZIP-level market 77336
- Home prices YoY
- -1.8%
- Active inventory
- 587
- Price-to-rent
- 6.0×
Monthly cashflow live
- Estimated rent
- $2,071 high interval (Pro) →
- Mortgage (P&I)
- −$786
- Tax from tax record
- −$413 /mo · $4,950/yr
- Insurance
- −$62
- HOA
- −$0
- Vacancy / Maint / Mgmt
- −$435
- Net cashflow
- $375
Break-even live
Sensitivity live
| Price | -10% $460 | -5% $418 | +0% $375 | +5% $333 | +10% $290 |
|---|---|---|---|---|---|
| Rent | -10% $212 | -5% $293 | +0% $375 | +5% $457 | +10% $539 |
| Rate | -1.0pp $451 | -0.5pp $413 | base $375 | +0.5pp $336 | +1.0pp $297 |
UW: 25.0% down · 7.5% · 30yr · 1.5% tax · 5.0% vac · 8.0% maint · 8.0% mgmt
Financing live
Cash to close
- Down payment
- $37,475
- Closing costs
- $4,497
- Reserves months
- —
- Total cash needed
- —
Loan-product check · same deal, 3 products live
Conventional
25% down · 7.5% · 30yr
- Down + closing
- —
- Monthly P&I
- —
- Monthly cashflow
- —
- DSCR
- —
- Eligible?
- —
Personal DTI + credit; lowest rate.
DSCR
20% down · 8.5% · 30yr
- Down + closing
- —
- Monthly P&I
- —
- Monthly cashflow
- —
- DSCR
- —
- Eligible?
- —
No personal income docs; deal must DSCR.
Hard money
10% down · 12.0% · 12mo
- Down + closing
- —
- Monthly P&I
- —
- Monthly cashflow
- —
- DSCR
- —
- Eligible?
- —
Short-term bridge; refi at stabilization.
Rent comps 6 comps
| Address | Beds | Baths | Sqft | Rent | $/sqft | DOM | Units | Dist |
|---|---|---|---|---|---|---|---|---|
| 24719 Colony Meadow Trl Huffman, TX | 4.0 | 2.0 | 1613 | $2,200 | $1.36 | 44d | 1 | 0.30mi |
| 24730 Russet Bluff Trl Huffman, TX | 4.0 | 2.0 | 1604 | $2,150 | $1.34 | 0d | 1 | 0.31mi |
| 24118 Grey Fox Dr Huffman, TX | 3.0 | 2.0 | 1543 | $1,425 | $0.92 | 44d | 1 | 0.35mi |
| 408 Emerald Thicket Ln Huffman, TX | 3.0 | 2.5 | 1755 | $2,200 | $1.25 | 44d | 1 | 0.56mi |
| 24523 Whitesail Dr Huffman, TX | 3.0 | 2.0 | 1512 | $1,800 | $1.19 | 44d | 1 | 0.69mi |
| 24527 Lightwoods Dr Huffman, TX | 4.0 | 2.0 | 2095 | $2,100 | $1.00 | 44d | 1 | 0.81mi |
Listing history 29 events
-
2026-04-17status Pending
-
2026-04-14historical $1,875
-
2026-04-08$149,900 Active
-
2026-02-09$1,875
-
2024-02-23historical $1,750
-
2024-01-07$1,750
-
2024-01-06historical
-
2023-10-16price $235,000
-
2023-10-06$245,000 Active
-
2023-10-05historical
-
2023-08-17price $248,000
-
2023-08-11status Active
-
2023-08-04status Option Pending
-
2023-07-21$255,000 Active
-
2022-01-12soldstatus
-
2022-01-07soldstatus Sold
-
2021-11-27status Pending
-
2021-11-18status Option Pending
-
2021-11-02$219,900 Active
-
2015-10-15soldstatus Sold
-
2015-09-24status Pending
-
2015-09-12status Option Pending
-
2015-09-06$134,900 Active
-
2006-05-26historical
-
2006-04-29$117,500
-
2004-09-17soldstatus
-
2003-12-23soldstatus
-
2003-11-10soldstatus
-
1999-11-10soldstatus
ⓘ Source: listings_history table (triggers on properties + properties_extension) + one-shot
backfill from property_details.listing_events for pre-trigger history.
Tax reassessment forecast TX · Resets to sale price
- Current annual tax
- $4,950 · $413/mo
- Projected year-2 tax
- $4,950 · $413/mo
- Expected delta
- $0/yr ($0/mo · 0.0%)
ⓘ Screening estimate from a state-policy table — verify with the county assessor before closing.
Climate risk First Street
- Flood 4/10 Moderate FEMA zone X (unshaded) · 20% chance over 30 yrs
- Wildfire 3/10 Moderate
- Heat 9/10 Extreme 7 d/yr ≥112°F today · 24 d/yr by 30 yrs out
- Wind 9/10 Extreme 99% chance of damaging wind over 30 yrs
- Air quality 2/10 Low 2 unhealthy d/yr today · 2 by 30 yrs out
Nearby sold comps map
Loading sold comps map…
Walkable amenities ~0.75 mi
Loading nearby amenities…
Taxation est. · year 1
- Rental income
- $24,854
- − Mortgage interest
- −$8,397
- − Property taxes
- −$4,950
- − Insurance
- −$750
- − Repairs & maintenance
- −$1,988
- − Management
- −$1,988
- − Depreciation
- −$4,361
- Taxable income
- $2,420
- Est. tax owed @ 24.0%
- −$581
- After-tax cash flow
- $3,921/yr
For passive investors: Depreciation is non-cash, so a rental often shows a tax loss while cash-flowing — sheltering income. Rental losses are passive: they offset passive income freely, and up to $25,000/yr can offset ordinary (W-2) income if you actively participate and your MAGI is under $100k (phasing out to $0 by $150k); unused losses carry forward. On sale, claimed depreciation is recaptured at up to 25%, and gains may owe capital-gains tax (a 1031 exchange can defer both). Figures are a year-1 estimate at your 24.0% rate — not tax advice; consult a CPA.
Schools (NCES district)
- District
- Huffman ISD
- NCES district ID
- 4823820
- Math proficiency
- 32% ▼ -9.00%
- Reading proficiency
- 35% ▼ -9.00%
- Median HH income
- $65,848
- Composite
- 30.61/100
- National rank
- #6195
- State rank
- #500 of 826 in TX
Livability — Houston
- Score
- 74/100
- State rank
- #184
- US rank
- #4771
Category grades
Schools grade is shown separately in the Schools card above.
Census & demographics
- Census place
- Houston, TX
- County
- Harris County · 4,702,590 people
- City population
- 3,226,434
- Metro
- Houston-The Woodlands-Sugar Land, TX
- Population (ZIP)
- 14,342
- Household income
- $96,404
- Rent vs Own
- Severe rent burden
- 377.0
Population outlook (Harris County) Hauer SSP2
- Today (2025)
- 5,571,493 people
- By 2030
- 6,089,821 · +9.3%
- By 2040
- 7,142,806 · +28.2%
- By 2050
- 8,185,864 · +46.9%
- By 2075
- 10,574,329 · +89.8%
- By 2100
- 12,109,958 · +117.4%
Race, ethnicity, and origin ACS 2023
- Neighborhood character
- Majority White (65%)
- Race & ethnicity
- White 65% Hispanic / Latino 23% Two or more races 9% Black 5% Native American 4%
- Hispanic origin (detail)
- Mexican 20%
- Common ancestry
- Lithuanian 4% Slovak 2% Romanian 2%
- Foreign-born
- 9% · Canada
- Languages at home
- 79% English-only · Spanish 18% Other Indo-European 2%
Political lean MEDSL · Harris
- 2024 margin
- Lean D (+5.5) · D 52.0% · R 46.4% · Other 1.6%
- 2008→2024 swing
- +3.9pp toward D · 2008: 1.6pp · 2024: 5.5pp
- All cycles
- 2024: D+5.5 2020: D+13.3 2016: D+12.4 2012: D+0.1 2008: D+1.6
Not yet ingested
- Civics
- —
Market trends
- HPI YoY
- ▼ -8.59%
- Current HPI
- 472.03
- Rent YoY
- —
- Metro
- Houston-The Woodlands-Sugar Land, TX
- State GDP YoY
- ▲ 3.95%
- F500 in state
- 110
Industry mix (Fortune 500 HQ in TX)
| Industry | F500 HQs | Revenue |
|---|---|---|
| Energy | 16 | $1,198B |
|
||
| Technology | 5 | $198B |
|
||
| Engineering / Construction | 4 | $72B |
|
||
| Energy Services | 3 | $60B |
|
||
| Utilities | 3 | $41B |
|
||
| Healthcare | 2 | $330B |
|
||
Price history
-98.4% since first listed29 events — show timeline
- 2026-04-17 Pending — HARMLS
- 2026-04-14 Rental Removed $1,875 HARMLS
- 2026-04-08 Listed $149,900 HARMLS
- 2026-02-09 Listed for Rent $1,875 HARMLS
- 2024-02-23 Rental Removed $1,750 HARMLS
- 2024-01-07 Listed for Rent $1,750 HARMLS
- 2024-01-06 Listing Removed — HARMLS
- 2023-10-16 Price Changed $235,000 HARMLS
- 2023-10-06 Listed $245,000 HARMLS
- 2023-10-05 Listing Removed — HARMLS
- 2023-08-17 Price Changed $248,000 HARMLS
- 2023-08-11 Relisted — HARMLS
- 2023-08-04 Pending — HARMLS
- 2023-07-21 Listed $255,000 HARMLS
- 2022-01-12 Sold (Public Records) — Public Records
- 2022-01-07 Sold (MLS) — HARMLS
- 2021-11-27 Pending — HARMLS
- 2021-11-18 Pending — HARMLS
- 2021-11-02 Listed $219,900 HARMLS
- 2015-10-15 Sold (MLS) — HARMLS
- 2015-09-24 Pending — HARMLS
- 2015-09-12 Pending — HARMLS
- 2015-09-06 Listed $134,900 HARMLS
- 2006-05-26 Listing Removed — HARMLS
- 2006-04-29 Listed $117,500 HARMLS
- 2004-09-17 Sold (Public Records) — Public Records
- 2003-12-23 Sold (Public Records) — Public Records
- 2003-11-10 Sold (Public Records) — Public Records
- 1999-11-10 Sold (Public Records) — Public Records
Property tax history
+7.1%/yrLatest (2025): $4,950 · +10.5% YoY. Source: county tax records.
Cash-flow waterfall
monthlySold comps — $/sqft
last 12 mo · ≤1 miLoading sold comps…