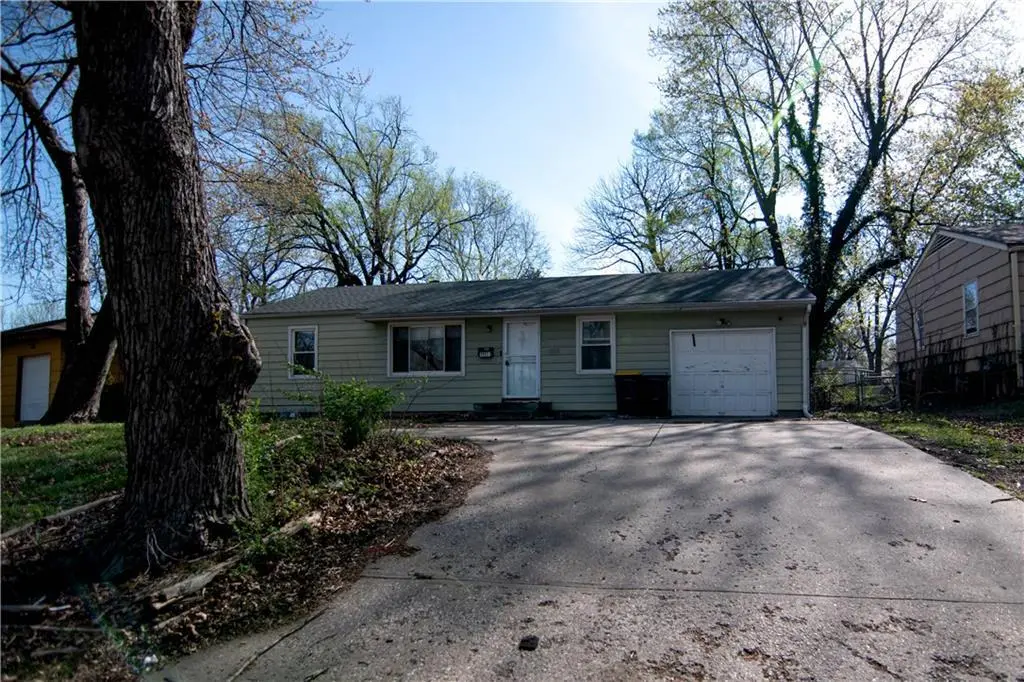
9903 Wheeling St · Kansas City, MO
Flood risk 1/10 · Minimal
- FEMA flood zone
- X (unshaded)
- Chance of flooding over 30 yrs
- 0.0%
- Est. flood insurance / yr
- $473 – $860
Fire risk 1/10 · Minimal
- Est. fire insurance / yr
- $1,054 – $1,958
Heat risk 4/10 · Minor
- Hot days now (above 106°F)
- 7 days/yr
- Hot days in 30 yrs
- 16 days/yr
Wind risk 2/10 · Minimal
- Chance of severe wind over 30 yrs
- —
Air-quality risk 3/10 · Minor
- Unhealthy air days now
- 3 days/yr
- Unhealthy air days in 30 yrs
- 3 days/yr
Risk factors via First Street. Map © Google.
Why this score? — see what drove the B grade
The composite is a weighted blend of 9 inputs, each scored 0–100. Each bar is that input's sub-score; the figure is the points it added to the 100-point composite (weight × sub-score).
- Cash flow +28.5/30.0
- ARV discount +15.0/15.0
- DSCR +10.0/10.0
- 1% rule +7.6/10.0
- Rent growth +4.2/5.0
- Livability +3.9/5.0
- Condition / age +2.5/5.0
- Schools +1.1/10.0
- Appreciation +0.0/10.0
$130,000
🖨 Deal sheet (PDF) 📄 Offer letter ✓ Due diligence
Listing remarks MLS
Super Buy On This 3 Bdrm With Full Bsmnt, Siding Etc Etc Needs Some Tlc From 99th And Blue Ridge Go West To Wheeling Then South To House
Key facts
- 8,712 sq ft lot
- Garage
- Built 1956
Property features AI
Finance
- Financial info: Annual property tax reported
Exterior
- Parking: Attached garage facing front; 1 garage space; Basement access to parking
- Utilities: Public water; Public sewer; Metro Free telecom service
- Home design: Single-family ranch-style residence; One story; Inside city limits
- Construction: Concrete and metal siding construction; Composition roof; Full concrete basement
- Exterior features: Metal fencing; City lot; Lot dimensions approximately 65 x 135
Interior
- Kitchen: Kitchen on the first floor
- Bedrooms: 3 bedrooms (all on the first floor)
- Flooring: Carpet; Wood
- Bathrooms: 1 full bathroom; 1 half bathroom
- Heating & cooling: Forced air heating; Electric cooling
- Interior features: Ceiling fans; Window coverings; Thermal windows; Two fireplaces
- Laundry & utility: Basement with inside entrance
Neighborhood map
What this means for you Summary
Snapshot
- This is a 4-bed/1.5-bath single-family listed at $130k.
Deal economics
- At list price, monthly cash flow is $426 ($5k/yr) — positive.
- The deal already cash-flows at list — no discount required.
- Meets the 1% rule at list price ($2k rent vs $130k).
- Cap rate 10.2% vs local median 3.9% in Kansas City — top-decile yield for the area; either an underpriced asset or a hidden risk that comps aren't pricing in. Stress-test before assuming the spread holds.
Location & tenants
- Location reads 78/100 on livability (#28 in MO, #2,671 nationally) — a middle-class / working-renter tenant base. Strengths: amenities A+, commute A+, cost of living A+; Watch: crime F.
- Hickman Mills C-1 (urban): math 8% / reading 18% proficiency, ranked #314 of 324 in MO (top 97%) — low school quality limits family demand, transient renter base, plan for 1-2y turnover; 78% free/reduced lunch — lower-income household profile, screen leases tightly.
- Zoned schools: Ervin Elementary School (math 8% / reading 12%, grade F, #1,037 of 1,115 statewide, top 94%, 629 students, 100% FRL); Smith-Hale Middle (math 7% / reading 19%, grade F, #368 of 391 statewide, top 94%, 770 students, 100% FRL); Ruskin High School (math 8% / reading 47%, grade F, #416 of 521 statewide, top 80%, 1,273 students, 100% FRL) — zoned schools average 100% FRL vs 78% district-wide (22 pts higher); higher-poverty schools than district average — tighter screening recommended.
- Market conditions: Rents rising fast (+6.7%/yr); 147 active listings in the ZIP; 26 comparable units currently listed for rent nearby; rentals at typical pace (median 25d on market — plan ~3-4 weeks tenant-placement turnaround); 4,002 units permitted in Jackson County in 2024 (2,271 in 5+ unit buildings).
- This rent runs 34% of the median local income ($58k/yr) — at the standard rent-burdened threshold; future hikes will face affordability resistance.
Forward outlook
- Local home prices are declining (-3.0%/yr); year-one equity from $899 of loan paydown is wiped out by about $4k of value loss. Plan a longer hold.
- Jackson County population projected at +4% by 2050 — modest demand growth; plan on rents tracking national, not racing it.
- At projected returns (-3.0% appreciation + 6.7% rent growth), your $36k cash investment doubles in ~7 years — after that, you're playing with house money.
Negotiation context
- Only 7 days on market — expect competitive offers; lowballing is unlikely to land.
- 3 sale attempts since 29y ago with the ask held roughly flat each time — persistent listings suggest the price (not the market) is what's stuck; bring a comps-based counter.
- Current owner paid $43k; list at $130k implies a 204% gain — meaningful room to come down on a strong offer.
Risks & watch-outs
- Watch-outs: built in 1956 — expect roof / HVAC / electrical / plumbing capex.
Questions for the listing agent
- Built in 1956 — when were the roof, HVAC, electrical panel, plumbing, and water heater last replaced?
- Is there a deadline driving the sale (1031 exchange, divorce, estate, relocation)? That informs how much negotiation room exists.
- Crime grade is F in this area — have there been break-ins, vandalism, or insurance claims at this property in the last 3 years? What carrier currently insures it and at what premium?
- What's the average days-on-market for RENTAL listings here right now (not sales)? A rising rental-DOM trend means longer vacancies and softer asking-rent achievability than the comps imply.
- What's the recent tenant-quality profile in this submarket — average credit score on applications, eviction rate, late-payment / NSF rate, and stable-employment percentage? A property-management company in the area should have these aggregated.
- How much new for-sale + rental construction is in the pipeline within 1–3 miles? Heavy new supply typically softens prices + rents 12–24 months out; constrained supply supports both.
Investment metrics
- 1% rule
- 1.26% ✓
- Cap rate
- 10.23%
- Cash-on-cash
- 14.05%
- DSCR
- 1.63
- GRM
- 6.6
CMA / ARV
- ARV (on-the-fly)
- $213,408
- Comps found
- 12
Show comp detail 12 sales within ~0.75 mi
| Address | Dist | Beds/Ba | Sqft | Sold | Price | $/sf | Match |
|---|---|---|---|---|---|---|---|
| 9903 Wheeling St | 0.00mi | 3/1.5 (-1) | 1,368 (0%) | 1mo | $130,000 | $95 | 94 |
| 5904 E 100th St | 0.16mi | 3/1.0 (-1) | 1,344 (-2%) | 1mo | $210,000 | $156 | 82 |
| 10013 Belmont Ave | 0.20mi | 4/2.0 | 1,296 (-5%) | 5mo | $204,900 | $158 | 76 |
| 9629 Beacon Ave | 0.23mi | 3/2.0 (-1) | 1,440 (+5%) | 4mo | $195,000 | $135 | 70 |
| 10200 Fremont Ave | 0.41mi | 3/1.5 (-1) | 1,392 (+2%) | 4mo | $179,000 | $129 | 70 |
| 6302 Fairlane Dr | 0.36mi | 4/2.0 | 1,242 (-9%) | 3mo | $225,000 | $181 | 64 |
| 10008 Hardesty Ave | 0.49mi | 3/1.0 (-1) | 1,296 (-5%) | 2mo | $160,000 | $123 | 60 |
| 10200 Blue Ridge Blvd | 0.60mi | 3/2.5 (-1) | 1,403 (+3%) | 1mo | $189,900 | $135 | 58 |
| 6706 E 98th St | 0.42mi | 3/2.0 (-1) | 1,558 (+14%) | 3mo | $195,000 | $125 | 48 |
| 9810 Hardesty Ave | 0.48mi | 3/2.5 (-1) | 1,544 (+13%) | 1mo | $249,900 | $162 | 46 |
| 6815 E 99th Ter | 0.46mi | 3/2.5 (-1) | 1,557 (+14%) | 1mo | $250,000 | $161 | 46 |
| 6309 E 102nd Ter | 0.44mi | 3/2.0 (-1) | 1,558 (+14%) | 4mo | $290,000 | $186 | 46 |
Match score weights: distance 35% · size 25% · config 20% · recency 20%. Top-matched comps best support the ARV.
Projected returns pro-forma
-3.0% appreciation · 6.73% rent growth · sell at horizon
- IRR
- 8.4%
- Equity multiple
- 1.34×
- Total profit
- $12,455
- Equity at exit
- $19,383
- IRR
- 20.5%
- Equity multiple
- 3.03×
- Total profit
- $74,049
- Equity at exit
- $11,240
Cash invested: $36,400 (down + closing). Projections, not guarantees.
Landlord ↔ Tenant lean methodology
- Overall (STATE)
- 81 Strongly Landlord-Friendly
- State Missouri
- 81 Strongly Landlord-Friendly · R+10
- County
- — inherits STATE
- City
- — inherits STATE
ZIP-level market 64134
- Rents YoY
- 6.7%
- Active inventory
- 147
- Price-to-rent
- 6.6×
Monthly cashflow live
- Estimated rent
- $1,636 high interval (Pro) →
- Mortgage (P&I)
- −$682
- Tax from tax record
- −$130 /mo · $1,566/yr
- Insurance
- −$54
- HOA
- −$0
- Vacancy / Maint / Mgmt
- −$344
- Net cashflow
- $426
Break-even live
Sensitivity live
| Price | -10% $500 | -5% $463 | +0% $426 | +5% $389 | +10% $353 |
|---|---|---|---|---|---|
| Rent | -10% $297 | -5% $362 | +0% $426 | +5% $491 | +10% $555 |
| Rate | -1.0pp $492 | -0.5pp $459 | base $426 | +0.5pp $393 | +1.0pp $358 |
UW: 25.0% down · 7.5% · 30yr · 1.5% tax · 5.0% vac · 8.0% maint · 8.0% mgmt
Financing live
Cash to close
- Down payment
- $32,500
- Closing costs
- $3,900
- Reserves months
- —
- Total cash needed
- —
Loan-product check · same deal, 3 products live
Conventional
25% down · 7.5% · 30yr
- Down + closing
- —
- Monthly P&I
- —
- Monthly cashflow
- —
- DSCR
- —
- Eligible?
- —
Personal DTI + credit; lowest rate.
DSCR
20% down · 8.5% · 30yr
- Down + closing
- —
- Monthly P&I
- —
- Monthly cashflow
- —
- DSCR
- —
- Eligible?
- —
No personal income docs; deal must DSCR.
Hard money
10% down · 12.0% · 12mo
- Down + closing
- —
- Monthly P&I
- —
- Monthly cashflow
- —
- DSCR
- —
- Eligible?
- —
Short-term bridge; refi at stabilization.
Rent comps 26 comps
| Address | Beds | Baths | Sqft | Rent | $/sqft | DOM | Units | Dist |
|---|---|---|---|---|---|---|---|---|
| 9909 Wheeling Ave Kansas City, MO | 3.0 | 1.0 | 1208 | $1,350 | $1.12 | 17d | 1 | 0.03mi |
| 10002 Wheeling Ave Kansas City, MO | 3.0 | 1.0 | 1572 | $1,445 | $0.92 | 17d | 1 | 0.12mi |
| 5906 E 99th Ter Kansas City, MO | 3.0 | 1.0 | 912 | $1,399 | $1.53 | 21d | 1 | 0.12mi |
| 5907 E 101st St Kansas City, MO | 3.0 | 1.0 | 912 | $1,595 | $1.75 | 17d | 1 | 0.25mi |
| 5907 E 101st St Kansas City, MO | 3.0 | 1.0 | 912 | $1,595 | $1.75 | 4d | 1 | 0.25mi |
| 10000 Bennington Ave Kansas City, MO | 4.0 | 2.5 | 1032 | $1,550 | $1.50 | 45d | 1 | 0.28mi |
| 5706 E 101st St Kansas City, MO | 3.0 | 1.0 | 912 | $1,475 | $1.62 | 17d | 1 | 0.33mi |
| 9807 Drury Ave Kansas City, MO | 3.0 | 2.0 | 1308 | $1,711 | $1.31 | 17d | 1 | 0.44mi |
| 10211 Bellaire Ave Kansas City, MO | 4.0 | 2.0 | 1200 | $2,200 | $1.83 | 3d | 1 | 0.45mi |
| 5608 E 101st Ter Kansas City, MO | 3.0 | 1.0 | 900 | $1,500 | $1.67 | 21d | 1 | 0.46mi |
| 10712 Bennington Ave Kansas City, MO | 3.0 | 1.0 | 912 | $1,395 | $1.53 | 17d | 1 | 1.10mi |
| 10401 Richmond Ave Kansas City, MO | 3.0 | 1.0 | 1000 | $1,350 | $1.35 | 25d | 1 | 1.12mi |
| 10716 Ewing Ave Kansas City, MO | 4.0 | 2.0 | 1032 | $1,550 | $1.50 | 45d | 1 | 1.14mi |
| 9302 Fairwood Dr Kansas City, MO | 3.0 | 1.0 | 1526 | $1,585 | $1.04 | 25d | 1 | 1.21mi |
| 10408 Smalley Ct Kansas City, MO | 3.0 | 1.5 | 1500 | $1,599 | $1.07 | 25d | 1 | 1.25mi |
| 10607 Richmond Ave Kansas City, MO | 3.0 | 1.0 | 912 | $1,499 | $1.64 | 17d | 1 | 1.28mi |
| 5705 E 109th Ter Kansas City, MO | 3.0 | 1.0 | 1545 | $1,395 | $0.90 | 45d | 1 | 1.29mi |
| 9811 Marsh Ave Kansas City, MO | 3.0 | 1.0 | 912 | $1,295 | $1.42 | 45d | 1 | 1.35mi |
| 9727 Marsh Ave Kansas City, MO | 3.0 | 1.0 | 1271 | $1,706 | $1.34 | 45d | 1 | 1.35mi |
| 10906 Ewing Ave Kansas City, MO | 5.0 | 1.0 | 960 | $1,600 | $1.67 | 45d | 1 | 1.37mi |
| 8407 E 98th Ter Kansas City, MO | 3.0 | 1.0 | 940 | $1,395 | $1.48 | 25d | 1 | 1.43mi |
| 8407 E 98th Ter Kansas City, MO | 3.0 | 1.0 | 940 | $1,395 | $1.48 | 17d | 1 | 1.43mi |
| 7800 E 91st St Kansas City, MO | 3.0 | 3.0 | 1747 | $1,895 | $1.08 | 45d | 1 | 1.45mi |
| 9809 Wallace Ave Kansas City, MO | 3.0 | 1.0 | 956 | $1,500 | $1.57 | 25d | 1 | 1.46mi |
| 8300 E 104th Ter Kansas City, MO | 3.0 | 1.0 | 1204 | $1,400 | $1.16 | 14d | 1 | 1.47mi |
| 8300 E 104th Ter Kansas City, MO | 3.0 | 1.0 | 1204 | $1,450 | $1.20 | 25d | 1 | 1.48mi |
Listing history 11 events
-
2026-04-30status Pending
-
2026-04-24$130,000 Active
-
2026-04-19historical $130,000
-
2026-04-13historical $1,375
-
2026-03-26$1,375
-
2018-01-24soldstatus
-
2017-10-10soldstatus
-
1997-10-02soldstatus 137-char remark
Show marketing remark (137 chars)
Super Buy On This 3 Bdrm With Full Bsmnt, Siding Etc Etc Needs Some Tlc From 99th And Blue Ridge Go West To Wheeling Then South To House
-
1997-08-18soldstatus $42,727
-
1997-04-16$45,500 137-char remark
Show marketing remark (137 chars)
Super Buy On This 3 Bdrm With Full Bsmnt, Siding Etc Etc Needs Some Tlc From 99th And Blue Ridge Go West To Wheeling Then South To House
-
1965-09-01soldstatus
ⓘ Source: listings_history table (triggers on properties + properties_extension) + one-shot
backfill from property_details.listing_events for pre-trigger history.
Tax reassessment forecast MO · Resets to sale price
- Current annual tax
- $1,566 · $130/mo
- Projected year-2 tax
- $1,566 · $130/mo
- Expected delta
- $0/yr ($0/mo · 0.0%)
ⓘ Screening estimate from a state-policy table — verify with the county assessor before closing.
Climate risk First Street
- Flood 1/10 Low FEMA zone X (unshaded) · 0% chance over 30 yrs
- Wildfire 1/10 Low
- Heat 4/10 Moderate 7 d/yr ≥106°F today · 16 d/yr by 30 yrs out
- Wind 2/10 Low
- Air quality 3/10 Moderate 3 unhealthy d/yr today · 3 by 30 yrs out
Nearby sold comps map
Loading sold comps map…
Walkable amenities ~0.75 mi
Loading nearby amenities…
Taxation est. · year 1
- Rental income
- $19,634
- − Mortgage interest
- −$7,282
- − Property taxes
- −$1,566
- − Insurance
- −$650
- − Repairs & maintenance
- −$1,571
- − Management
- −$1,571
- − Depreciation
- −$3,782
- Taxable income
- $3,213
- Est. tax owed @ 24.0%
- −$771
- After-tax cash flow
- $4,343/yr
For passive investors: Depreciation is non-cash, so a rental often shows a tax loss while cash-flowing — sheltering income. Rental losses are passive: they offset passive income freely, and up to $25,000/yr can offset ordinary (W-2) income if you actively participate and your MAGI is under $100k (phasing out to $0 by $150k); unused losses carry forward. On sale, claimed depreciation is recaptured at up to 25%, and gains may owe capital-gains tax (a 1031 exchange can defer both). Figures are a year-1 estimate at your 24.0% rate — not tax advice; consult a CPA.
Schools (NCES district)
- District
- Hickman Mills C-1
- NCES district ID
- 2914340
- Math proficiency
- 8% ▼ -8.00%
- Reading proficiency
- 18% ▼ -4.00%
- Median HH income
- $40,908
- Composite
- 11.2/100
- National rank
- #9725
- State rank
- #314 of 324 in MO
Livability — Kansas City
- Score
- 78/100
- State rank
- #28
- US rank
- #2671
Category grades
Schools grade is shown separately in the Schools card above.
Census & demographics
- Census place
- Kansas City, MO
- County
- Jackson County · 687,798 people
- City population
- 439,467
- Metro
- Kansas City, MO-KS
- Population (ZIP)
- 22,964
- Household income
- $58,170
- Rent vs Own
- Severe rent burden
- 718.0
Population outlook (Jackson County) Hauer SSP2
- Today (2025)
- 719,589 people
- By 2030
- 731,456 · +1.6%
- By 2040
- 746,689 · +3.8%
- By 2050
- 749,289 · +4.1%
- By 2075
- 736,227 · +2.3%
- By 2100
- 668,210 · -7.1%
Race, ethnicity, and origin ACS 2023
- Neighborhood character
- Diverse neighborhood (Simpson 0.58)
- Race & ethnicity
- Black 58% White 28% Hispanic / Latino 10% Two or more races 6%
- Hispanic origin (detail)
- Mexican 6%
- Common ancestry
- Italian 2% Lithuanian 1% Romanian 1%
- Foreign-born
- 4% · Canada
- Languages at home
- 93% English-only · Spanish 5% Arabic 1%
Political lean MEDSL · Jackson
- 2024 margin
- D (+19.3) · D 58.9% · R 39.5% · Other 1.6%
- 2008→2024 swing
- -6.1pp toward R · 2008: 25.4pp · 2024: 19.3pp
- All cycles
- 2024: D+19.3 2020: D+22.0 2016: D+16.6 2012: D+19.0 2008: D+25.4
Not yet ingested
- Civics
- —
Market trends
- HPI YoY
- ▼ -157.94%
- Current HPI
- 277.895
- Rent YoY
- ▲ 6.73%
- Metro
- Kansas City, MO-KS
- State GDP YoY
- ▲ 1.84%
- F500 in state
- 20
Industry mix (Fortune 500 HQ in MO)
| Industry | F500 HQs | Revenue |
|---|---|---|
| Healthcare | 1 | $163B |
|
||
| Insurance | 1 | $21B |
|
||
| Industrial Technology | 1 | $17B |
|
||
| Retail | 1 | $16B |
|
||
| Industrial Distribution | 1 | $10B |
|
||
| Utilities | 1 | $9B |
|
||
Price history
+185.7% since first listed11 events — show timeline
- 2026-04-30 Pending — Heartland MLS as Distributed by MLS Grid
- 2026-04-24 Listed $130,000 Heartland MLS as Distributed by MLS Grid
- 2026-04-19 Coming Soon $130,000 Heartland MLS as Distributed by MLS Grid
- 2026-04-13 Rental Removed $1,375 SHOWMOJO
- 2026-03-26 Listed for Rent $1,375 SHOWMOJO
- 2018-01-24 Sold (Public Records) — Public Records
- 2017-10-10 Sold (Public Records) — Public Records
- 1997-10-02 Sold (MLS) — Heartland MLS as Distributed by MLS Grid
- 1997-08-18 Sold (Public Records) $42,727 Public Records
- 1997-04-16 Listed $45,500 Heartland MLS as Distributed by MLS Grid
- 1965-09-01 Sold (Public Records) — Public Records
Property tax history
+4.4%/yrLatest (2025): $1,566 · -29.6% YoY. Source: county tax records.
Cash-flow waterfall
monthlySold comps — $/sqft
last 12 mo · ≤1 miLoading sold comps…