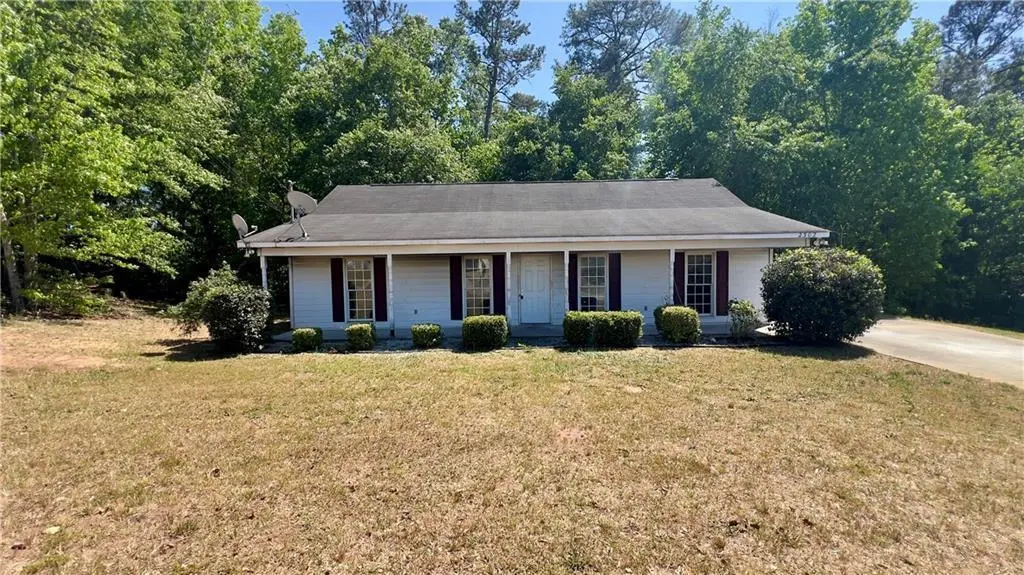
2302 Level Ct · Phenix City, AL
Flood risk 1/10 · Minimal
- FEMA flood zone
- X (unshaded)
- Chance of flooding over 30 yrs
- 0.0%
- Est. flood insurance / yr
- $507 – $1,088
Fire risk 4/10 · Minor
- Est. fire insurance / yr
- $916 – $1,700
Heat risk 7/10 · Major
- Hot days now (above 107°F)
- 7 days/yr
- Hot days in 30 yrs
- 19 days/yr
Wind risk 6/10 · Moderate
- Chance of severe wind over 30 yrs
- 76.0%
Air-quality risk 5/10 · Moderate
- Unhealthy air days now
- 7 days/yr
- Unhealthy air days in 30 yrs
- 8 days/yr
Risk factors via First Street. Map © Google.
Why this score? — see what drove the B+ grade
The composite is a weighted blend of 9 inputs, each scored 0–100. Each bar is that input's sub-score; the figure is the points it added to the 100-point composite (weight × sub-score).
- Cash flow +30.0/30.0
- ARV discount +15.0/15.0
- 1% rule +10.0/10.0
- DSCR +10.0/10.0
- Livability +3.0/5.0
- Schools +2.7/10.0
- Rent growth +2.6/5.0
- Condition / age +2.5/5.0
- Appreciation +0.0/10.0
$99,900
🖨 Deal sheet (PDF) 📄 Offer letter ✓ Due diligence
Listing remarks MLS
Single-story home with 3 bedrooms, 2 baths, on a cul-de-sac. The property has a split floor plan, a breakfast area in the kitchen, and a level driveway for parking. Located close to Phenix City shopping, schools, and restaurants,
Key facts
- Close to schools
- Split floor plan
- Level driveway
Tags
Property features AI
Finance
- HOA & community: No community amenities listed
Exterior
- Parking: Driveway
- Utilities: Public water; Public sewer; Electricity available; Cable available
- Home design: Single-family residence; One and one-half stories; Residential property in fixer condition; Vinyl siding
- Construction: Asbestos shingle roof
- Exterior features: Covered porch/patio; Has a view; No pool or spa; No fencing; No other exterior structures
Interior
- Bedrooms: 3 bedrooms on the main level
- Flooring: Other flooring
- Bathrooms: 2 full bathrooms (2 on the main level)
- Heating & cooling: Forced air heating; Attic fan cooling
- Interior features: Walk-in closets; No fireplace
- Laundry & utility: Separate laundry room
Neighborhood map
What this means for you Summary
Snapshot
- This is a 3-bed/1.0-bath single-family listed at $100k.
Deal economics
- At list price, monthly cash flow is $593 ($7k/yr) — positive.
- The deal already cash-flows at list — no discount required.
- Meets the 1% rule at list price ($2k rent vs $100k).
- Recommended offer: $98k (1.5% below list) — sets the bar for market timing.
- Cap rate 13.4% vs local median 4.9% in Phenix City — top-decile yield for the area; either an underpriced asset or a hidden risk that comps aren't pricing in. Stress-test before assuming the spread holds.
Location & tenants
- Location reads 60/100 on livability (#297 in AL) — a middle-class / working-renter tenant base. Strengths: cost of living A+, housing A+; Watch: crime F, amenities F, commute F.
- Phenix City (suburban): math 22% / reading 44% proficiency, ranked #59 of 129 in AL (top 46%) — families likely to look elsewhere, expect single-tenant / working-renter base with shorter leases; 64% free/reduced lunch — lower-income household profile, screen leases tightly.
- Zoned schools: Ridgecrest Elementary School (math 17% / reading 39%, grade F, #385 of 627 statewide, top 62%, 796 students, 89% FRL); Phenix City Intermediate School (math 18% / reading 41%, grade F, #129 of 257 statewide, top 52%, 1,044 students, 80% FRL); Central High School (math 26% / reading 21%, grade F, #139 of 305 statewide, top 45%, 1,495 students, 74% FRL) — zoned schools average 81% FRL vs 64% district-wide (17 pts higher); higher-poverty schools than district average — tighter screening recommended.
- Market conditions: Rents flat; 107 active listings in the ZIP; 4 comparable units currently listed for rent nearby; rentals at typical pace (median 15d on market — plan ~3-4 weeks tenant-placement turnaround); 183 units permitted in Russell County in 2024 (0 in 5+ unit buildings).
- This rent runs 39% of the median local income ($50k/yr) — at the standard rent-burdened threshold; future hikes will face affordability resistance.
Forward outlook
- Local home prices are declining (-3.0%/yr); year-one equity from $691 of loan paydown is wiped out by about $3k of value loss. Plan a longer hold.
- Russell County population projected at +42% by 2050 — long-run rental-demand tailwind backs the buy-and-hold thesis.
- At projected returns (-3.0% appreciation + 0.4% rent growth), your $28k cash investment doubles in ~6 years — after that, you're playing with house money.
Negotiation context
- It's been on market 19 days — a 2% lower offer ($98k) is reasonable based on typical stale-listing flexibility.
- 2 sale attempts with the ask held roughly flat each time — persistent listings suggest the price (not the market) is what's stuck; bring a comps-based counter.
Risks & watch-outs
- Climate carrying-cost: major wind risk, 76% chance of damaging wind over 30y; extreme-heat days projected 7→19/yr by 2055 (HVAC capex compounding) — expect insurance premiums to compound above CPI over the hold.
Questions for the listing agent
- Is there a deadline driving the sale (1031 exchange, divorce, estate, relocation)? That informs how much negotiation room exists.
- Schools are D-rated, which usually means shorter tenancies and higher turnover. Who's the typical renter profile here, and what's been the actual vacancy rate?
- Crime grade is F in this area — have there been break-ins, vandalism, or insurance claims at this property in the last 3 years? What carrier currently insures it and at what premium?
- What's the average days-on-market for RENTAL listings here right now (not sales)? A rising rental-DOM trend means longer vacancies and softer asking-rent achievability than the comps imply.
- What's the recent tenant-quality profile in this submarket — average credit score on applications, eviction rate, late-payment / NSF rate, and stable-employment percentage? A property-management company in the area should have these aggregated.
- How much new for-sale + rental construction is in the pipeline within 1–3 miles? Heavy new supply typically softens prices + rents 12–24 months out; constrained supply supports both.
Investment metrics
- 1% rule
- 1.62% ✓
- Cap rate
- 13.41%
- Cash-on-cash
- 25.42%
- DSCR
- 2.13
- GRM
- 5.1
CMA / ARV
- ARV (on-the-fly)
- $182,924
- Comps found
- 12
Show comp detail 12 sales within ~0.75 mi
| Address | Dist | Beds/Ba | Sqft | Sold | Price | $/sf | Match |
|---|---|---|---|---|---|---|---|
| 2302 Level Ct | 0.00mi | 3/2.0 | 1,316 (0%) | 1mo | $100,000 | $76 | 95 |
| 703 23rd Ave | 0.18mi | 2/2.0 (-1) | 1,363 (+4%) | 3mo | $140,000 | $103 | 74 |
| 640 Builder Dr | 0.21mi | 3/2.0 | 1,203 (-9%) | 4mo | $200,000 | $166 | 68 |
| 2314 Sandfort Rd | 0.24mi | 4/2.0 (+1) | 1,391 (+6%) | 5mo | $149,900 | $108 | 66 |
| 2304 Nail Ct | 0.09mi | 3/2.0 | 1,131 (-14%) | 6mo | $176,500 | $156 | 63 |
| 308 21st Ave | 0.38mi | 3/2.0 | 1,362 (+4%) | 12mo | $238,900 | $175 | 63 |
| 311 23rd Ct | 0.31mi | 3/2.0 | 1,163 (-12%) | 6mo | $195,000 | $168 | 58 |
| 9 Lexington Cir | 0.74mi | 3/2.0 | 1,292 (-2%) | 4mo | $178,500 | $138 | 55 |
| 202 26th Ct | 0.44mi | 4/2.0 (+1) | 1,382 (+5%) | 11mo | $192,000 | $139 | 53 |
| 701 Pine Hill Ct | 0.31mi | 3/2.0 | 1,131 (-14%) | 6mo | $120,000 | $106 | 53 |
| 105 Richburg St | 0.68mi | 4/2.0 (+1) | 1,225 (-7%) | 3mo | $219,900 | $180 | 45 |
| 1908 Knowles Rd | 0.73mi | 4/1.5 (+1) | 1,250 (-5%) | 7mo | $148,500 | $119 | 45 |
Match score weights: distance 35% · size 25% · config 20% · recency 20%. Top-matched comps best support the ARV.
Projected returns pro-forma
-3.0% appreciation · 0.43% rent growth · sell at horizon
- IRR
- 16.1%
- Equity multiple
- 1.63×
- Total profit
- $17,492
- Equity at exit
- $14,895
- IRR
- 22.7%
- Equity multiple
- 2.72×
- Total profit
- $48,012
- Equity at exit
- $8,638
Cash invested: $27,972 (down + closing). Projections, not guarantees.
Landlord ↔ Tenant lean methodology
- Overall (STATE)
- 90 Strongly Landlord-Friendly
- State Alabama
- 90 Strongly Landlord-Friendly · R+15
- County
- — inherits STATE
- City
- — inherits STATE
ZIP-level market 36869
- Home prices YoY
- -22.2%
- Rents YoY
- 0.4%
- Active inventory
- 107
- Price-to-rent
- 5.1×
Monthly cashflow live
- Estimated rent
- $1,618 medium interval (Pro) →
- Mortgage (P&I)
- −$524
- Tax from tax record
- −$120 /mo · $1,446/yr
- Insurance
- −$42
- HOA
- −$0
- Vacancy / Maint / Mgmt
- −$340
- Net cashflow
- $593
Break-even live
Sensitivity live
| Price | -10% $649 | -5% $621 | +0% $593 | +5% $564 | +10% $536 |
|---|---|---|---|---|---|
| Rent | -10% $465 | -5% $529 | +0% $593 | +5% $656 | +10% $720 |
| Rate | -1.0pp $643 | -0.5pp $618 | base $593 | +0.5pp $567 | +1.0pp $540 |
UW: 25.0% down · 7.5% · 30yr · 1.5% tax · 5.0% vac · 8.0% maint · 8.0% mgmt
Financing live
Cash to close
- Down payment
- $24,975
- Closing costs
- $2,997
- Reserves months
- —
- Total cash needed
- —
Loan-product check · same deal, 3 products live
Conventional
25% down · 7.5% · 30yr
- Down + closing
- —
- Monthly P&I
- —
- Monthly cashflow
- —
- DSCR
- —
- Eligible?
- —
Personal DTI + credit; lowest rate.
DSCR
20% down · 8.5% · 30yr
- Down + closing
- —
- Monthly P&I
- —
- Monthly cashflow
- —
- DSCR
- —
- Eligible?
- —
No personal income docs; deal must DSCR.
Hard money
10% down · 12.0% · 12mo
- Down + closing
- —
- Monthly P&I
- —
- Monthly cashflow
- —
- DSCR
- —
- Eligible?
- —
Short-term bridge; refi at stabilization.
Rent comps 4 comps
| Address | Beds | Baths | Sqft | Rent | $/sqft | DOM | Units | Dist |
|---|---|---|---|---|---|---|---|---|
| 651 Builder Dr Phenix City, AL | 4.0 | 2.0 | 1415 | $1,750 | $1.24 | 22d | 1 | 0.23mi |
| 414 21st Ave Phenix City, AL | 3.0 | 1.0 | 1080 | $1,250 | $1.16 | 15d | 1 | 0.27mi |
| 14 Brentwood Dr Phenix City, AL | 4.0 | 2.0 | 1718 | $1,795 | $1.04 | 15d | 1 | 1.09mi |
| 1346 Ingersoll Dr Phenix City, AL | 3.0 | 2.0 | 1453 | $1,700 | $1.17 | 15d | 1 | 1.25mi |
Listing history 5 events
-
2026-05-11status Pending
Show marketing remark (229 chars)
Single-story home with 3 bedrooms, 2 baths, on a cul-de-sac. The property has a split floor plan, a breakfast area in the kitchen, and a level driveway for parking. Located close to Phenix City shopping, schools, and restaurants,
-
2026-05-11status Pending 229-char remark
Show marketing remark (229 chars)
Single-story home with 3 bedrooms, 2 baths, on a cul-de-sac. The property has a split floor plan, a breakfast area in the kitchen, and a level driveway for parking. Located close to Phenix City shopping, schools, and restaurants,
-
2026-04-24$99,900 Active 229-char remark
Show marketing remark (229 chars)
Single-story home with 3 bedrooms, 2 baths, on a cul-de-sac. The property has a split floor plan, a breakfast area in the kitchen, and a level driveway for parking. Located close to Phenix City shopping, schools, and restaurants,
-
2026-04-22$99,900 Active
-
2003-09-30soldstatus $107,996
ⓘ Source: listings_history table (triggers on properties + properties_extension) + one-shot
backfill from property_details.listing_events for pre-trigger history.
Tax reassessment forecast AL · Resets to sale price
- Current annual tax
- $1,446 · $120/mo
- Projected year-2 tax
- $1,446 · $120/mo
- Expected delta
- $0/yr ($0/mo · 0.0%)
ⓘ Screening estimate from a state-policy table — verify with the county assessor before closing.
Climate risk First Street
- Flood 1/10 Low FEMA zone X (unshaded) · 0% chance over 30 yrs
- Wildfire 4/10 Moderate
- Heat 7/10 Severe 7 d/yr ≥107°F today · 19 d/yr by 30 yrs out
- Wind 6/10 Major 76% chance of damaging wind over 30 yrs
- Air quality 5/10 Major 7 unhealthy d/yr today · 8 by 30 yrs out
Nearby sold comps map
Loading sold comps map…
Walkable amenities ~0.75 mi
Loading nearby amenities…
Taxation est. · year 1
- Rental income
- $19,420
- − Mortgage interest
- −$5,596
- − Property taxes
- −$1,446
- − Insurance
- −$500
- − Repairs & maintenance
- −$1,554
- − Management
- −$1,554
- − Depreciation
- −$2,906
- Taxable income
- $5,866
- Est. tax owed @ 24.0%
- −$1,408
- After-tax cash flow
- $5,703/yr
For passive investors: Depreciation is non-cash, so a rental often shows a tax loss while cash-flowing — sheltering income. Rental losses are passive: they offset passive income freely, and up to $25,000/yr can offset ordinary (W-2) income if you actively participate and your MAGI is under $100k (phasing out to $0 by $150k); unused losses carry forward. On sale, claimed depreciation is recaptured at up to 25%, and gains may owe capital-gains tax (a 1031 exchange can defer both). Figures are a year-1 estimate at your 24.0% rate — not tax advice; consult a CPA.
Schools (NCES district)
- District
- Phenix City
- NCES district ID
- 0102700
- Math proficiency
- 22% ▼ -24.00%
- Reading proficiency
- 44% ▼ -1.00%
- Median HH income
- $36,228
- Composite
- 27.29/100
- National rank
- #7001
- State rank
- #59 of 129 in AL
Livability — Phenix City
- Score
- 60/100
- State rank
- #297
- US rank
- #19037
Category grades
Schools grade is shown separately in the Schools card above.
Census & demographics
- Census place
- Phenix City, AL
- County
- Russell County · 53,055 people
- City population
- 62,290
- Metro
- Columbus, GA-AL
- Population (ZIP)
- 21,518
- Household income
- $50,061
- Rent vs Own
- Severe rent burden
- 789.0
Population outlook (Russell County) Hauer SSP2
- Today (2025)
- 70,137 people
- By 2030
- 75,826 · +8.1%
- By 2040
- 87,858 · +25.3%
- By 2050
- 99,721 · +42.2%
- By 2075
- 128,009 · +82.5%
- By 2100
- 149,251 · +112.8%
Race, ethnicity, and origin ACS 2023
- Neighborhood character
- Diverse neighborhood (Simpson 0.58)
- Race & ethnicity
- Black 50% White 41% Hispanic / Latino 5% Two or more races 4%
- Common ancestry
- Slovak 1% Lithuanian 1% Portuguese 1%
- Foreign-born
- 3% · Canada
- Languages at home
- 95% English-only · Spanish 4%
Political lean MEDSL · Russell
- 2024 margin
- Toss-up / Even · D 50.4% · R 48.7%
- 2008→2024 swing
- -5.6pp toward R · 2008: 7.3pp · 2024: 1.7pp
- All cycles
- 2024: D+1.7 2020: D+6.4 2016: D+1.9 2012: D+11.8 2008: D+7.3
Not yet ingested
- Civics
- —
Market trends
- HPI YoY
- ▼ -47.69%
- Current HPI
- 166.9094
- Rent YoY
- ▲ 0.43%
- Metro
- Columbus, GA-AL
- State GDP YoY
- ▲ 2.94%
- F500 in state
- 4
Industry mix (Fortune 500 HQ in AL)
| Industry | F500 HQs | Revenue |
|---|---|---|
| Financial Services | 1 | $8B |
|
||
| Healthcare | 1 | $5B |
|
||
Price history
-7.5% since first listed5 events — show timeline
- 2026-05-11 Pending — EABOR
- 2026-05-11 Pending — CBOR
- 2026-04-24 Listed $99,900 CBOR
- 2026-04-22 Listed $99,900 EABOR
- 2003-09-30 Sold (Public Records) $107,996 Public Records
Property tax history
-2.2%/yrLatest (2025): $1,446 · -2.2% YoY. Source: county tax records.
Cash-flow waterfall
monthlySold comps — $/sqft
last 12 mo · ≤1 miLoading sold comps…