6237 Ar 16 Hwy · Oark, AR
Flood risk 1/10 · Minimal
- FEMA flood zone
- —
- Chance of flooding over 30 yrs
- 0.0%
- Est. flood insurance / yr
- —
Fire risk 4/10 · Minor
- Est. fire insurance / yr
- $1,499 – $2,785
Heat risk 3/10 · Minor
- Hot days now (above 102°F)
- 5 days/yr
- Hot days in 30 yrs
- 14 days/yr
Wind risk 2/10 · Minimal
- Chance of severe wind over 30 yrs
- 1.0%
Air-quality risk 2/10 · Minimal
- Unhealthy air days now
- 0 days/yr
- Unhealthy air days in 30 yrs
- 1 days/yr
Risk factors via First Street. Map © Google.
Why this score? — see what drove the C- grade
The composite is a weighted blend of 9 inputs, each scored 0–100. Each bar is that input's sub-score; the figure is the points it added to the 100-point composite (weight × sub-score).
- Cash flow +21.9/30.0
- ARV discount +7.5/15.0
- DSCR +7.0/10.0
- 1% rule +5.7/10.0
- Schools +3.0/10.0
- Rent growth +2.5/5.0
- Livability +2.5/5.0
- Condition / age +2.2/5.0
- Appreciation +0.0/10.0
$114,900
🖨 Deal sheet (PDF) 📄 Offer letter ✓ Due diligence
Listing remarks
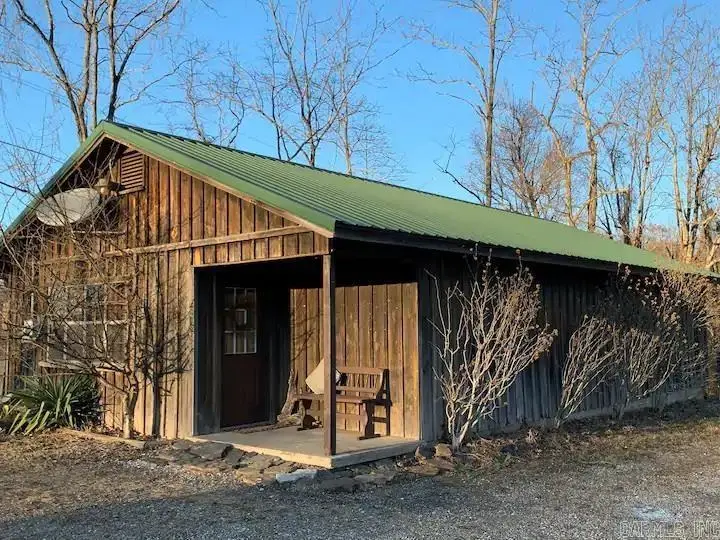
Located in the heart of the Ozarks, this charming cabin is just 5 minutes from Glory Hole Falls and less than 30 minutes from Big Piney, the Mulberry River, Boxley Valley, Whitaker Point, and the Ozark Highlands Trail. A dream retreat for nature lovers, hunters, motorcyclists, and hikers, this home offers the perfect blend of comfort and adventure. The spacious open-concept kitchen and living area provide plenty of room for large groups, complete with a huge breakfast bar and a fully equipped kitchen. The rear deck overlooks the mountains and the Ozark National Forest, offering views of nature. With a newer HVAC system plus auxiliary backup heat, you’ll stay comfortable year-round. Re
Key facts
- 1.34 acre lot
- Built 1975
- Listed 983 days
Property features AI
Finance
- Financial info: Financing options: VA, FHA, cash, Rural Development, or in-house financing
Exterior
- Utilities: Septic system; Public water; Electric provided by co-op
- Home design: Property described by metes & bounds
- Construction: Built on slab foundation
- Exterior features: Cedar and wood exterior; Metal roof; Dirt road access; Rural, wooded lot bordering National Forest with mountain views
Interior
- Kitchen: Electric range
- Flooring: Laminate
- Bathrooms: 1 full bathroom; 1 half bathroom
- Heating & cooling: Central electric heat; Central electric cooling
- Interior features: Laminate floors; Laundry room
- Laundry & utility: Laundry room
Neighborhood map
What this means for you Summary
Snapshot
- This is a 2-bed/1.5-bath single-family listed at $115k. Condition is rated fair.
Deal economics
- At list price, monthly cash flow is $181 ($2k/yr) — positive.
- The deal already cash-flows at list — no discount required.
- Meets the 1% rule at list price ($1k rent vs $115k).
- Recommended offer: $101k (12.0% below list) — sets the bar for market timing.
Location & tenants
- Location reads: area grade C — affects rentability + tenant quality, not the cash-flow math above.
- Jasper School District (rural): math 33% / reading 39% proficiency, ranked #115 of 238 in AR (top 48%) — families likely to look elsewhere, expect single-tenant / working-renter base with shorter leases.
- Zoned schools: Jasper Elementary School (math 47% / reading 37%, grade F, #173 of 454 statewide, top 43%, 271 students, 65% FRL); Jasper High School (math 22% / reading 42%, grade F, #119 of 292 statewide, top 43%, 208 students, 61% FRL) — zoned schools at 63% FRL track the district average.
- Market conditions: 153 active listings in the ZIP.
Forward outlook
- Local home prices are declining (-3.0%/yr); year-one equity from $794 of loan paydown is wiped out by about $3k of value loss. Plan a longer hold.
- Newton County population projected at -36% by 2050 — secular population decline; favor cash flow + early exit over multi-decade hold.
Negotiation context
- It's been on market 983 days — a 12% lower offer ($101k) is reasonable based on typical stale-listing flexibility.
- 3 sale attempts since 3y ago; this cycle's ask has dropped $45k (28%) from the opening price — seller is motivated, your offer sets the floor, not the list.
Questions for the listing agent
- It's been on market 983 days. Have you received any prior offers? Is the seller open to a 12% concession, seller financing, or rate buy-down credit?
- Have any recent inspections been done? Can we get a copy of the seller's disclosures and any deferred-maintenance estimates?
- Built in 1975 — when were the roof, HVAC, electrical panel, plumbing, and water heater last replaced?
- Why hasn't it sold? Are there any deal-killer items the seller is aware of (foundation, flood, title, zoning, code violations)?
- Is there a deadline driving the sale (1031 exchange, divorce, estate, relocation)? That informs how much negotiation room exists.
- What's the average days-on-market for RENTAL listings here right now (not sales)? A rising rental-DOM trend means longer vacancies and softer asking-rent achievability than the comps imply.
- What's the recent tenant-quality profile in this submarket — average credit score on applications, eviction rate, late-payment / NSF rate, and stable-employment percentage? A property-management company in the area should have these aggregated.
- How much new for-sale + rental construction is in the pipeline within 1–3 miles? Heavy new supply typically softens prices + rents 12–24 months out; constrained supply supports both.
Investment metrics
- 1% rule
- 1.07% ✓
- Cap rate
- 8.18%
- Cash-on-cash
- 6.75%
- DSCR
- 1.30
- GRM
- 7.8
CMA / ARV
- ARV (median comp)
- $459,074
- List price
- $114,900
- Delta
- -74.97%
- Verdict
- UNDERPRICED
- Comps
- 1 within 2.0 mi
Projected returns pro-forma
-3.0% appreciation · 3.0% rent growth · sell at horizon
- IRR
- -5.9%
- Equity multiple
- 0.78×
- Total profit
- $-7,074
- Equity at exit
- $17,132
- IRR
- 3.7%
- Equity multiple
- 1.27×
- Total profit
- $8,758
- Equity at exit
- $9,934
Cash invested: $32,172 (down + closing). Projections, not guarantees.
Landlord ↔ Tenant lean methodology
- Overall (STATE)
- 92 Strongly Landlord-Friendly
- State Arkansas
- 92 Strongly Landlord-Friendly · R+14
- County
- — inherits STATE
- City
- — inherits STATE
ZIP-level market 72830
- Home prices YoY
- -11.5%
- Active inventory
- 153
- Price-to-rent
- 7.8×
Monthly cashflow live
- Estimated rent
- $1,234 medium interval (Pro) →
- Mortgage (P&I)
- −$603
- Tax est. 1.5%
- −$144 /mo · $1,724/yr
- Insurance
- −$48
- HOA
- −$0
- Vacancy / Maint / Mgmt
- −$259
- Net cashflow
- $181
Break-even live
Sensitivity live
| Price | -10% $260 | -5% $221 | +0% $181 | +5% $141 | +10% $102 |
|---|---|---|---|---|---|
| Rent | -10% $83 | -5% $132 | +0% $181 | +5% $230 | +10% $278 |
| Rate | -1.0pp $239 | -0.5pp $210 | base $181 | +0.5pp $151 | +1.0pp $121 |
UW: 25.0% down · 7.5% · 30yr · 1.5% tax · 5.0% vac · 8.0% maint · 8.0% mgmt
Financing live
Cash to close
- Down payment
- $28,725
- Closing costs
- $3,447
- Reserves months
- —
- Total cash needed
- —
Loan-product check · same deal, 3 products live
Conventional
25% down · 7.5% · 30yr
- Down + closing
- —
- Monthly P&I
- —
- Monthly cashflow
- —
- DSCR
- —
- Eligible?
- —
Personal DTI + credit; lowest rate.
DSCR
20% down · 8.5% · 30yr
- Down + closing
- —
- Monthly P&I
- —
- Monthly cashflow
- —
- DSCR
- —
- Eligible?
- —
No personal income docs; deal must DSCR.
Hard money
10% down · 12.0% · 12mo
- Down + closing
- —
- Monthly P&I
- —
- Monthly cashflow
- —
- DSCR
- —
- Eligible?
- —
Short-term bridge; refi at stabilization.
Listing history 17 events
-
2026-06-12statusdays on market $114,900 Under Contract 983 DOM
-
2026-06-09days on market $114,900 Active 982 DOM
-
2026-06-08days on market $114,900 Active 981 DOM
-
2026-06-07days on market $114,900 Active 980 DOM
-
2026-06-05days on market $114,900 Active 978 DOM
-
2026-06-04days on market $114,900 Active 976 DOM
-
2026-06-02days on market $114,900 Active 975 DOM
-
2026-06-01days on market $114,900 Active 974 DOM
-
2026-05-31days on market $114,900 Active 973 DOM
-
2026-05-31days on market $114,900 Active 972 DOM
-
2024-10-04price $114,900
-
2024-09-03status Back on Market
-
2024-04-11historical
-
2024-02-06price $125,000
-
2023-11-14price $135,000
-
2023-08-16status Back on Market
-
2023-04-10$159,900 New Listing
ⓘ Source: listings_history table (triggers on properties + properties_extension) + one-shot
backfill from property_details.listing_events for pre-trigger history.
Climate risk First Street
- Flood 1/10 Low 0% chance over 30 yrs
- Wildfire 4/10 Moderate
- Heat 3/10 Moderate 5 d/yr ≥102°F today · 14 d/yr by 30 yrs out
- Wind 2/10 Low 100% chance of damaging wind over 30 yrs
- Air quality 2/10 Low 0 unhealthy d/yr today · 1 by 30 yrs out
Nearby sold comps map
Loading sold comps map…
Walkable amenities ~0.75 mi
Loading nearby amenities…
Taxation est. · year 1
- Rental income
- $14,811
- − Mortgage interest
- −$6,436
- − Property taxes
- −$1,724
- − Insurance
- −$574
- − Repairs & maintenance
- −$1,185
- − Management
- −$1,185
- − Depreciation
- −$3,343
- Taxable income
- $364
- Est. tax owed @ 24.0%
- −$87
- After-tax cash flow
- $2,084/yr
For passive investors: Depreciation is non-cash, so a rental often shows a tax loss while cash-flowing — sheltering income. Rental losses are passive: they offset passive income freely, and up to $25,000/yr can offset ordinary (W-2) income if you actively participate and your MAGI is under $100k (phasing out to $0 by $150k); unused losses carry forward. On sale, claimed depreciation is recaptured at up to 25%, and gains may owe capital-gains tax (a 1031 exchange can defer both). Figures are a year-1 estimate at your 24.0% rate — not tax advice; consult a CPA.
Condition & rehab AI · 1 photo
This cabin requires moderate renovations to its exterior, flooring, and interior walls to improve its condition and value.
Repairs flagged
- Major exterior siding — Significant wear and tear
- Major flooring — Worn and uneven
- Major interior walls — Painted walls show wear
Value-add opportunities
- Both Paint exterior siding — Enhances curb appeal and value
- Both Replace flooring — Improves comfort and value
- Both Paint interior walls — Enhances interior appearance and value
Renovation cost estimate screening
| Repair item | Severity | Est. cost |
|---|---|---|
| exterior siding · Significant wear and tear | Major | $15,000–50,000 |
| flooring · Worn and uneven | Major | $15,000–50,000 |
| interior walls · Painted walls show wear | Major | $15,000–50,000 |
| Total estimated repair cost · 3 items | $45,000–150,000 |
Value-add ROI direction
- Both Paint exterior siding — Enhances curb appeal and value ↑
- Both Replace flooring — Improves comfort and value ↑
- Both Paint interior walls — Enhances interior appearance and value ↑
ⓘ Cost ranges are severity-bucket heuristics (US national rule-of-thumb). Get contractor quotes + a written scope before underwriting a rehab budget.
Schools (NCES district)
- District
- Jasper School District
- NCES district ID
- 0508240
- Math proficiency
- 33% ▼ -5.00%
- Reading proficiency
- 39% ▼ -5.00%
- Median HH income
- $33,615
- Composite
- 29.59/100
- National rank
- #6480
- State rank
- #115 of 238 in AR
Livability — Oark
No livability data for this city. (Only ~50 U.S. cities are tracked.)
Census & demographics
- Population (ZIP)
- 15,962
Population outlook (Newton County) Hauer SSP2
- Today (2025)
- 7,052 people
- By 2030
- 6,509 · -7.7%
- By 2040
- 5,424 · -23.1%
- By 2050
- 4,502 · -36.2%
- By 2075
- 3,018 · -57.2%
- By 2100
- 1,985 · -71.9%
Race, ethnicity, and origin ACS 2023
- Neighborhood character
- Predominantly White (71%)
- Race & ethnicity
- White 71% Hispanic / Latino 18% Two or more races 9% Asian 4% Black 2%
- Hispanic origin (detail)
- Mexican 17%
- Common ancestry
- Slovak 2% Iranian 1% Lithuanian 1%
- Foreign-born
- 12% · Canada, Philippines, Vietnam
- Languages at home
- 84% English-only · Spanish 12% Other Asian/Pacific 2% German/W. Germanic 1%
Political lean MEDSL · Newton
- 2024 margin
- Solid R (+64.2) · D 17.1% · R 81.2% · Other 1.7%
- 2008→2024 swing
- -28.7pp toward R · 2008: -35.5pp · 2024: -64.2pp
- All cycles
- 2024: R+64.2 2020: R+62.1 2016: R+58.3 2012: R+41.4 2008: R+35.5
Not yet ingested
- Civics
- —
Market trends
- HPI YoY
- ▼ -24.36%
- Current HPI
- 187.5114
- Rent YoY
- —
- Metro
- —
- State GDP YoY
- ▲ 3.80%
- F500 in state
- 10
Industry mix (Fortune 500 HQ in AR)
| Industry | F500 HQs | Revenue |
|---|---|---|
| Retail | 1 | $681B |
|
||
| Food / Agriculture | 1 | $53B |
|
||
| Retail / Energy | 1 | $22B |
|
||
| Transportation / Logistics | 1 | $12B |
|
||
| Energy | 1 | $4B |
|
||
Price history
-28.1% since first listed8 events — show timeline
- 2024-10-04 Price Changed $114,900 CARMLS
- 2024-09-03 Relisted — CARMLS
- 2024-04-11 Listing Removed — CARMLS
- 2024-02-06 Price Changed $125,000 CARMLS
- 2023-11-14 Price Changed $135,000 CARMLS
- 2023-08-16 Relisted — CARMLS
- 2023-07-18 Pending — CARMLS
- 2023-04-10 Listed $159,900 CARMLS
Cash-flow waterfall
monthlySold comps — $/sqft
last 12 mo · ≤1 miLoading sold comps…