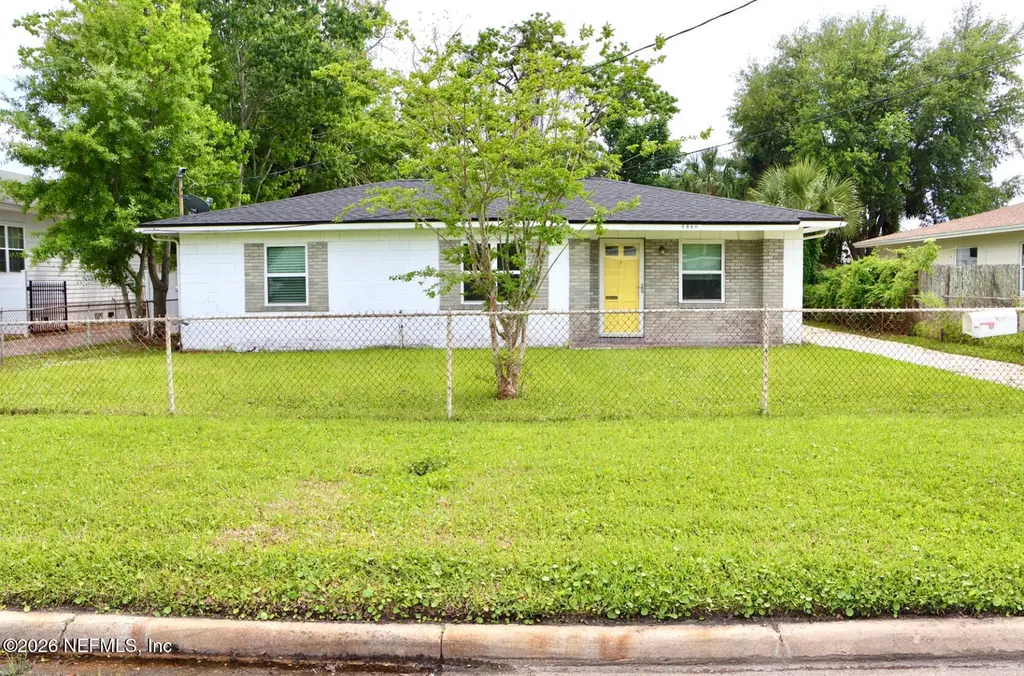
4440 Shirley Ave · Jacksonville, FL
Flood risk 6/10 · Moderate
- FEMA flood zone
- X (unshaded)
- Chance of flooding over 30 yrs
- 0.68%
- Est. flood insurance / yr
- $507 – $1,088
Fire risk 1/10 · Minimal
- Est. fire insurance / yr
- $947 – $1,759
Heat risk 9/10 · Severe
- Hot days now (above 107°F)
- 7 days/yr
- Hot days in 30 yrs
- 21 days/yr
Wind risk 9/10 · Severe
- Chance of severe wind over 30 yrs
- 99.0%
Air-quality risk 5/10 · Moderate
- Unhealthy air days now
- 7 days/yr
- Unhealthy air days in 30 yrs
- 7 days/yr
Risk factors via First Street. Map © Google.
Why this score? — see what drove the C- grade
The composite is a weighted blend of 9 inputs, each scored 0–100. Each bar is that input's sub-score; the figure is the points it added to the 100-point composite (weight × sub-score).
- ARV discount +14.1/15.0
- Cash flow +13.8/30.0
- 1% rule +4.7/10.0
- DSCR +4.2/10.0
- Livability +4.2/5.0
- Schools +3.9/10.0
- Rent growth +3.0/5.0
- Condition / age +2.5/5.0
- Appreciation +0.0/10.0
$173,000
🖨 Deal sheet (PDF) 📄 Offer letter ✓ Due diligence
Listing remarks
This concrete block 3bd 1bth home in Avondale's Fairfax neighborhood offering a great opportunity for renovation and value-add. Just minutes from Riverside, Murray Hill, and Downtown Jacksonville, the location offers strong appeal for future resale or rental potential. The home features a new roof (2023) and an HVAC system (2018), providing a solid foundation for improvements. With a spacious layout, large backyard, and a detached 2-car garage, this property is ideal for investors, flippers, or buyers looking to renovate and build equity. Home is in need of updating and repairs and is being sold AS-IS. Seller will make No Repairs. No Lowball Offers, No Blind Offers, and No Assignment of Con
Key facts
- Rental potential
- Large backyard
- Hvac system
Tags
Property features AI
Finance
- HOA & community: Not a senior community
Exterior
- Parking: 2-car garage; Off-street parking
- Utilities: Public sewer; Water connected; Electricity connected; Cable available
- Home design: Single-family residence; One story
- Construction: Block construction; Shingle roof
- Exterior features: Covered front porch; Chain-link full fencing
Interior
- Kitchen: Electric cooktop; Electric oven; Electric range; Refrigerator
- Bedrooms: 3 bedrooms
- Bathrooms: 1 full bathroom
- Heating & cooling: Central heating (electric); Central air conditioning (electric)
- Interior features: Breakfast bar; Open floorplan; Primary bathroom with tub and shower
- Laundry & utility: Washer hookup; Electric dryer hookup; Electric water heater
Neighborhood map
What this means for you Summary
Snapshot
- This is a 3-bed/1.0-bath single-family listed at $173k.
Deal economics
- At list price, monthly cash flow is $15 ($175/yr) — positive.
- The deal already cash-flows at list — no discount required.
- To meet the 1% rule (rent ≥ 1% of price), the offer needs to be $168k (3.0% below list).
- Recommended offer: $168k (3.0% below list) — sets the bar for 1% rule.
- Cap rate 6.4% vs local median 3.9% in Jacksonville — top-decile yield for the area; either an underpriced asset or a hidden risk that comps aren't pricing in. Stress-test before assuming the spread holds.
Location & tenants
- Location reads 83/100 on livability (#50 in FL, #911 nationally) — a professional / high-income tenant draw. Strengths: amenities A+, commute A+, housing A+.
- Duval (urban): math 46% / reading 45% proficiency, ranked #48 of 73 in FL (top 66%) — families likely to look elsewhere, expect single-tenant / working-renter base with shorter leases.
- Zoned schools: Fishweir Elementary School (math 66% / reading 71%, grade B+, #409 of 2,144 statewide, top 20%, 465 students, 29% FRL); Lake Shore Middle School (math 25% / reading 22%, grade F, #536 of 571 statewide, top 95%, 972 students, 75% FRL); Riverside High School (math 24% / reading 39%, grade F, #424 of 667 statewide, top 64%, 1,567 students, 60% FRL).
- Market conditions: Rents rising (+2.1%/yr); 441 active listings in the ZIP; 17 comparable units currently listed for rent nearby; rentals at typical pace (median 22d on market — plan ~3-4 weeks tenant-placement turnaround); 6,503 units permitted in Duval County in 2024 (1,131 in 5+ unit buildings).
- This rent runs 33% of the median local income ($61k/yr) — at the standard rent-burdened threshold; future hikes will face affordability resistance.
Forward outlook
- Local home prices are declining (-3.0%/yr); year-one equity from $1k of loan paydown is wiped out by about $5k of value loss. Plan a longer hold.
- Duval County population projected at +19% by 2050 — long-run rental-demand tailwind backs the buy-and-hold thesis.
Negotiation context
- Only 6 days on market — expect competitive offers; lowballing is unlikely to land.
- 2 sale attempts with the ask held roughly flat each time — persistent listings suggest the price (not the market) is what's stuck; bring a comps-based counter.
- Current owner paid $62k; list at $173k implies a 179% gain — meaningful room to come down on a strong offer.
Risks & watch-outs
- Watch-outs: built in 1951 — expect roof / HVAC / electrical / plumbing capex.
- Climate carrying-cost: major flood risk; severe wind risk, 99% chance of damaging wind over 30y; extreme-heat days projected 7→21/yr by 2055 (HVAC capex compounding) — expect insurance premiums to compound above CPI over the hold.
Questions for the listing agent
- Built in 1951 — when were the roof, HVAC, electrical panel, plumbing, and water heater last replaced?
- Is there a deadline driving the sale (1031 exchange, divorce, estate, relocation)? That informs how much negotiation room exists.
- Schools are B-rated — typically a magnet for longer-tenancy family renters. What's the average tenant stay here, and is there a school-zone premium baked into asking?
- What's the average days-on-market for RENTAL listings here right now (not sales)? A rising rental-DOM trend means longer vacancies and softer asking-rent achievability than the comps imply.
- What's the recent tenant-quality profile in this submarket — average credit score on applications, eviction rate, late-payment / NSF rate, and stable-employment percentage? A property-management company in the area should have these aggregated.
- How much new for-sale + rental construction is in the pipeline within 1–3 miles? Heavy new supply typically softens prices + rents 12–24 months out; constrained supply supports both.
Investment metrics
- 1% rule
- 0.97% ✗
- Cap rate
- 6.39%
- Cash-on-cash
- 0.36%
- DSCR
- 1.02
- GRM
- 8.6
CMA / ARV
- ARV (on-the-fly)
- $202,860
- Comps found
- 12
Show comp detail 12 sales within ~0.75 mi
| Address | Dist | Beds/Ba | Sqft | Sold | Price | $/sf | Match |
|---|---|---|---|---|---|---|---|
| 4360 Palmer Ave | 0.21mi | 2/1.0 (-1) | 975 (+1%) | 8mo | $200,000 | $205 | 77 |
| 4768 Beverly Cir | 0.52mi | 3/1.0 | 934 (-3%) | 4mo | $189,000 | $202 | 67 |
| 4348 Beverly Ave | 0.21mi | 2/1.0 (-1) | 1,033 (+7%) | 11mo | $300,000 | $290 | 65 |
| 4440 Beverly Ave | 0.18mi | 2/1.0 (-1) | 1,066 (+10%) | 6mo | $305,000 | $286 | 64 |
| 4436 Melrose Ave | 0.23mi | 2/2.0 (-1) | 1,080 (+12%) | 0mo | $260,000 | $241 | 60 |
| 4763 Sefa Cir N | 0.61mi | 3/1.0 | 1,018 (+5%) | 10mo | $214,000 | $210 | 54 |
| 4571 Shelby Ave | 0.45mi | 2/1.5 (-1) | 873 (-10%) | 4mo | $170,000 | $195 | 53 |
| 4238 Woodmere St | 0.44mi | 3/1.0 | 1,091 (+13%) | 7mo | $275,000 | $252 | 52 |
| 4748 Sefa Cir N | 0.57mi | 3/1.0 | 1,047 (+8%) | 9mo | $160,000 | $153 | 52 |
| 4732 Wheeler Ave | 0.66mi | 3/1.0 | 1,055 (+9%) | 3mo | $198,000 | $188 | 51 |
| 4720 Manchester Rd | 0.75mi | 3/1.0 | 1,066 (+10%) | 10mo | $105,000 | $98 | 39 |
| 1647 Charon Rd | 0.67mi | 2/1.0 (-1) | 1,076 (+11%) | 9mo | $265,000 | $246 | 38 |
Match score weights: distance 35% · size 25% · config 20% · recency 20%. Top-matched comps best support the ARV.
Projected returns pro-forma
-3.0% appreciation · 2.11% rent growth · sell at horizon
- IRR
- -16.8%
- Equity multiple
- 0.41×
- Total profit
- $-28,497
- Equity at exit
- $25,795
- IRR
- -10.3%
- Equity multiple
- 0.40×
- Total profit
- $-29,230
- Equity at exit
- $14,958
Cash invested: $48,440 (down + closing). Projections, not guarantees.
Landlord ↔ Tenant lean methodology
- Overall (STATE)
- 87 Strongly Landlord-Friendly
- State Florida
- 87 Strongly Landlord-Friendly · R+3
- County
- — inherits STATE
- City
- — inherits STATE
ZIP-level market 32210
- Rents YoY
- 2.1%
- Active inventory
- 441
- Price-to-rent
- 8.6×
Monthly cashflow live
- Estimated rent
- $1,678 high interval (Pro) →
- Mortgage (P&I)
- −$907
- Tax from tax record
- −$332 /mo · $3,980/yr
- Insurance
- −$72
- HOA
- −$0
- Vacancy / Maint / Mgmt
- −$352
- Net cashflow
- $15
Break-even live
Sensitivity live
| Price | -10% $113 | -5% $64 | +0% $15 | +5% $-34 | +10% $-83 |
|---|---|---|---|---|---|
| Rent | -10% $-118 | -5% $-52 | +0% $15 | +5% $81 | +10% $147 |
| Rate | -1.0pp $102 | -0.5pp $59 | base $15 | +0.5pp $-30 | +1.0pp $-76 |
UW: 25.0% down · 7.5% · 30yr · 1.5% tax · 5.0% vac · 8.0% maint · 8.0% mgmt
Financing live
Cash to close
- Down payment
- $43,250
- Closing costs
- $5,190
- Reserves months
- —
- Total cash needed
- —
Loan-product check · same deal, 3 products live
Conventional
25% down · 7.5% · 30yr
- Down + closing
- —
- Monthly P&I
- —
- Monthly cashflow
- —
- DSCR
- —
- Eligible?
- —
Personal DTI + credit; lowest rate.
DSCR
20% down · 8.5% · 30yr
- Down + closing
- —
- Monthly P&I
- —
- Monthly cashflow
- —
- DSCR
- —
- Eligible?
- —
No personal income docs; deal must DSCR.
Hard money
10% down · 12.0% · 12mo
- Down + closing
- —
- Monthly P&I
- —
- Monthly cashflow
- —
- DSCR
- —
- Eligible?
- —
Short-term bridge; refi at stabilization.
Rent comps 17 comps
| Address | Beds | Baths | Sqft | Rent | $/sqft | DOM | Units | Dist |
|---|---|---|---|---|---|---|---|---|
| 4608 Wheeler Ave Jacksonville, FL | 3.0 | 1.0 | 1025 | $2,000 | $1.95 | 25d | 1 | 0.57mi |
| 4776 Cardinal Blvd Jacksonville, FL | 3.0 | 1.0 | 959 | $1,550 | $1.62 | 25d | 1 | 0.59mi |
| 3946 Saint Johns Ave Jacksonville, FL | 1.0–2.0 | 1.0–2.0 | 900 | $2,486 | $2.76 | 3d | 18 | 0.65mi |
| 4844 Merrimac Ave Jacksonville, FL | 2.0 | 1.0 | 820 | $1,325 | $1.62 | 25d | 1 | 0.76mi |
| 3867 Herschel St Jacksonville, FL | 3.0 | 1.0 | 1092 | $2,100 | $1.92 | 25d | 1 | 0.84mi |
| 5139 Camille Ave Jacksonville, FL | 3.0 | 2.0 | 1100 | $1,625 | $1.48 | 3d | 1 | 0.88mi |
| 5215 San Juan Ave Jacksonville, FL | 2.0 | 1.0 | 750 | $1,075 | $1.43 | 9d | 1 | 0.97mi |
| 1815 Van Wert Ave Unit 3 Jacksonville, FL | 2.0 | 1.5 | 1100 | $1,350 | $1.23 | 23d | 1 | 1.04mi |
| 3434 Blanding Blvd Jacksonville, FL | 2.0–3.0 | 2.0 | 1101 | $1,800 | $1.63 | 4d | 2 | 1.20mi |
| 1654 Talbot Ave Jacksonville, FL | 2.0 | 1.0 | 840 | $1,600 | $1.90 | 6d | 1 | 1.34mi |
| 5615 San Juan Ave #208 Jacksonville, FL | 2.0 | 2.0 | 1115 | $1,200 | $1.08 | 25d | 1 | 1.38mi |
| 1379 Ingleside Ave Unit B Jacksonville, FL | 2.0 | 1.0 | 900 | $1,291 | $1.43 | 16d | 1 | 1.40mi |
| 5351 Royce Ave Jacksonville, FL | 3.0 | 1.0 | 1040 | $1,600 | $1.54 | 25d | 1 | 1.43mi |
| 2039 Niblick Dr Jacksonville, FL | 1.0–2.0 | 1.0–2.0 | 847 | $1,275 | $1.51 | 4d | 10 | 1.45mi |
| 1284 Ingleside Ave Jacksonville, FL | 2.0 | 1.0 | 1000 | $1,400 | $1.40 | 25d | 1 | 1.45mi |
| 5377 Royce Ave Jacksonville, FL | 3.0 | 1.0 | 1040 | $1,800 | $1.73 | 19d | 1 | 1.47mi |
| 5363 Poppy Dr Jacksonville, FL | 3.0 | 1.0 | 1040 | $1,445 | $1.39 | 22d | 1 | 1.49mi |
Listing history 5 events
-
2026-04-30status Pending
-
2026-04-14$173,000 Active
-
2025-01-21historical $1,050
-
2025-01-19$1,050
-
1997-10-27soldstatus $61,900
ⓘ Source: listings_history table (triggers on properties + properties_extension) + one-shot
backfill from property_details.listing_events for pre-trigger history.
Tax reassessment forecast FL · Resets to sale price
- Current annual tax
- $3,980 · $332/mo
- Projected year-2 tax
- $3,980 · $332/mo
- Expected delta
- $0/yr ($0/mo · 0.0%)
ⓘ Screening estimate from a state-policy table — verify with the county assessor before closing.
Climate risk First Street
- Flood 6/10 Major FEMA zone X (unshaded) · 68% chance over 30 yrs
- Wildfire 1/10 Low
- Heat 9/10 Extreme 7 d/yr ≥107°F today · 21 d/yr by 30 yrs out
- Wind 9/10 Extreme 99% chance of damaging wind over 30 yrs
- Air quality 5/10 Major 7 unhealthy d/yr today · 7 by 30 yrs out
Nearby sold comps map
Loading sold comps map…
Walkable amenities ~0.75 mi
Loading nearby amenities…
Taxation est. · year 1
- Rental income
- $20,135
- − Mortgage interest
- −$9,691
- − Property taxes
- −$3,980
- − Insurance
- −$865
- − Repairs & maintenance
- −$1,611
- − Management
- −$1,611
- − Depreciation
- −$5,033
- Taxable loss
- −$2,655
- Est. tax savings @ 24.0%
- +$637
- After-tax cash flow
- $812/yr
For passive investors: Depreciation is non-cash, so a rental often shows a tax loss while cash-flowing — sheltering income. Rental losses are passive: they offset passive income freely, and up to $25,000/yr can offset ordinary (W-2) income if you actively participate and your MAGI is under $100k (phasing out to $0 by $150k); unused losses carry forward. On sale, claimed depreciation is recaptured at up to 25%, and gains may owe capital-gains tax (a 1031 exchange can defer both). Figures are a year-1 estimate at your 24.0% rate — not tax advice; consult a CPA.
Schools (NCES district)
- District
- Duval
- NCES district ID
- 1200480
- Math proficiency
- 46% ▼ -11.00%
- Reading proficiency
- 45% ▼ -4.00%
- Median HH income
- $48,987
- Composite
- 38.97/100
- National rank
- #4076
- State rank
- #48 of 73 in FL
Livability — Jacksonville
- Score
- 83/100
- State rank
- #50
- US rank
- #911
Category grades
Schools grade is shown separately in the Schools card above.
Census & demographics
- Census place
- Jacksonville, FL
- County
- Duval County · 1,015,274 people
- City population
- 979,034
- Metro
- Jacksonville, FL
- Population (ZIP)
- 65,729
- Household income
- $61,050
- Rent vs Own
- Severe rent burden
- 3605.0
Population outlook (Duval County) Hauer SSP2
- Today (2025)
- 1,013,010 people
- By 2030
- 1,059,228 · +4.6%
- By 2040
- 1,141,439 · +12.7%
- By 2050
- 1,205,258 · +19.0%
- By 2075
- 1,324,282 · +30.7%
- By 2100
- 1,319,620 · +30.3%
Race, ethnicity, and origin ACS 2023
- Neighborhood character
- Diverse neighborhood (Simpson 0.65)
- Race & ethnicity
- White 43% Black 38% Hispanic / Latino 10% Two or more races 7% Asian 3%
- Hispanic origin (detail)
- Mexican 3% Puerto Rican 3%
- Common ancestry
- Slovak 2% Hispanic 2% Italian 1%
- Foreign-born
- 10% · Canada, Vietnam, China
- Languages at home
- 86% English-only · Spanish 7% French/Haitian/Cajun 2% Tagalog/Filipino 1%
Political lean MEDSL · Duval
- 2024 margin
- Toss-up / Even · D 48.7% · R 50.1% · Other 1.2%
- 2008→2024 swing
- +0.4pp no change · 2008: -1.9pp · 2024: -1.5pp
- All cycles
- 2024: R+1.5 2020: D+3.8 2016: R+1.5 2012: R+3.6 2008: R+1.9
Not yet ingested
- Civics
- —
Market trends
- HPI YoY
- ▼ -314.81%
- Current HPI
- 281.2688
- Rent YoY
- ▲ 2.11%
- Metro
- Jacksonville, FL
- State GDP YoY
- ▲ 3.28%
- F500 in state
- 36
Industry mix (Fortune 500 HQ in FL)
| Industry | F500 HQs | Revenue |
|---|---|---|
| Industrial Technology | 2 | $29B |
|
||
| Insurance | 2 | $17B |
|
||
| Retail | 1 | $60B |
|
||
| Technology Distribution | 1 | $58B |
|
||
| Homebuilding | 1 | $35B |
|
||
| Technology Manufacturing | 1 | $35B |
|
||
Price history
+179.5% since first listed5 events — show timeline
- 2026-04-30 Pending — realMLS
- 2026-04-14 Listed $173,000 realMLS
- 2025-01-21 Rental Removed $1,050 TURBOTENANT
- 2025-01-19 Listed for Rent $1,050 TURBOTENANT
- 1997-10-27 Sold (Public Records) $61,900 Public Records
Property tax history
+7.0%/yrLatest (2025): $3,980 · +7.0% YoY. Source: county tax records.
Cash-flow waterfall
monthlySold comps — $/sqft
last 12 mo · ≤1 miLoading sold comps…