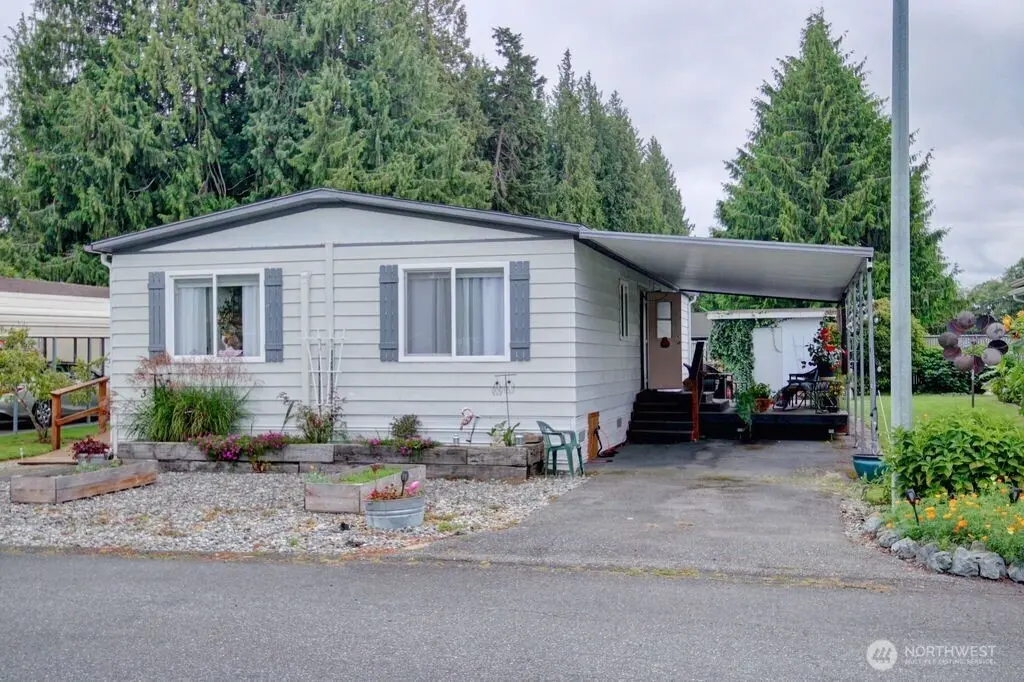
920 Maple Ln #3 · Sedro-Woolley, WA
Flood risk 5/10 · Moderate
- FEMA flood zone
- X
- Chance of flooding over 30 yrs
- 0.24%
- Est. flood insurance / yr
- $507 – $1,088
Fire risk 4/10 · Minor
- Est. fire insurance / yr
- $604 – $1,122
Heat risk 2/10 · Minimal
- Hot days now (above 83°F)
- 7 days/yr
- Hot days in 30 yrs
- 19 days/yr
Wind risk 1/10 · Minimal
- Chance of severe wind over 30 yrs
- —
Air-quality risk 6/10 · Moderate
- Unhealthy air days now
- 9 days/yr
- Unhealthy air days in 30 yrs
- 10 days/yr
Risk factors via First Street. Map © Google.
Why this score? — see what drove the B+ grade
The composite is a weighted blend of 9 inputs, each scored 0–100. Each bar is that input's sub-score; the figure is the points it added to the 100-point composite (weight × sub-score).
- Cash flow +30.0/30.0
- 1% rule +10.0/10.0
- DSCR +10.0/10.0
- Appreciation +10.0/10.0
- ARV discount +7.5/15.0
- Schools +4.7/10.0
- Rent growth +2.5/5.0
- Livability +2.5/5.0
- Condition / age +2.5/5.0
$129,000
🖨 Deal sheet 📄 Offer letter ✓ Due diligence
Listing remarks
ALL AGES WELCOME at Maple Lane Estates Community located in Sedro Woolley. Spacious 2 bedroom, 2 bath home offers a comfortable & functional layout design for easy living. Exceptionally large primary suite, complete w/ walk-in closet & private en-suite bathroom. A well sized second bedroom is ideal for guests, hobbies, or a home office. The cozy family room flows seamlessly into the dining area just off the kitchen, creating an inviting space for gatherings & effortless entertaining. Step outside to a beautifully built, oversized covered deck - perfect for year round relaxation, morning coffee, or hosting friends. Backyard shed offers convenient storage & extra room
Key facts
- Backyard shed
- Parking
- Built 1977
Tags
Neighborhood map
What this means for you Summary
Snapshot
- This is a 2-bed/2.0-bath manufactured listed at $129k.
Deal economics
- At list price, monthly cash flow is $947 ($11k/yr) — positive.
- The deal already cash-flows at list — no discount required.
- Meets the 1% rule at list price ($2k rent vs $129k).
- Recommended offer: $125k (3.0% below list) — sets the bar for market timing.
- Cap rate 15.1% vs local median 2.4% in Sedro-Woolley — top-decile yield for the area; either an underpriced asset or a hidden risk that comps aren't pricing in. Stress-test before assuming the spread holds.
Location & tenants
- Location reads: area grade B — affects rentability + tenant quality, not the cash-flow math above.
- Sedro-Woolley School District (suburban): math 47% / reading 58% proficiency, ranked #117 of 291 in WA (top 40%) — acceptable for families but not a draw, mixed tenant base, ~2y average lease.
- Market conditions: 226 active listings in the ZIP; 6 comparable units currently listed for rent nearby; rentals lingering (median 44d on market — plan ~5-8 weeks vacancy on turnover, expect pricing pressure); 50% of comp listings sitting > 30 days — soft ceiling on asking rent; solid renter incomes; 561 units permitted in Skagit County in 2024 (270 in 5+ unit buildings).
Forward outlook
- In year one you build about $14k of equity ($892 loan paydown + $13k appreciation (10.0% local appreciation)).
- Skagit County population projected at +11% by 2050 — modest demand growth; plan on rents tracking national, not racing it.
- At projected returns (10.0% appreciation + 3.0% rent growth), your $36k cash investment doubles in ~2 years — after that, you're playing with house money.
- By year 3, paydown + projected appreciation supports a ~$35k cash-out refi (75% LTV) — recoverable capital for the next deal without selling this one.
Negotiation context
- It's been on market 59 days — a 3% lower offer ($125k) is reasonable based on typical stale-listing flexibility.
Risks & watch-outs
- Climate carrying-cost: moderate flood risk — expect insurance premiums to compound above CPI over the hold.
Questions for the listing agent
- It's been on market 59 days. Have you received any prior offers? Is the seller open to a 3% concession, seller financing, or rate buy-down credit?
- Built in 1977 — when were the roof, HVAC, electrical panel, plumbing, and water heater last replaced?
- Is there a deadline driving the sale (1031 exchange, divorce, estate, relocation)? That informs how much negotiation room exists.
- What's the average days-on-market for RENTAL listings here right now (not sales)? A rising rental-DOM trend means longer vacancies and softer asking-rent achievability than the comps imply.
- What's the recent tenant-quality profile in this submarket — average credit score on applications, eviction rate, late-payment / NSF rate, and stable-employment percentage? A property-management company in the area should have these aggregated.
- How much new for-sale + rental construction is in the pipeline within 1–3 miles? Heavy new supply typically softens prices + rents 12–24 months out; constrained supply supports both.
Investment metrics
- 1% rule
- 1.68% ✓
- Cap rate
- 15.10%
- Cash-on-cash
- 31.46%
- DSCR
- 2.40
- GRM
- 5.0
CMA / ARV
- ARV (median comp)
- $70,000
- List price
- $129,000
- Delta
- 84.29%
- Verdict
- OVERPRICED
- Comps
- 2 within 1.0 mi
Show comp detail 3 sales within ~0.75 mi
| Address | Dist | Beds/Ba | Sqft | Sold | Price | $/sf | Match |
|---|---|---|---|---|---|---|---|
| 920 Maple Ln #11 | 0.00mi | 2/2.0 | 1,152 (0%) | 3mo | $70,000 | $61 | 98 |
| 920 Maple Ln #15 | 0.00mi | 3/2.0 (+1) | 1,152 (0%) | 1mo | $70,000 | $61 | 94 |
| 22661 Rhodes Rd | 0.46mi | 3/2.0 (+1) | 1,296 (+12%) | 15mo | $490,000 | $378 | 40 |
Match score weights: distance 35% · size 25% · config 20% · recency 20%. Top-matched comps best support the ARV.
Projected returns pro-forma
10.0% appreciation · 3.0% rent growth · sell at horizon
- IRR
- 48.2%
- Equity multiple
- 4.61×
- Total profit
- $130,517
- Equity at exit
- $116,213
- IRR
- 42.0%
- Equity multiple
- 10.33×
- Total profit
- $336,830
- Equity at exit
- $250,619
Cash invested: $36,120 (down + closing). Projections, not guarantees.
Landlord ↔ Tenant lean methodology
- Overall (STATE)
- 28 Tenant-Leaning
- State Washington
- 28 Tenant-Leaning · D+8
- County
- — inherits STATE
- City
- — inherits STATE
ZIP-level market 98284
- Home prices YoY
- 3.5%
- Active inventory
- 226
- Price-to-rent
- 5.0×
Monthly cashflow live
- Estimated rent
- $2,161 high interval (Pro) →
- Mortgage (P&I)
- −$676
- Tax from tax record
- −$30 /mo · $364/yr
- Insurance
- −$54
- HOA
- −$0
- Vacancy / Maint / Mgmt
- −$454
- Net cashflow
- $947
Break-even live
UW: 25.0% down · 7.5% · 30yr · 1.5% tax · 5.0% vac · 8.0% maint · 8.0% mgmt
Financing live
Cash to close
- Down payment
- $32,250
- Closing costs
- $3,870
- Reserves months
- —
- Total cash needed
- —
Loan-product check · same deal, 3 products live
Conventional
25% down · 7.5% · 30yr
- Down + closing
- —
- Monthly P&I
- —
- Monthly cashflow
- —
- DSCR
- —
- Eligible?
- —
Personal DTI + credit; lowest rate.
DSCR
20% down · 8.5% · 30yr
- Down + closing
- —
- Monthly P&I
- —
- Monthly cashflow
- —
- DSCR
- —
- Eligible?
- —
No personal income docs; deal must DSCR.
Hard money
10% down · 12.0% · 12mo
- Down + closing
- —
- Monthly P&I
- —
- Monthly cashflow
- —
- DSCR
- —
- Eligible?
- —
Short-term bridge; refi at stabilization.
Rent comps 6 comps
| Address | Beds | Baths | Sqft | Rent | $/sqft | DOM | Units | Dist |
|---|---|---|---|---|---|---|---|---|
| 820 Trail Rd Sedro Woolley, WA | 1.0–2.0 | 1.0–2.0 | 790 | $2,500 | $3.16 | 21d | 2 | 0.26mi |
| 801 Westview Dr Sedro Woolley, WA | 3.0–4.0 | 2.5 | 1290 | $2,100 | $1.63 | 21d | 8 | 0.38mi |
| 413 Rowland Rd Sedro Woolley, WA | 2.0 | 2.0 | 980 | $1,900 | $1.94 | 44d | 1 | 0.80mi |
| 320 Birchwood Ln Sedro-Woolley, WA | 3.0 | 2.5 | 1400 | $2,500 | $1.79 | 44d | 1 | 0.99mi |
| 1129 State St Unit 11292 Sedro-Woolley, WA | 2.0 | 1.0 | 1054 | $1,850 | $1.76 | 44d | 1 | 1.32mi |
| 1133 Wicker Rd Sedro Woolley, WA | 1.0–2.0 | 1.0 | 725 | $1,695 | $2.34 | 21d | 3 | 1.37mi |
Listing history 17 events
-
2026-06-19days on market $129,000 Active 59 DOM
-
2026-06-18days on market $129,000 Active 58 DOM
-
2026-06-17days on market $129,000 Active 57 DOM
-
2026-06-16days on market $129,000 Active 56 DOM
-
2026-06-15days on market $129,000 Active 55 DOM
-
2026-06-14days on market $129,000 Active 53 DOM
-
2026-06-13days on market $129,000 Active 52 DOM
-
2026-06-10days on market $129,000 Active 50 DOM
-
2026-06-09days on market $129,000 Active 49 DOM
-
2026-06-08days on market $129,000 Active 48 DOM
-
2026-06-07days on market $129,000 Active 47 DOM
-
2026-06-05days on market $129,000 Active 44 DOM
-
2026-06-02days on market $129,000 Active 42 DOM
-
2026-06-01days on market $129,000 Active 41 DOM
-
2026-05-31days on market $129,000 Active 40 DOM
-
2026-05-30days on market $129,000 Active 39 DOM
-
2026-04-18$129,000 Active
ⓘ Source: listings_history table (triggers on properties + properties_extension) + one-shot
backfill from property_details.listing_events for pre-trigger history.
Tax reassessment forecast WA · Resets to sale price
- Current annual tax
- $364 · $30/mo
- Projected year-2 tax
- $1,264 · $105/mo
- Expected delta
- +$900/yr (+$75/mo · 247.1%)
ⓘ Screening estimate from a state-policy table — verify with the county assessor before closing.
Climate risk First Street
- Flood 5/10 Major FEMA zone X · 24% chance over 30 yrs
- Wildfire 4/10 Moderate
- Heat 2/10 Low 7 d/yr ≥83°F today · 19 d/yr by 30 yrs out
- Wind 1/10 Low
- Air quality 6/10 Major 9 unhealthy d/yr today · 10 by 30 yrs out
Nearby sold comps map
Loading sold comps map…
Walkable amenities ~0.75 mi
Loading nearby amenities…
Taxation est. · year 1
- Rental income
- $25,936
- − Mortgage interest
- −$7,226
- − Property taxes
- −$364
- − Insurance
- −$645
- − Repairs & maintenance
- −$2,075
- − Management
- −$2,075
- − Depreciation
- −$3,753
- Taxable income
- $9,799
- Est. tax owed @ 24.0%
- −$2,352
- After-tax cash flow
- $9,011/yr
For passive investors: Depreciation is non-cash, so a rental often shows a tax loss while cash-flowing — sheltering income. Rental losses are passive: they offset passive income freely, and up to $25,000/yr can offset ordinary (W-2) income if you actively participate and your MAGI is under $100k (phasing out to $0 by $150k); unused losses carry forward. On sale, claimed depreciation is recaptured at up to 25%, and gains may owe capital-gains tax (a 1031 exchange can defer both). Figures are a year-1 estimate at your 24.0% rate — not tax advice; consult a CPA.
Schools (NCES district)
- District
- Sedro-Woolley School District
- NCES district ID
- 5307740
- Math proficiency
- 47% ▼ -2.00%
- Reading proficiency
- 58% ▬ 0.00%
- Median HH income
- $57,385
- Composite
- 47.45/100
- National rank
- #5005
- State rank
- #117 of 291 in WA
Livability — Sedro-Woolley
No livability data for this city. (Only ~50 U.S. cities are tracked.)
Census & demographics
- Census place
- Sedro-Woolley, WA
- County
- Skagit County · 118,108 people
- Metro
- Mount Vernon-Anacortes, WA
- Population (ZIP)
- 27,835
- Household income
- $93,006
- Rent vs Own
- Severe rent burden
- 502.0
Population outlook (Skagit County) Hauer SSP2
- Today (2025)
- 131,498 people
- By 2030
- 135,556 · +3.1%
- By 2040
- 141,717 · +7.8%
- By 2050
- 145,714 · +10.8%
- By 2075
- 152,201 · +15.7%
- By 2100
- 147,980 · +12.5%
Race, ethnicity, and origin ACS 2023
- Neighborhood character
- Predominantly White (76%)
- Race & ethnicity
- White 76% Hispanic / Latino 14% Two or more races 8% Asian 2% Native American 1%
- Hispanic origin (detail)
- Mexican 12% Puerto Rican 1%
- Common ancestry
- Portuguese 6% Slovak 4% Italian 3%
- Foreign-born
- 5% · Canada, China
- Languages at home
- 88% English-only · Spanish 10% German/W. Germanic 1%
Political lean MEDSL · Skagit
- 2024 margin
- Lean D (+8.9) · D 52.9% · R 44.0% · Other 3.0%
- 2008→2024 swing
- -0.7pp no change · 2008: 9.6pp · 2024: 8.9pp
- All cycles
- 2024: D+8.9 2020: D+7.5 2016: D+3.2 2012: D+5.8 2008: D+9.6
Not yet ingested
- Civics
- —
Market trends
- HPI YoY
- ▲ 43.42%
- Current HPI
- 1280.83
- Rent YoY
- —
- Metro
- Mount Vernon-Anacortes, WA
- State GDP YoY
- ▲ 4.65%
- F500 in state
- 22
Industry mix (Fortune 500 HQ in WA)
| Industry | F500 HQs | Revenue |
|---|---|---|
| Retail | 2 | $269B |
|
||
| Technology / Retail | 1 | $638B |
|
||
| Technology | 1 | $245B |
|
||
| Telecommunications | 1 | $38B |
|
||
| Food / Beverage | 1 | $36B |
|
||
| Automotive / Trucks | 1 | $34B |
|
||
Price history
1 event — show timeline
- 2026-04-18 Listed $129,000 NWMLS as Distributed by MLS Grid
Property tax history
+1.9%/yrLatest (2023): $364 · +19.9% YoY. Source: county tax records.
Cash-flow waterfall
monthlySold comps — $/sqft
last 12 mo · ≤1 miLoading sold comps…