2412 Spiller St · Fort Worth, TX
Flood risk 1/10 · Minimal
- FEMA flood zone
- X (unshaded)
- Chance of flooding over 30 yrs
- 0.0%
- Est. flood insurance / yr
- $507 – $1,088
Fire risk 1/10 · Minimal
- Est. fire insurance / yr
- $1,222 – $2,270
Heat risk 7/10 · Major
- Hot days now (above 109°F)
- 7 days/yr
- Hot days in 30 yrs
- 23 days/yr
Wind risk 5/10 · Moderate
- Chance of severe wind over 30 yrs
- 26.0%
Air-quality risk 3/10 · Minor
- Unhealthy air days now
- 3 days/yr
- Unhealthy air days in 30 yrs
- 4 days/yr
Risk factors via First Street. Map © Google.
Why this score? — see what drove the D grade
The composite is a weighted blend of 9 inputs, each scored 0–100. Each bar is that input's sub-score; the figure is the points it added to the 100-point composite (weight × sub-score).
- Cash flow +12.9/30.0
- Appreciation +10.0/10.0
- Livability +4.0/5.0
- DSCR +3.9/10.0
- ARV discount +3.8/15.0
- 1% rule +3.1/10.0
- Rent growth +2.5/5.0
- Condition / age +2.5/5.0
- Schools +2.0/10.0
$195,000
🖨 Deal sheet (PDF) 📄 Offer letter ✓ Due diligence
Listing remarks MLS
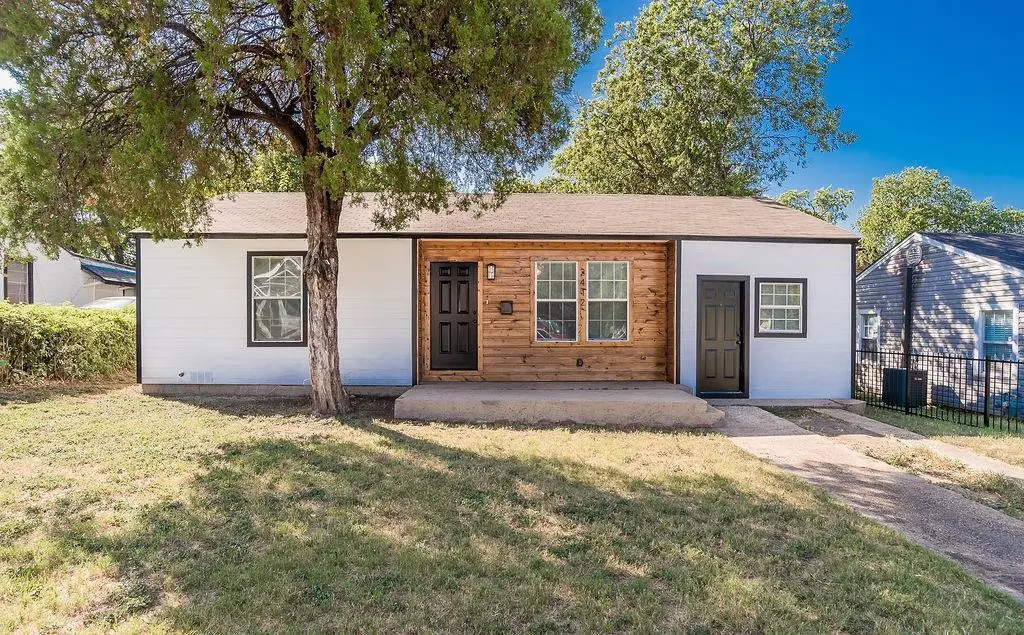
Step into timeless charm blended with contemporary style in this beautifully updated 1950s A-frame home. From the welcoming front porch to the spacious backyard perfect for relaxing or entertaining, every detail has been thoughtfully designed. Inside, enjoy modern finishes and decorative lighting that create a warm and inviting atmosphere. This move-in-ready home offers the perfect balance of character and comfort—ready for its next homeowner to make it their own.
Key facts
- Decorative lighting
- Spacious backyard
- Front porch
Tags
Neighborhood map
What this means for you Summary
Snapshot
- This is a 3-bed/1.0-bath single-family listed at $195k.
Deal economics
- At list price, monthly cash flow is $-13 ($-150/yr) — negative.
- To cash-flow at today's rent, offer at most $193k (1.1% below list).
- To meet the 1% rule (rent ≥ 1% of price), the offer needs to be $158k (18.8% below list).
- Recommended offer: $158k (18.8% below list) — sets the bar for 1% rule.
- Cap rate 6.2% vs local median 3.9% in Fort Worth — top-decile yield for the area; either an underpriced asset or a hidden risk that comps aren't pricing in. Stress-test before assuming the spread holds.
Location & tenants
- Location reads 80/100 on livability (#49 in TX, #1,954 nationally) — a professional / high-income tenant draw. Strengths: amenities A+, cost of living A+, housing A+; Watch: schools D+, crime F.
- Fort Worth ISD (urban): math 18% / reading 28% proficiency, ranked #742 of 826 in TX (top 90%) — low school quality limits family demand, transient renter base, plan for 1-2y turnover; 73% free/reduced lunch — lower-income household profile, screen leases tightly.
- Market conditions: 101 active listings in the ZIP; 35 comparable units currently listed for rent nearby; rentals lingering (median 46d on market — plan ~5-8 weeks vacancy on turnover, expect pricing pressure); 51% of comp listings sitting > 30 days — soft ceiling on asking rent; 18,938 units permitted in Tarrant County in 2024 (8,336 in 5+ unit buildings).
- This rent runs 42% of the median local income ($46k/yr) — at the standard rent-burdened threshold; future hikes will face affordability resistance.
Forward outlook
- In year one you build about $21k of equity ($1k loan paydown + $20k appreciation (10.0% local appreciation)).
- Tarrant County population projected at +41% by 2050 — long-run rental-demand tailwind backs the buy-and-hold thesis.
- At projected returns (10.0% appreciation + 3.0% rent growth), your $55k cash investment doubles in ~3 years — after that, you're playing with house money.
- By year 2, paydown + projected appreciation supports a ~$34k cash-out refi (75% LTV) — recoverable capital for the next deal without selling this one.
Negotiation context
- It's been on market 79 days — a 6% lower offer ($183k) is reasonable based on typical stale-listing flexibility.
- 3 sale attempts with the ask held roughly flat each time — persistent listings suggest the price (not the market) is what's stuck; bring a comps-based counter.
Risks & watch-outs
- Watch-outs: built in 1950 — expect roof / HVAC / electrical / plumbing capex.
- Climate carrying-cost: moderate wind risk, 26% chance of damaging wind over 30y; extreme-heat days projected 7→23/yr by 2055 (HVAC capex compounding) — expect insurance premiums to compound above CPI over the hold.
Questions for the listing agent
- What do current leases actually rent for vs. the listed asking? Can we see a recent rent roll and the last 12 months of T-12 income?
- It's been on market 79 days. Have you received any prior offers? Is the seller open to a 19% concession, seller financing, or rate buy-down credit?
- Built in 1950 — when were the roof, HVAC, electrical panel, plumbing, and water heater last replaced?
- Why hasn't it sold? Are there any deal-killer items the seller is aware of (foundation, flood, title, zoning, code violations)?
- Is there a deadline driving the sale (1031 exchange, divorce, estate, relocation)? That informs how much negotiation room exists.
- Schools are D-rated, which usually means shorter tenancies and higher turnover. Who's the typical renter profile here, and what's been the actual vacancy rate?
- Crime grade is F in this area — have there been break-ins, vandalism, or insurance claims at this property in the last 3 years? What carrier currently insures it and at what premium?
- The area grade is low — what's the realistic commute time and amenity access for the typical tenant pool here? Any planned neighborhood developments (good or bad) we should know about?
- What's the average days-on-market for RENTAL listings here right now (not sales)? A rising rental-DOM trend means longer vacancies and softer asking-rent achievability than the comps imply.
- What's the recent tenant-quality profile in this submarket — average credit score on applications, eviction rate, late-payment / NSF rate, and stable-employment percentage? A property-management company in the area should have these aggregated.
- How much new for-sale + rental construction is in the pipeline within 1–3 miles? Heavy new supply typically softens prices + rents 12–24 months out; constrained supply supports both.
Investment metrics
- 1% rule
- 0.81% ✗
- Cap rate
- 6.22%
- Cash-on-cash
- -0.28%
- DSCR
- 0.99
- GRM
- 10.3
CMA / ARV
- ARV (median comp)
- $180,222
- List price
- $195,000
- Delta
- 8.20%
- Verdict
- FAIR
- Comps
- 20 within 1.0 mi
Show comp detail 12 sales within ~0.75 mi
| Address | Dist | Beds/Ba | Sqft | Sold | Price | $/sf | Match |
|---|---|---|---|---|---|---|---|
| 2412 Spiller St | 0.00mi | 3/1.0 | 1,002 (0%) | 0mo | $195,000 | $195 | 100 |
| 2513 Rattikin Rd | 0.10mi | 3/2.0 | 1,002 (0%) | 14mo | $209,900 | $209 | 79 |
| 2409 Shropshire St | 0.14mi | 3/1.0 | 1,028 (+3%) | 12mo | $178,000 | $173 | 79 |
| 2655 Ash Crescent St | 0.75mi | 3/1.0 | 980 (-2%) | 4mo | $150,000 | $153 | 58 |
| 2417 Spiller St | 0.03mi | 3/1.0 | 864 (-14%) | 23mo | $195,000 | $226 | 57 |
| 3201 Mitchell Blvd | 0.41mi | 3/1.0 | 910 (-9%) | 14mo | $144,000 | $158 | 54 |
| 2909 Dunford St | 0.54mi | 3/1.0 | 1,095 (+9%) | 13mo | $154,600 | $141 | 48 |
| 2913 Dunford St | 0.53mi | 3/1.0 | 1,131 (+13%) | 16mo | $120,000 | $106 | 41 |
| 2329 Wyatt Ct | 0.74mi | 2/1.0 (-1) | 988 (-1%) | 24mo | $225,000 | $228 | 38 |
| 2408 Stephen Lee | 0.68mi | 3/2.0 | 1,061 (+6%) | 20mo | $215,000 | $203 | 38 |
| 2720 Thannisch Ave | 0.56mi | 3/2.0 | 878 (-12%) | 16mo | $175,000 | $199 | 36 |
| 2809 E Berry St | 0.50mi | 2/1.0 (-1) | 868 (-13%) | 24mo | $150,000 | $173 | 30 |
Match score weights: distance 35% · size 25% · config 20% · recency 20%. Top-matched comps best support the ARV.
Projected returns pro-forma
10.0% appreciation · 3.0% rent growth · sell at horizon
- IRR
- 24.1%
- Equity multiple
- 2.93×
- Total profit
- $105,377
- Equity at exit
- $175,671
- IRR
- 21.3%
- Equity multiple
- 6.69×
- Total profit
- $310,890
- Equity at exit
- $378,842
Cash invested: $54,600 (down + closing). Projections, not guarantees.
Landlord ↔ Tenant lean methodology
- Overall (STATE)
- 87 Strongly Landlord-Friendly
- State Texas
- 87 Strongly Landlord-Friendly · R+5
- County
- — inherits STATE
- City
- — inherits STATE
ZIP-level market 76105
- Home prices YoY
- 14.2%
- Active inventory
- 101
- Price-to-rent
- 10.3×
Monthly cashflow live
- Estimated rent
- $1,584 high interval (Pro) →
- Mortgage (P&I)
- −$1,023
- Tax from tax record
- −$160 /mo · $1,924/yr
- Insurance
- −$81
- HOA
- −$0
- Vacancy / Maint / Mgmt
- −$333
- Net cashflow
- $-13
Break-even live
Sensitivity live
| Price | -10% $98 | -5% $43 | +0% $-13 | +5% $-68 | +10% $-123 |
|---|---|---|---|---|---|
| Rent | -10% $-138 | -5% $-75 | +0% $-13 | +5% $50 | +10% $113 |
| Rate | -1.0pp $86 | -0.5pp $37 | base $-13 | +0.5pp $-63 | +1.0pp $-114 |
UW: 25.0% down · 7.5% · 30yr · 1.5% tax · 5.0% vac · 8.0% maint · 8.0% mgmt
Financing live
Cash to close
- Down payment
- $48,750
- Closing costs
- $5,850
- Reserves months
- —
- Total cash needed
- —
Loan-product check · same deal, 3 products live
Conventional
25% down · 7.5% · 30yr
- Down + closing
- —
- Monthly P&I
- —
- Monthly cashflow
- —
- DSCR
- —
- Eligible?
- —
Personal DTI + credit; lowest rate.
DSCR
20% down · 8.5% · 30yr
- Down + closing
- —
- Monthly P&I
- —
- Monthly cashflow
- —
- DSCR
- —
- Eligible?
- —
No personal income docs; deal must DSCR.
Hard money
10% down · 12.0% · 12mo
- Down + closing
- —
- Monthly P&I
- —
- Monthly cashflow
- —
- DSCR
- —
- Eligible?
- —
Short-term bridge; refi at stabilization.
Rent comps 35 comps
| Address | Beds | Baths | Sqft | Rent | $/sqft | DOM | Units | Dist |
|---|---|---|---|---|---|---|---|---|
| 2509 Spiller St Fort Worth, TX | 2.0 | 1.0 | 720 | $1,400 | $1.94 | 46d | 1 | 0.07mi |
| 2509 Spiller St Fort Worth, TX | 2.0 | 2.0 | 720 | $1,300 | $1.81 | 17d | 1 | 0.07mi |
| 2201 E Berry St Unit 0211 Fort Worth, TX | 2.0 | 1.0 | 795 | $1,200 | $1.51 | 19d | 1 | 0.49mi |
| 2705 Belzise Ter Fort Worth, TX | 2.0 | 2.0 | 1160 | $1,450 | $1.25 | 46d | 1 | 0.61mi |
| 3155 N Glen Garden Dr Fort Worth, TX | 3.0 | 2.0 | 1254 | $1,995 | $1.59 | 6d | 1 | 0.66mi |
| 3211 Montague St Fort Worth, TX | 3.0 | 2.0 | 1460 | $1,999 | $1.37 | 46d | 1 | 0.72mi |
| 2640 Berryhill Dr Fort Worth, TX | 2.0 | 1.0 | 1478 | $1,299 | $0.88 | 26d | 1 | 0.72mi |
| 2645 Canberra Ct Fort Worth, TX | 2.0 | 1.0 | 750 | $1,150 | $1.53 | 46d | 1 | 0.74mi |
| 2333 Wyatt Ct Fort Worth, TX | 3.0 | 1.5 | 1280 | $1,795 | $1.40 | 1d | 1 | 0.77mi |
| 2825 Bideker Ave Fort Worth, TX | 3.0 | 1.0 | 900 | $1,500 | $1.67 | 26d | 1 | 0.81mi |
| 1608 E Robert St Fort Worth, TX | 3.0 | 2.0 | 1028 | $1,525 | $1.48 | 8d | 1 | 0.82mi |
| 1516 Chama Dr Fort Worth, TX | 3.0 | 2.0 | 1332 | $1,695 | $1.27 | 23d | 1 | 0.86mi |
| 1718 E Powell Ave Fort Worth, TX | 2.0 | 1.5 | 930 | $1,655 | $1.78 | 46d | 1 | 0.92mi |
| 1429 E Robert St Fort Worth, TX | 3.0 | 2.0 | 1050 | $1,350 | $1.29 | 24d | 1 | 0.96mi |
| 3211 Bideker Ave Fort Worth, TX | 2.0 | 1.0 | 844 | $1,649 | $1.95 | 46d | 1 | 0.97mi |
| 2939 Timberline Dr Fort Worth, TX | 3.0 | 2.0 | 1294 | $2,000 | $1.55 | 46d | 1 | 0.97mi |
| 2104 Daniel St Fort Worth, TX | 3.0 | 2.0 | 1440 | $1,675 | $1.16 | 46d | 1 | 1.11mi |
| 3421 Bright St Unit 3421 Fort Worth, TX | 3.0 | 1.0 | 900 | $1,375 | $1.53 | 46d | 1 | 1.17mi |
| 1212 Lowden Cir Fort Worth, TX | 2.0 | 1.0 | 890 | $970 | $1.09 | 46d | 1 | 1.17mi |
| 3536 S Littlejohn Ave Unit B Fort Worth, TX | 2.0 | 1.0 | 762 | $1,050 | $1.38 | 46d | 1 | 1.24mi |
| 2912 Avenue K Fort Worth, TX | 3.0 | 1.5 | 1200 | $1,600 | $1.33 | 46d | 1 | 1.26mi |
| 3114 Avenue L Unit 3114 Fort Worth, TX | 3.0 | 1.5 | 860 | $1,350 | $1.57 | 46d | 1 | 1.27mi |
| 2909 Avenue K Fort Worth, TX | 3.0 | 2.0 | 1490 | $700 | $0.47 | 46d | 1 | 1.29mi |
| 3229 Denman St Fort Worth, TX | 3.0 | 1.0 | 1236 | $1,550 | $1.25 | 12d | 1 | 1.30mi |
| 2905 Pioneer St Fort Worth, TX | 3.0 | 1.0 | 1212 | $2,000 | $1.65 | 46d | 1 | 1.33mi |
| 3758 Donalee St Fort Worth, TX | 3.0 | 1.0 | 720 | $1,395 | $1.94 | 46d | 1 | 1.34mi |
| 2837 Avenue J Unit J Fort Worth, TX | 3.0 | 1.5 | 1000 | $1,455 | $1.46 | 26d | 1 | 1.34mi |
| 2839 Avenue J Unit J Fort Worth, TX | 3.0 | 1.5 | 1000 | $1,455 | $1.46 | 26d | 1 | 1.34mi |
| 1108 E Robert St Fort Worth, TX | 3.0 | 1.0 | 1444 | $1,775 | $1.23 | 1d | 1 | 1.36mi |
| 1037 Colvin St Fort Worth, TX | 2.0 | 1.0 | 1092 | $1,500 | $1.37 | 22d | 1 | 1.39mi |
| 1327 E Baltimore Ave Fort Worth, TX | 3.0 | 2.0 | 1426 | $1,650 | $1.16 | 26d | 1 | 1.40mi |
| 2201 Sims Dr Fort Worth, TX | 3.0 | 2.0 | 1170 | $1,650 | $1.41 | 46d | 1 | 1.43mi |
| 1516 E Maddox Ave Fort Worth, TX | 3.0 | 2.0 | 1485 | $1,895 | $1.28 | 24d | 1 | 1.45mi |
| 3233 New York Ave Fort Worth, TX | 3.0 | 1.0 | 1040 | $1,400 | $1.35 | 4d | 1 | 1.48mi |
| 1011 Marion Ave Fort Worth, TX | 2.0 | 1.0 | 1000 | $1,400 | $1.40 | 46d | 1 | 1.50mi |
Listing history 11 events
-
2026-05-18historical Active Option Contract 474-char remark
Show marketing remark (474 chars)
Step into timeless charm blended with contemporary style in this beautifully updated 1950s A-frame home. From the welcoming front porch to the spacious backyard perfect for relaxing or entertaining, every detail has been thoughtfully designed. Inside, enjoy modern finishes and decorative lighting that create a warm and inviting atmosphere. This move-in-ready home offers the perfect balance of character and comfort—ready for its next homeowner to make it their own.
-
2026-03-09$195,000 Active 474-char remark
Show marketing remark (474 chars)
Step into timeless charm blended with contemporary style in this beautifully updated 1950s A-frame home. From the welcoming front porch to the spacious backyard perfect for relaxing or entertaining, every detail has been thoughtfully designed. Inside, enjoy modern finishes and decorative lighting that create a warm and inviting atmosphere. This move-in-ready home offers the perfect balance of character and comfort—ready for its next homeowner to make it their own.
-
2026-02-07historical
-
2026-02-02status Active
-
2026-01-31historical
-
2025-10-15price $195,000
-
2025-09-04price $205,000
-
2025-08-22$219,000 Active
-
2007-06-12soldstatus
-
2007-06-12soldstatus
-
1992-07-07soldstatus
ⓘ Source: listings_history table (triggers on properties + properties_extension) + one-shot
backfill from property_details.listing_events for pre-trigger history.
Tax reassessment forecast TX · Resets to sale price
- Current annual tax
- $1,924 · $160/mo
- Projected year-2 tax
- $3,568 · $297/mo
- Expected delta
- +$1,645/yr (+$137/mo · 85.5%)
ⓘ Screening estimate from a state-policy table — verify with the county assessor before closing.
Climate risk First Street
- Flood 1/10 Low FEMA zone X (unshaded) · 0% chance over 30 yrs
- Wildfire 1/10 Low
- Heat 7/10 Severe 7 d/yr ≥109°F today · 23 d/yr by 30 yrs out
- Wind 5/10 Major 26% chance of damaging wind over 30 yrs
- Air quality 3/10 Moderate 3 unhealthy d/yr today · 4 by 30 yrs out
Nearby sold comps map
Loading sold comps map…
Walkable amenities ~0.75 mi
Loading nearby amenities…
Taxation est. · year 1
- Rental income
- $19,012
- − Mortgage interest
- −$10,923
- − Property taxes
- −$1,924
- − Insurance
- −$975
- − Repairs & maintenance
- −$1,521
- − Management
- −$1,521
- − Depreciation
- −$5,673
- Taxable loss
- −$3,524
- Est. tax savings @ 24.0%
- +$846
- After-tax cash flow
- $695/yr
For passive investors: Depreciation is non-cash, so a rental often shows a tax loss while cash-flowing — sheltering income. Rental losses are passive: they offset passive income freely, and up to $25,000/yr can offset ordinary (W-2) income if you actively participate and your MAGI is under $100k (phasing out to $0 by $150k); unused losses carry forward. On sale, claimed depreciation is recaptured at up to 25%, and gains may owe capital-gains tax (a 1031 exchange can defer both). Figures are a year-1 estimate at your 24.0% rate — not tax advice; consult a CPA.
Schools (NCES district)
- District
- Fort Worth ISD
- NCES district ID
- 4819700
- Math proficiency
- 18% ▼ -16.00%
- Reading proficiency
- 28% ▼ -6.00%
- Median HH income
- $42,109
- Composite
- 19.61/100
- National rank
- #8753
- State rank
- #742 of 826 in TX
Livability — Fort Worth
- Score
- 80/100
- State rank
- #49
- US rank
- #1954
Category grades
Schools grade is shown separately in the Schools card above.
Census & demographics
- Census place
- Fort Worth, TX
- County
- Tarrant County · 2,033,669 people
- City population
- 911,619
- Metro
- Dallas-Fort Worth-Arlington, TX
- Population (ZIP)
- 22,228
- Household income
- $45,770
- Rent vs Own
- Severe rent burden
- 884.0
Population outlook (Tarrant County) Hauer SSP2
- Today (2025)
- 2,380,417 people
- By 2030
- 2,578,900 · +8.3%
- By 2040
- 2,974,995 · +25.0%
- By 2050
- 3,350,489 · +40.8%
- By 2075
- 4,216,909 · +77.2%
- By 2100
- 4,741,527 · +99.2%
Race, ethnicity, and origin ACS 2023
- Neighborhood character
- Majority Hispanic (63%)
- Race & ethnicity
- Hispanic / Latino 63% Black 29% Two or more races 24% White 6%
- Hispanic origin (detail)
- Mexican 57%
- Foreign-born
- 28% · Canada
- Languages at home
- 44% English-only · Spanish 55% Other Indo-European 1%
Political lean MEDSL · Tarrant
- 2024 margin
- Lean R (+5.1) · D 46.7% · R 51.9% · Other 1.4%
- 2008→2024 swing
- +6.6pp toward D · 2008: -11.7pp · 2024: -5.1pp
- All cycles
- 2024: R+5.1 2020: D+0.2 2016: R+8.7 2012: R+15.7 2008: R+11.7
Not yet ingested
- Civics
- —
Market trends
- HPI YoY
- ▲ 27.33%
- Current HPI
- 219.2657
- Rent YoY
- —
- Metro
- Dallas-Fort Worth-Arlington, TX
- State GDP YoY
- ▲ 3.95%
- F500 in state
- 110
Industry mix (Fortune 500 HQ in TX)
| Industry | F500 HQs | Revenue |
|---|---|---|
| Energy | 16 | $1,198B |
|
||
| Technology | 5 | $198B |
|
||
| Engineering / Construction | 4 | $72B |
|
||
| Energy Services | 3 | $60B |
|
||
| Utilities | 3 | $41B |
|
||
| Healthcare | 2 | $330B |
|
||
Price history
-11.0% since first listed11 events — show timeline
- 2026-05-18 Contingent — NTREIS
- 2026-03-09 Listed $195,000 NTREIS
- 2026-02-07 Listing Removed — NTREIS
- 2026-02-02 Relisted — NTREIS
- 2026-01-31 Listing Removed — NTREIS
- 2025-10-15 Price Changed $195,000 NTREIS
- 2025-09-04 Price Changed $205,000 NTREIS
- 2025-08-22 Listed $219,000 NTREIS
- 2007-06-12 Sold (Public Records) — Public Records
- 2007-06-12 Sold (Public Records) — Public Records
- 1992-07-07 Sold (Public Records) — Public Records
Property tax history
+7.7%/yrLatest (2025): $1,924 · -2.4% YoY. Source: county tax records.
Cash-flow waterfall
monthlySold comps — $/sqft
last 12 mo · ≤1 miLoading sold comps…