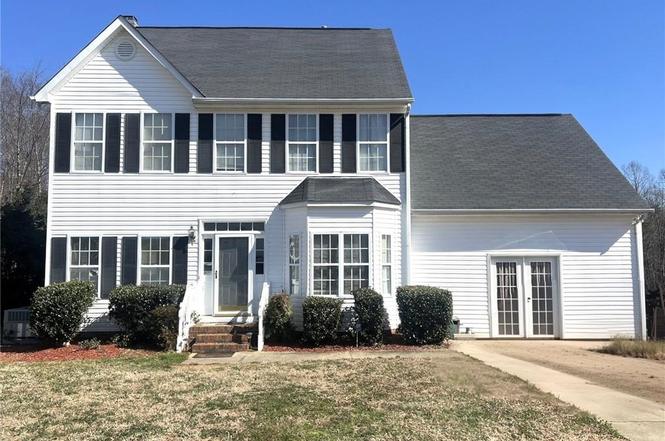
4504 Laurel Run Dr · Greensboro, NC
Flood risk 1/10 · Minimal
- FEMA flood zone
- X (unshaded)
- Chance of flooding over 30 yrs
- 0.0%
- Est. flood insurance / yr
- $507 – $1,088
Fire risk 3/10 · Minor
- Est. fire insurance / yr
- $906 – $1,684
Heat risk 5/10 · Moderate
- Hot days now (above 102°F)
- 7 days/yr
- Hot days in 30 yrs
- 18 days/yr
Wind risk 4/10 · Minor
- Chance of severe wind over 30 yrs
- 12.0%
Air-quality risk 2/10 · Minimal
- Unhealthy air days now
- 1 days/yr
- Unhealthy air days in 30 yrs
- 2 days/yr
Risk factors via First Street. Map © Google.
Why this score? — see what drove the D+ grade
The composite is a weighted blend of 9 inputs, each scored 0–100. Each bar is that input's sub-score; the figure is the points it added to the 100-point composite (weight × sub-score).
- ARV discount +15.0/15.0
- Cash flow +11.8/30.0
- Livability +4.0/5.0
- Rent growth +3.9/5.0
- Schools +3.6/10.0
- DSCR +3.5/10.0
- 1% rule +2.6/10.0
- Condition / age +2.5/5.0
- Appreciation +0.0/10.0
$339,900
🖨 Deal sheet (PDF) 📄 Offer letter ✓ Due diligence
Listing remarks
Welcome to this two-story home, offering a perfect blend of elegance, functionality, and outdoor beauty! As you step inside to the grand entryway, it will lead you into a spacious living room with a soaring two-story foyer. The bonus room on the main floor offers endless possibilities and can be converted back into a garage. The spacious primary suite offers an en suite and is conveniently located on the main level. Step outside onto the deck, where you’ll find a charming gazebo nestled just beyond it. The deck leads down to a large concrete patio, perfect for entertaining, with a concrete sidewalk that wraps around the house to meet the patio.
Key facts
- 0.3 acre lot
- Built 2000
- Listed 401 days
Property features AI
Finance
- HOA & community: Laurel Run subdivision; HOA fees $50 per month
Exterior
- Parking: Driveway
- Utilities: Public water; Public sewer; Gas water heater
- Home design: Residential stick/site-built house; Two levels; Built in 2000; Living room fireplace
- Construction: Vinyl siding; Crawl space foundation
- Exterior features: No fencing; Subdivision lot; Gazebo; Storage structure; No pool
Interior
- Flooring: Carpet; Vinyl; Wood
- Bathrooms: 2 full bathrooms; 1 half bathroom
- Heating & cooling: Central air conditioning; Forced air heating (natural gas)
- Interior features: Soaking tub; Vaulted ceilings
- Laundry & utility: Washer hookup; Dryer connection; Gas water heater
Neighborhood map
What this means for you Summary
Snapshot
- This is a 4-bed/3.5-bath single-family listed at $340k.
Deal economics
- At list price, monthly cash flow is $-95 ($-1k/yr) — negative.
- To cash-flow at today's rent, offer at most $323k (4.9% below list).
- To meet the 1% rule (rent ≥ 1% of price), the offer needs to be $258k (24.1% below list).
- Recommended offer: $258k (24.1% below list) — sets the bar for 1% rule.
- Cap rate 6.0% vs local median 3.7% in Greensboro — top-decile yield for the area; either an underpriced asset or a hidden risk that comps aren't pricing in. Stress-test before assuming the spread holds.
Location & tenants
- Location reads 81/100 on livability (#12 in NC, #1,335 nationally) — a professional / high-income tenant draw. Strengths: amenities A+, commute A+, cost of living A+; Watch: employment D, crime F.
- Guilford County Schools (urban): math 39% / reading 45% proficiency, ranked #99 of 178 in NC (top 56%) — families likely to look elsewhere, expect single-tenant / working-renter base with shorter leases.
- Zoned schools: Summerfield Elementary (math 74% / reading 75%, grade A, #58 of 1,410 statewide, top 5%, 568 students, 25% FRL); Kernodle Middle (math 62% / reading 60%, grade B+, #40 of 475 statewide, top 9%, 745 students, 40% FRL); Northwest Guilford High (math 72% / reading 64%, grade B, #137 of 535 statewide, top 26%, 1,991 students, 18% FRL) — zoned schools average 28% FRL vs 52% district-wide (25 pts lower); this property's tenant base skews higher-income than the district average.
- Zoned-school proficiency averages 68% at this address vs 42% district-wide (+26 pts) — the actual schools serving this property are materially stronger than the Guilford County Schools average implies; a family-tenant draw the district grade alone would hide.
- Market conditions: Rents rising fast (+5.6%/yr); 336 active listings in the ZIP; 3 comparable units currently listed for rent nearby; rentals at typical pace (median 26d on market — plan ~3-4 weeks tenant-placement turnaround); solid renter incomes; 3,843 units permitted in Guilford County in 2024 (2,397 in 5+ unit buildings).
- This rent runs 36% of the median local income ($85k/yr) — at the standard rent-burdened threshold; future hikes will face affordability resistance.
Forward outlook
- Local home prices are declining (-3.0%/yr); year-one equity from $2k of loan paydown is wiped out by about $10k of value loss. Plan a longer hold.
- Guilford County population projected at +26% by 2050 — long-run rental-demand tailwind backs the buy-and-hold thesis.
Negotiation context
- It's been on market 401 days — a 12% lower offer ($299k) is reasonable based on typical stale-listing flexibility.
- 4 sale attempts; this cycle's ask has dropped $100k (23%) from the opening price — seller is motivated, your offer sets the floor, not the list.
Risks & watch-outs
- Climate carrying-cost: extreme-heat days projected 7→18/yr by 2055 (HVAC capex compounding) — expect insurance premiums to compound above CPI over the hold.
Questions for the listing agent
- What do current leases actually rent for vs. the listed asking? Can we see a recent rent roll and the last 12 months of T-12 income?
- It's been on market 401 days. Have you received any prior offers? Is the seller open to a 24% concession, seller financing, or rate buy-down credit?
- What does the HOA fee cover, when was the last increase, and are there any pending special assessments or reserve-fund shortfalls?
- Why hasn't it sold? Are there any deal-killer items the seller is aware of (foundation, flood, title, zoning, code violations)?
- Is there a deadline driving the sale (1031 exchange, divorce, estate, relocation)? That informs how much negotiation room exists.
- Crime grade is F in this area — have there been break-ins, vandalism, or insurance claims at this property in the last 3 years? What carrier currently insures it and at what premium?
- The area grade is low — what's the realistic commute time and amenity access for the typical tenant pool here? Any planned neighborhood developments (good or bad) we should know about?
- What's the average days-on-market for RENTAL listings here right now (not sales)? A rising rental-DOM trend means longer vacancies and softer asking-rent achievability than the comps imply.
- What's the recent tenant-quality profile in this submarket — average credit score on applications, eviction rate, late-payment / NSF rate, and stable-employment percentage? A property-management company in the area should have these aggregated.
- How much new for-sale + rental construction is in the pipeline within 1–3 miles? Heavy new supply typically softens prices + rents 12–24 months out; constrained supply supports both.
Investment metrics
- 1% rule
- 0.76% ✗
- Cap rate
- 5.96%
- Cash-on-cash
- -1.20%
- DSCR
- 0.95
- GRM
- 11.0
CMA / ARV
- ARV (on-the-fly)
- $418,258
- Comps found
- 3
Show comp detail 3 sales within ~0.75 mi
| Address | Dist | Beds/Ba | Sqft | Sold | Price | $/sf | Match |
|---|---|---|---|---|---|---|---|
| 4504 Laurel Run Dr | 0.00mi | 4/2.5 | 2,560 (-0%) | 1mo | $295,000 | $115 | 95 |
| 3202 Coronet Ct | 0.15mi | 3/2.5 (-1) | 2,233 (-13%) | 6mo | $365,000 | $163 | 57 |
| 5126 White Horse Dr | 0.66mi | 3/2.5 (-1) | 2,215 (-14%) | 11mo | $479,000 | $216 | 28 |
Match score weights: distance 35% · size 25% · config 20% · recency 20%. Top-matched comps best support the ARV.
Projected returns pro-forma
-3.0% appreciation · 5.57% rent growth · sell at horizon
- IRR
- -15.7%
- Equity multiple
- 0.43×
- Total profit
- $-54,388
- Equity at exit
- $50,680
- IRR
- -3.7%
- Equity multiple
- 0.73×
- Total profit
- $-25,938
- Equity at exit
- $29,388
Cash invested: $95,172 (down + closing). Projections, not guarantees.
Landlord ↔ Tenant lean methodology
- Overall (STATE)
- 85 Strongly Landlord-Friendly
- State North Carolina
- 85 Strongly Landlord-Friendly · R+3
- County
- — inherits STATE
- City
- — inherits STATE
ZIP-level market 27410
- Rents YoY
- 5.6%
- Active inventory
- 336
- Price-to-rent
- 11.0×
Monthly cashflow live
- Estimated rent
- $2,581 medium interval (Pro) →
- Mortgage (P&I)
- −$1,782
- Tax from tax record
- −$160 /mo · $1,917/yr
- Insurance
- −$142
- HOA
- −$50
- Lot rent
- −$0
- Vacancy / Maint / Mgmt
- −$542
- Net cashflow
- $-95
Break-even live
Sensitivity live
| Price | -10% $97 | -5% $1 | +0% $-95 | +5% $-191 | +10% $-288 |
|---|---|---|---|---|---|
| Rent | -10% $-299 | -5% $-197 | +0% $-95 | +5% $7 | +10% $109 |
| Rate | -1.0pp $76 | -0.5pp $-9 | base $-95 | +0.5pp $-183 | +1.0pp $-273 |
UW: 25.0% down · 7.5% · 30yr · 1.5% tax · 5.0% vac · 8.0% maint · 8.0% mgmt
Financing live
Cash to close
- Down payment
- $84,975
- Closing costs
- $10,197
- Reserves months
- —
- Total cash needed
- —
Loan-product check · same deal, 3 products live
Conventional
25% down · 7.5% · 30yr
- Down + closing
- —
- Monthly P&I
- —
- Monthly cashflow
- —
- DSCR
- —
- Eligible?
- —
Personal DTI + credit; lowest rate.
DSCR
20% down · 8.5% · 30yr
- Down + closing
- —
- Monthly P&I
- —
- Monthly cashflow
- —
- DSCR
- —
- Eligible?
- —
No personal income docs; deal must DSCR.
Hard money
10% down · 12.0% · 12mo
- Down + closing
- —
- Monthly P&I
- —
- Monthly cashflow
- —
- DSCR
- —
- Eligible?
- —
Short-term bridge; refi at stabilization.
Rent comps 3 comps
| Address | Beds | Baths | Sqft | Rent | $/sqft | DOM | Units | Dist |
|---|---|---|---|---|---|---|---|---|
| 3601 Giovanni Way Greensboro, NC | 3.0 | 3.0 | 2800 | $2,800 | $1.00 | 25d | 1 | 0.21mi |
| 3601 Giovanni Way Greensboro, NC | 3.0 | 3.0 | 2800 | $2,800 | $1.00 | 21d | 1 | 0.21mi |
| 3908 Siena Ter Greensboro, NC | 3.0 | 2.5 | 2038 | $2,200 | $1.08 | 25d | 1 | 0.50mi |
HOA detail
- Monthly dues
- $50 · $600/yr
Listing history 21 events
-
2026-05-22status Pending
-
2026-04-23historical Due Diligence Period
-
2026-04-23status Active
-
2026-04-13status Pending
-
2026-03-31historical Due Diligence Period
-
2026-01-22price $339,900
-
2026-01-03price $348,900
-
2025-11-30status Active
-
2025-11-25status Pending
-
2025-11-18historical Due Diligence Period
-
2025-10-15price $358,900
-
2025-09-25price $368,000
-
2025-09-25status Active
-
2025-08-23status Pending
-
2025-07-28historical Due Diligence Period
-
2025-06-26price $384,900
-
2025-06-10price $389,900
-
2025-05-05price $399,900
-
2025-03-12price $429,900
-
2025-02-26$439,900 Active
-
2025-02-26historical $439,900
ⓘ Source: listings_history table (triggers on properties + properties_extension) + one-shot
backfill from property_details.listing_events for pre-trigger history.
Tax reassessment forecast NC · Resets to sale price
- Current annual tax
- $1,917 · $160/mo
- Projected year-2 tax
- $2,787 · $232/mo
- Expected delta
- +$870/yr (+$73/mo · 45.4%)
ⓘ Screening estimate from a state-policy table — verify with the county assessor before closing.
Climate risk First Street
- Flood 1/10 Low FEMA zone X (unshaded) · 0% chance over 30 yrs
- Wildfire 3/10 Moderate
- Heat 5/10 Major 7 d/yr ≥102°F today · 18 d/yr by 30 yrs out
- Wind 4/10 Moderate 12% chance of damaging wind over 30 yrs
- Air quality 2/10 Low 1 unhealthy d/yr today · 2 by 30 yrs out
Nearby sold comps map
Loading sold comps map…
Walkable amenities ~0.75 mi
Loading nearby amenities…
Taxation est. · year 1
- Rental income
- $30,967
- − Mortgage interest
- −$19,040
- − Property taxes
- −$1,917
- − Insurance
- −$1,700
- − Repairs & maintenance
- −$2,477
- − Management
- −$2,477
- − HOA
- −$600
- − Depreciation
- −$9,888
- Taxable loss
- −$7,132
- Est. tax savings @ 24.0%
- +$1,712
- After-tax cash flow
- $570/yr
For passive investors: Depreciation is non-cash, so a rental often shows a tax loss while cash-flowing — sheltering income. Rental losses are passive: they offset passive income freely, and up to $25,000/yr can offset ordinary (W-2) income if you actively participate and your MAGI is under $100k (phasing out to $0 by $150k); unused losses carry forward. On sale, claimed depreciation is recaptured at up to 25%, and gains may owe capital-gains tax (a 1031 exchange can defer both). Figures are a year-1 estimate at your 24.0% rate — not tax advice; consult a CPA.
Schools (NCES district)
- District
- Guilford County Schools
- NCES district ID
- 3701920
- Math proficiency
- 39% ▲ 1.00%
- Reading proficiency
- 45% ▲ 1.00%
- Median HH income
- $46,315
- Composite
- 35.78/100
- National rank
- #4842
- State rank
- #99 of 178 in NC
Livability — Greensboro
- Score
- 81/100
- State rank
- #12
- US rank
- #1335
Category grades
Schools grade is shown separately in the Schools card above.
Census & demographics
- Census place
- Greensboro, NC
- County
- Guilford County · 487,190 people
- City population
- 329,421
- Metro
- Greensboro-High Point, NC
- Population (ZIP)
- 54,921
- Household income
- $85,291
- Rent vs Own
- Severe rent burden
- 2696.0
Population outlook (Guilford County) Hauer SSP2
- Today (2025)
- 584,596 people
- By 2030
- 616,851 · +5.5%
- By 2040
- 678,451 · +16.1%
- By 2050
- 734,788 · +25.7%
- By 2075
- 862,985 · +47.6%
- By 2100
- 948,704 · +62.3%
Race, ethnicity, and origin ACS 2023
- Neighborhood character
- Predominantly White (68%)
- Race & ethnicity
- White 68% Black 15% Two or more races 8% Hispanic / Latino 7% Asian 5%
- Hispanic origin (detail)
- Mexican 2% Puerto Rican 2%
- Common ancestry
- Italian 3% Serbian 3% Slovak 3%
- Foreign-born
- 11% · Canada, South Korea, China
- Languages at home
- 86% English-only · Spanish 4% Other Indo-European 3% Other Asian/Pacific 1%
Political lean MEDSL · Guilford
- 2024 margin
- Strong D (+21.8) · D 60.2% · R 38.4% · Other 1.4%
- 2008→2024 swing
- +3.5pp toward D · 2008: 18.4pp · 2024: 21.8pp
- All cycles
- 2024: D+21.8 2020: D+23.1 2016: D+20.0 2012: D+16.5 2008: D+18.4
Not yet ingested
- Civics
- —
Market trends
- HPI YoY
- ▼ -245.81%
- Current HPI
- 222.1685
- Rent YoY
- ▲ 5.57%
- Metro
- Greensboro-High Point, NC
- State GDP YoY
- ▲ 3.28%
- F500 in state
- 26
Industry mix (Fortune 500 HQ in NC)
| Industry | F500 HQs | Revenue |
|---|---|---|
| Financial Services | 2 | $213B |
|
||
| Retail | 2 | $95B |
|
||
| Industrial Conglomerate | 1 | $38B |
|
||
| Metals / Steel | 1 | $35B |
|
||
| Utilities | 1 | $30B |
|
||
| Industrial Machinery | 1 | $19B |
|
||
Price history
-22.7% since first listed21 events — show timeline
- 2026-05-22 Pending — Triad MLS
- 2026-04-23 Contingent — Triad MLS
- 2026-04-23 Relisted — Triad MLS
- 2026-04-13 Pending — Triad MLS
- 2026-03-31 Contingent — Triad MLS
- 2026-01-22 Price Changed $339,900 Triad MLS
- 2026-01-03 Price Changed $348,900 Triad MLS
- 2025-11-30 Relisted — Triad MLS
- 2025-11-25 Pending — Triad MLS
- 2025-11-18 Contingent — Triad MLS
- 2025-10-15 Price Changed $358,900 Triad MLS
- 2025-09-25 Price Changed $368,000 Triad MLS
- 2025-09-25 Relisted — Triad MLS
- 2025-08-23 Pending — Triad MLS
- 2025-07-28 Contingent — Triad MLS
- 2025-06-26 Price Changed $384,900 Triad MLS
- 2025-06-10 Price Changed $389,900 Triad MLS
- 2025-05-05 Price Changed $399,900 Triad MLS
- 2025-03-12 Price Changed $429,900 Triad MLS
- 2025-02-26 Listed $439,900 Triad MLS
- 2025-02-26 Coming Soon $439,900 Triad MLS
Property tax history
-4.2%/yrLatest (2025): $1,917 · -1.0% YoY. Source: county tax records.
Cash-flow waterfall
monthlySold comps — $/sqft
last 12 mo · ≤1 miLoading sold comps…