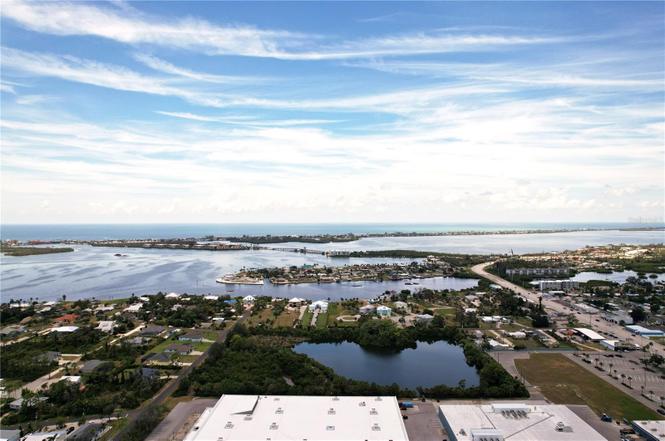
1531 Placida Rd #204 · Englewood, FL
Flood risk 7/10 · Major
- FEMA flood zone
- X (shaded)
- Chance of flooding over 30 yrs
- 0.96%
- Est. flood insurance / yr
- $507 – $1,088
Fire risk 3/10 · Minor
- Est. fire insurance / yr
- $947 – $1,759
Heat risk 10/10 · Severe
- Hot days now (above 107°F)
- 7 days/yr
- Hot days in 30 yrs
- 31 days/yr
Wind risk 10/10 · Severe
- Chance of severe wind over 30 yrs
- 99.0%
Air-quality risk 2/10 · Minimal
- Unhealthy air days now
- 1 days/yr
- Unhealthy air days in 30 yrs
- 1 days/yr
Risk factors via First Street. Map © Google.
Why this score? — see what drove the C grade
The composite is a weighted blend of 9 inputs, each scored 0–100. Each bar is that input's sub-score; the figure is the points it added to the 100-point composite (weight × sub-score).
- Cash flow +21.4/30.0
- 1% rule +8.3/10.0
- ARV discount +7.5/15.0
- DSCR +6.8/10.0
- Rent growth +4.8/5.0
- Schools +4.6/10.0
- Livability +3.7/5.0
- Condition / age +2.5/5.0
- Appreciation +0.0/10.0
$238,000
🖨 Deal sheet 📄 Offer letter ✓ Due diligence
Listing remarks
Location, Location. A Oasis feel. Pres-tine, Newly updated. 2/2. Property has a Wow factor for the dollar. Yes. All new granite counter tops withe new appliances and remolded with crown molding etc. .. All tile through out this condo. Conveniently located close to local amenities, beaches, and Tiki Bars and Live entertainment. The best game fishing in the world with off speed boat racing to spring training baseball teams as The Atlanta Braves and Tampa Rays. Just want to go to the beach or go fishing for the day. Great to do it all with whatever you can dream or do as a hobby. Local International Airports: Fort Myers, Sarasota and local Punta Gorda with Allegiant airlines direct. Many outd
Key facts
- Tile throughout
- New appliances
- Local amenities
Tags
Property features AI
Finance
- Other: Total monthly association fees shown as $550; total annual fees listed as $6,600
- Financial info: Lease restrictions apply
- HOA & community: HOA: Palm Manor; Monthly HOA $550 (Quarterly fee $1,650); Association fees include pool maintenance, structure and grounds maintenance, fidelity bond; Community amenities: clubhouse, pool, shuffleboard court, community mailbox, sidewalks; Buyer/association approval required; Vehicle restrictions and deed restrictions apply; Pets not allowed
Exterior
- Parking: Parking available (building- and community-level parking directions noted)
- Utilities: Public water; Public sewer; Public utilities; Heated in-ground pool
- Home design: Condominium; Single-story building; Unit on 2nd floor; East-facing
- Construction: Concrete construction; Shingle roof; Block foundation; Building identified as #6
- Exterior features: Covered front porch; Sidewalks; Other exterior details
Interior
- Kitchen: Dishwasher; Range; Microwave; Refrigerator
- Bedrooms: 2 bedrooms
- Flooring: Ceramic tile
- Bathrooms: 2 full bathrooms
- Heating & cooling: Electric heating; Central air conditioning
- Interior features: Ceiling fans; Crown molding; Open living/dining area; Walk-in closets; Window treatments (blinds, drapes)
- Laundry & utility: Washer; Dryer; Laundry closet; Dedicated laundry room
Neighborhood map
What this means for you Summary
Snapshot
- This is a 2-bed/2.0-bath condo listed at $238k.
Deal economics
- At list price, monthly cash flow is $287 ($3k/yr) — positive.
- The deal already cash-flows at list — no discount required.
- Meets the 1% rule at list price ($3k rent vs $238k).
- Recommended offer: $209k (12.0% below list) — sets the bar for market timing.
- Cap rate 8.1% vs local median 3.8% in Englewood — top-decile yield for the area; either an underpriced asset or a hidden risk that comps aren't pricing in. Stress-test before assuming the spread holds.
Location & tenants
- Location reads 73/100 on livability (#321 in FL) — a middle-class / working-renter tenant base. Strengths: housing A+, cost of living A, health & safety A; Watch: employment C-, amenities F, commute F.
- Charlotte (suburban): math 54% / reading 54% proficiency, ranked #22 of 73 in FL (top 30%) — acceptable for families but not a draw, mixed tenant base, ~2y average lease.
- Zoned schools: Lemon Bay High School (math 50% / reading 56%, grade C-, #148 of 667 statewide, top 23%, 1,360 students, 28% FRL) — zoned schools average 28% FRL vs 54% district-wide (25 pts lower); this property's tenant base skews higher-income than the district average.
- Market conditions: Rents rising fast (+9.0%/yr); 717 active listings in the ZIP; 13 comparable units currently listed for rent nearby; rentals at typical pace (median 21d on market — plan ~3-4 weeks tenant-placement turnaround); solid renter incomes; 4,585 units permitted in Charlotte County in 2024 (703 in 5+ unit buildings).
- At $3,161/mo this rent would consume 50% of the median local household income ($76k/yr) (locally 290% of renters already pay >50% of income on rent) — very limited rent-growth headroom before tenants either downsize or default.
Forward outlook
- Local home prices are declining (-3.0%/yr); year-one equity from $2k of loan paydown is wiped out by about $7k of value loss. Plan a longer hold.
- Charlotte County population projected at +24% by 2050 — long-run rental-demand tailwind backs the buy-and-hold thesis.
- At projected returns (-3.0% appreciation + 8.0% rent growth), your $67k cash investment doubles in ~9 years — after that, you're playing with house money.
Negotiation context
- It's been on market 320 days — a 12% lower offer ($209k) is reasonable based on typical stale-listing flexibility.
Risks & watch-outs
- Watch-outs: flood insurance adds $66/mo.
- Climate carrying-cost: major flood risk; severe wind risk, 99% chance of damaging wind over 30y; extreme-heat days projected 7→31/yr by 2055 (HVAC capex compounding) — expect insurance premiums to compound above CPI over the hold.
Questions for the listing agent
- It's been on market 320 days. Have you received any prior offers? Is the seller open to a 12% concession, seller financing, or rate buy-down credit?
- What's the actual annual flood-insurance premium (NFIP or private), and is the property in a SFHA with mandatory coverage?
- What does the HOA fee cover, when was the last increase, and are there any pending special assessments or reserve-fund shortfalls?
- Any open or pending special assessments — roof, HVAC, plumbing, elevator, façade? What's the per-unit balance and payoff schedule, and is the seller paying it off at close or rolling it to the buyer?
- Why hasn't it sold? Are there any deal-killer items the seller is aware of (foundation, flood, title, zoning, code violations)?
- Is there a deadline driving the sale (1031 exchange, divorce, estate, relocation)? That informs how much negotiation room exists.
- Schools are A-rated — typically a magnet for longer-tenancy family renters. What's the average tenant stay here, and is there a school-zone premium baked into asking?
- What's the average days-on-market for RENTAL listings here right now (not sales)? A rising rental-DOM trend means longer vacancies and softer asking-rent achievability than the comps imply.
- What's the recent tenant-quality profile in this submarket — average credit score on applications, eviction rate, late-payment / NSF rate, and stable-employment percentage? A property-management company in the area should have these aggregated.
- How much new apartment / multifamily construction is in the pipeline within 1–3 miles? Heavy new supply (>2% of stock underway) typically softens rents 12–24 months out; light construction supports rent growth.
Investment metrics
- 1% rule
- 1.33% ✓
- Cap rate
- 8.07%
- Cash-on-cash
- 6.36%
- DSCR
- 1.28
- GRM
- 6.3
CMA / ARV
No comps found within radius.
Projected returns pro-forma
-3.0% appreciation · 8.0% rent growth · sell at horizon
- IRR
- -1.2%
- Equity multiple
- 0.95×
- Total profit
- $-3,198
- Equity at exit
- $35,487
- IRR
- 14.2%
- Equity multiple
- 2.48×
- Total profit
- $98,370
- Equity at exit
- $20,578
Cash invested: $66,640 (down + closing). Projections, not guarantees.
Landlord ↔ Tenant lean methodology
- Overall (STATE)
- 87 Strongly Landlord-Friendly
- State Florida
- 87 Strongly Landlord-Friendly · R+3
- County
- — inherits STATE
- City
- — inherits STATE
ZIP-level market 34223
- Home prices YoY
- -34.2%
- Rents YoY
- 9.0%
- Active inventory
- 717
- Price-to-rent
- 6.3×
Monthly cashflow live
- Estimated rent
- $3,161 high interval (Pro) →
- Mortgage (P&I)
- −$1,248
- Tax from tax record
- −$246 /mo · $2,957/yr
- Insurance
- −$99
- Flood insurance flood zone
- −$66 /mo · $798/yr
- HOA
- −$550
- Vacancy / Maint / Mgmt
- −$664
- Net cashflow
- $287
Break-even live
UW: 25.0% down · 7.5% · 30yr · 1.5% tax · 5.0% vac · 8.0% maint · 8.0% mgmt
Financing live
Cash to close
- Down payment
- $59,500
- Closing costs
- $7,140
- Reserves months
- —
- Total cash needed
- —
Loan-product check · same deal, 3 products live
Conventional
25% down · 7.5% · 30yr
- Down + closing
- —
- Monthly P&I
- —
- Monthly cashflow
- —
- DSCR
- —
- Eligible?
- —
Personal DTI + credit; lowest rate.
DSCR
20% down · 8.5% · 30yr
- Down + closing
- —
- Monthly P&I
- —
- Monthly cashflow
- —
- DSCR
- —
- Eligible?
- —
No personal income docs; deal must DSCR.
Hard money
10% down · 12.0% · 12mo
- Down + closing
- —
- Monthly P&I
- —
- Monthly cashflow
- —
- DSCR
- —
- Eligible?
- —
Short-term bridge; refi at stabilization.
Rent comps 13 comps
| Address | Beds | Baths | Sqft | Rent | $/sqft | DOM | Units | Dist |
|---|---|---|---|---|---|---|---|---|
| 1531 Placida Rd #204 Englewood, FL | 2.0 | 2.0 | 1056 | $3,500 | $3.31 | 21d | 1 | 0.06mi |
| 1531 Placida Rd #203 Englewood, FL | 2.0 | 2.0 | 1056 | $3,900 | $3.69 | 21d | 1 | 0.07mi |
| 1435 New Point Comfort Rd Unit B Englewood, FL | 1.0 | 1.0 | 744 | $1,520 | $2.04 | 21d | 1 | 0.28mi |
| 1575 Loralin Dr Englewood, FL | 3.0 | 2.0 | 1322 | $5,000 | $3.78 | 21d | 1 | 0.43mi |
| 1210 S Maryknoll Rd Englewood, FL | 2.0 | 2.0 | 1063 | $2,600 | $2.45 | 21d | 1 | 0.60mi |
| 1401 S McCall Rd Unit 301A Englewood, FL | 2.0 | 2.0 | 1093 | $3,300 | $3.02 | 21d | 1 | 0.62mi |
| 1120 Lampp Dr Englewood, FL | 3.0 | 2.0 | 1212 | $4,000 | $3.30 | 21d | 1 | 0.67mi |
| 858 E 7th St Englewood, FL | 3.0 | 2.0 | 1244 | $1,995 | $1.60 | 21d | 1 | 0.69mi |
| 1604 Cardinal Ln Unit 1 Englewood, FL | 1.0 | 1.0 | 750 | $1,300 | $1.73 | 21d | 1 | 0.84mi |
| 2275 S McCall Rd #201 Englewood, FL | 2.0 | 2.0 | 1050 | $2,000 | $1.90 | 13d | 1 | 0.97mi |
| 1960 Oregon Trl Unit 2A Englewood, FL | 2.0 | 2.0 | 1360 | $3,750 | $2.76 | 21d | 1 | 1.08mi |
| 1970 Georgia Ave Englewood, FL | 3.0 | 2.0 | 1160 | $11,790 | $10.16 | 21d | 1 | 1.32mi |
| 2643 Lear Rd Englewood, FL | 2.0 | 2.0 | 1206 | $5,800 | $4.81 | 21d | 1 | 1.45mi |
HOA detail condo
- Monthly dues
- $550 · $6,600/yr
- Assessments
- None detected in remarks — confirm with the listing agent.
Listing history 32 events
-
2026-06-18days on market $238,000 Active 320 DOM
-
2026-06-17days on market $238,000 Active 319 DOM
-
2026-06-16days on market $238,000 Active 318 DOM
-
2026-06-15days on market $238,000 Active 317 DOM
-
2026-06-14days on market $238,000 Active 315 DOM
-
2026-06-13days on market $238,000 Active 314 DOM
-
2026-06-10days on market $238,000 Active 312 DOM
-
2026-06-09days on market $238,000 Active 311 DOM
-
2026-06-08pricedays on market $238,000 Active 310 DOM
-
2026-06-05days on market $239,900 Active 306 DOM
-
2026-06-02days on market $239,900 Active 304 DOM
-
2026-06-01days on market $239,900 Active 303 DOM
-
2026-05-31days on market $239,900 Active 302 DOM
-
2026-05-30days on market $239,900 Active 301 DOM
-
2026-02-26price $239,900
-
2026-01-25price $249,900
-
2026-01-21price $252,000
-
2026-01-05price $253,000
-
2025-12-26price $254,000
-
2025-12-19price $255,000
-
2025-12-17price $255,500
-
2025-12-13price $256,000
-
2025-12-11price $256,400
-
2025-12-09price $256,900
-
2025-12-06price $257,000
-
2025-12-04price $257,500
-
2025-11-22price $258,000
-
2025-11-19price $258,500
-
2025-11-18price $259,000
-
2025-08-02$259,900 Active
-
2022-05-19soldstatus $220,000
-
2001-10-19soldstatus $59,000
ⓘ Source: listings_history table (triggers on properties + properties_extension) + one-shot
backfill from property_details.listing_events for pre-trigger history.
Tax reassessment forecast FL · Resets to sale price
- Current annual tax
- $2,957 · $246/mo
- Projected year-2 tax
- $2,957 · $246/mo
- Expected delta
- $0/yr ($0/mo · 0.0%)
ⓘ Screening estimate from a state-policy table — verify with the county assessor before closing.
Climate risk First Street
- Flood 7/10 Severe FEMA zone X (shaded) · 96% chance over 30 yrs
- Wildfire 3/10 Moderate
- Heat 10/10 Extreme 7 d/yr ≥107°F today · 31 d/yr by 30 yrs out
- Wind 10/10 Extreme 99% chance of damaging wind over 30 yrs
- Air quality 2/10 Low 1 unhealthy d/yr today · 1 by 30 yrs out
Nearby sold comps map
Loading sold comps map…
Walkable amenities ~0.75 mi
Loading nearby amenities…
Taxation est. · year 1
- Rental income
- $37,929
- − Mortgage interest
- −$13,332
- − Property taxes
- −$2,957
- − Insurance
- −$1,988
- − Repairs & maintenance
- −$3,034
- − Management
- −$3,034
- − HOA
- −$6,600
- − Depreciation
- −$6,924
- Taxable income
- $60
- Est. tax owed @ 24.0%
- −$14
- After-tax cash flow
- $3,428/yr
For passive investors: Depreciation is non-cash, so a rental often shows a tax loss while cash-flowing — sheltering income. Rental losses are passive: they offset passive income freely, and up to $25,000/yr can offset ordinary (W-2) income if you actively participate and your MAGI is under $100k (phasing out to $0 by $150k); unused losses carry forward. On sale, claimed depreciation is recaptured at up to 25%, and gains may owe capital-gains tax (a 1031 exchange can defer both). Figures are a year-1 estimate at your 24.0% rate — not tax advice; consult a CPA.
Schools (NCES district)
- District
- Charlotte
- NCES district ID
- 1200240
- Math proficiency
- 54% ▼ -6.00%
- Reading proficiency
- 54% ▼ -1.00%
- Median HH income
- $44,864
- Composite
- 45.62/100
- National rank
- #2586
- State rank
- #22 of 73 in FL
Livability — Englewood
- Score
- 73/100
- State rank
- #321
- US rank
- #5655
Category grades
Schools grade is shown separately in the Schools card above.
Census & demographics
- Census place
- Englewood, FL
- County
- Sarasota County · 448,376 people
- City population
- 35,420
- Metro
- North Port-Sarasota-Bradenton, FL
- Population (ZIP)
- 19,884
- Household income
- $76,016
- Rent vs Own
- Severe rent burden
- 290.0
Population outlook (Charlotte County) Hauer SSP2
- Today (2025)
- 198,646 people
- By 2030
- 210,507 · +6.0%
- By 2040
- 230,857 · +16.2%
- By 2050
- 247,148 · +24.4%
- By 2075
- 281,777 · +41.8%
- By 2100
- 293,609 · +47.8%
Race, ethnicity, and origin ACS 2023
- Neighborhood character
- Predominantly White (94%)
- Race & ethnicity
- White 94% Two or more races 3% Hispanic / Latino 3% Asian 1%
- Common ancestry
- Romanian 7% Lithuanian 4% Iranian 2%
- Foreign-born
- 9% · Canada
- Languages at home
- 94% English-only · German/W. Germanic 2% Spanish 1% Other Indo-European 1%
Political lean MEDSL · Charlotte
- 2024 margin
- Solid R (+34.0) · D 32.7% · R 66.7%
- 2008→2024 swing
- -26.7pp toward R · 2008: -7.2pp · 2024: -34.0pp
- All cycles
- 2024: R+34.0 2020: R+26.6 2016: R+27.8 2012: R+14.3 2008: R+7.2
Not yet ingested
- Civics
- —
Market trends
- HPI YoY
- ▼ -146.26%
- Current HPI
- 281.0529
- Rent YoY
- ▲ 9.02%
- Metro
- North Port-Sarasota-Bradenton, FL
- State GDP YoY
- ▲ 3.28%
- F500 in state
- 36
Industry mix (Fortune 500 HQ in FL)
| Industry | F500 HQs | Revenue |
|---|---|---|
| Industrial Technology | 2 | $29B |
|
||
| Insurance | 2 | $17B |
|
||
| Retail | 1 | $60B |
|
||
| Technology Distribution | 1 | $58B |
|
||
| Homebuilding | 1 | $35B |
|
||
| Technology Manufacturing | 1 | $35B |
|
||
Price history
+306.6% since first listed18 events — show timeline
- 2026-02-26 Price Changed $239,900 Stellar MLS as Distributed by MLS Grid
- 2026-01-25 Price Changed $249,900 Stellar MLS as Distributed by MLS Grid
- 2026-01-21 Price Changed $252,000 Stellar MLS as Distributed by MLS Grid
- 2026-01-05 Price Changed $253,000 Stellar MLS as Distributed by MLS Grid
- 2025-12-26 Price Changed $254,000 Stellar MLS as Distributed by MLS Grid
- 2025-12-19 Price Changed $255,000 Stellar MLS as Distributed by MLS Grid
- 2025-12-17 Price Changed $255,500 Stellar MLS as Distributed by MLS Grid
- 2025-12-13 Price Changed $256,000 Stellar MLS as Distributed by MLS Grid
- 2025-12-11 Price Changed $256,400 Stellar MLS as Distributed by MLS Grid
- 2025-12-09 Price Changed $256,900 Stellar MLS as Distributed by MLS Grid
- 2025-12-06 Price Changed $257,000 Stellar MLS as Distributed by MLS Grid
- 2025-12-04 Price Changed $257,500 Stellar MLS as Distributed by MLS Grid
- 2025-11-22 Price Changed $258,000 Stellar MLS as Distributed by MLS Grid
- 2025-11-19 Price Changed $258,500 Stellar MLS as Distributed by MLS Grid
- 2025-11-18 Price Changed $259,000 Stellar MLS as Distributed by MLS Grid
- 2025-08-02 Listed $259,900 Stellar MLS as Distributed by MLS Grid
- 2022-05-19 Sold (Public Records) $220,000 Public Records
- 2001-10-19 Sold (Public Records) $59,000 Public Records
Property tax history
+6.6%/yrLatest (2025): $2,957 · -10.1% YoY. Source: county tax records.
Cash-flow waterfall
monthlySold comps — $/sqft
last 12 mo · ≤1 miLoading sold comps…