 Duplex
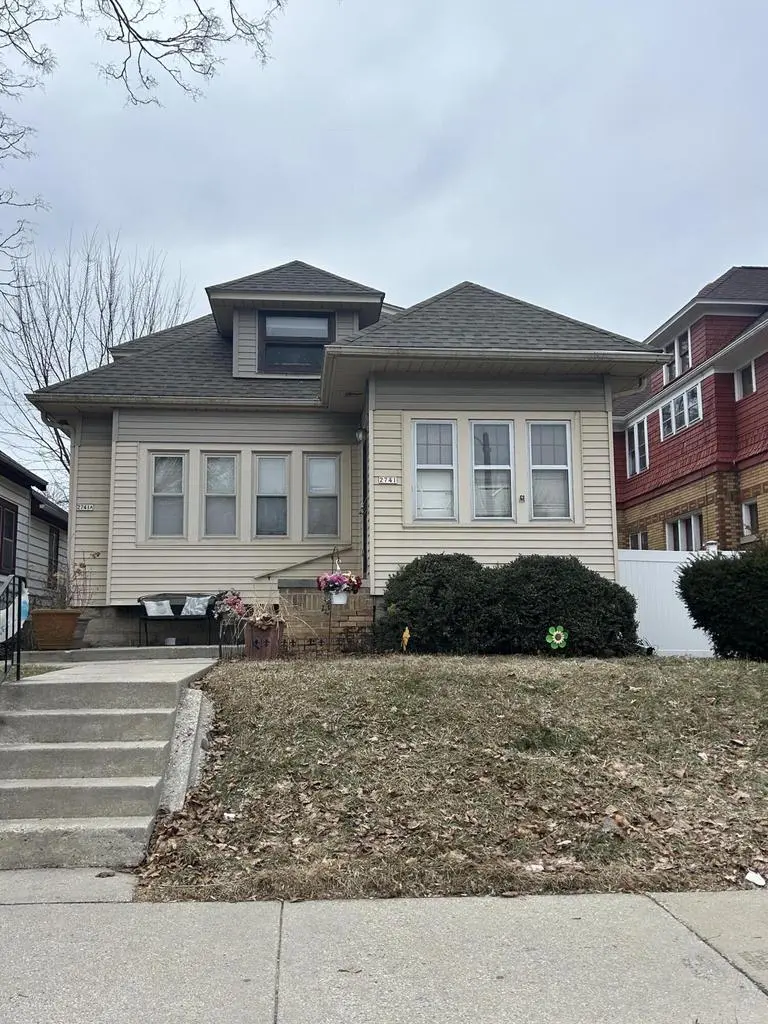
2741 N 52nd St Unit 2741A · Milwaukee, WI
Flood risk 1/10 · Minimal
- FEMA flood zone
- X (unshaded)
- Chance of flooding over 30 yrs
- 0.0%
- Est. flood insurance / yr
- $473 – $860
Fire risk 1/10 · Minimal
- Est. fire insurance / yr
- $636 – $1,182
Heat risk 2/10 · Minimal
- Hot days now (above 100°F)
- 7 days/yr
- Hot days in 30 yrs
- 13 days/yr
Wind risk 2/10 · Minimal
- Chance of severe wind over 30 yrs
- —
Air-quality risk 2/10 · Minimal
- Unhealthy air days now
- 2 days/yr
- Unhealthy air days in 30 yrs
- 2 days/yr
Risk factors via First Street. Map © Google.
Why this score? — see what drove the B- grade
The composite is a weighted blend of 9 inputs, each scored 0–100. Each bar is that input's sub-score; the figure is the points it added to the 100-point composite (weight × sub-score).
- Cash flow +30.0/30.0
- DSCR +10.0/10.0
- 1% rule +9.1/10.0
- ARV discount +7.5/15.0
- Livability +4.0/5.0
- Condition / age +3.8/5.0
- Rent growth +3.5/5.0
- Schools +1.2/10.0
- Appreciation +0.0/10.0
$175,000
🖨 Deal sheet (PDF) 📄 Offer letter ✓ Due diligence
Multi-family units
County records classify this as Multi-Family (2-4 Unit). Listing-text estimate: 2 units. confirmed
Listing remarks MLS
Excellent duplex bungalow! This home is prefect for owner occupant or investor looking for a great property. Hardwood floors, new windows, updated mechanicals and a new roof. This home is nestled in the middle of a quiet block with a private and secluded back yard.
Key facts
- Duplex bungalow
- Private back yard
- Updated mechanicals
Tags
Neighborhood map
What this means for you Summary
Snapshot
- This is a 2 × 3-bed/2.0-bath units multifamily listed at $175k. Condition is rated good.
Deal economics
- At list price, monthly cash flow is $741 ($9k/yr) — positive. Per door: $371/mo.
- The deal already cash-flows at list — no discount required.
- Meets the 1% rule at list price ($2k rent vs $175k).
- Recommended offer: $164k (6.0% below list) — sets the bar for market timing.
- Cap rate 11.4% vs local median 5.1% in Milwaukee — top-decile yield for the area; either an underpriced asset or a hidden risk that comps aren't pricing in. Stress-test before assuming the spread holds.
Location & tenants
- Location reads 81/100 on livability (#55 in WI, #1,534 nationally) — a professional / high-income tenant draw. Strengths: amenities A+, commute A+, cost of living A+; Watch: employment D+, schools F, crime F.
- Milwaukee School District (urban): math 10% / reading 18% proficiency, ranked #337 of 342 in WI (top 98%) — low school quality limits family demand, transient renter base, plan for 1-2y turnover; 77% free/reduced lunch — lower-income household profile, screen leases tightly.
- Market conditions: Rents rising (+3.8%/yr); 143 active listings in the ZIP; 1 comparable units currently listed for rent nearby; 1,017 units permitted in Milwaukee County in 2024 (803 in 5+ unit buildings).
- At $2,469/mo this rent would consume 61% of the median local household income ($48k/yr) (locally 1730% of renters already pay >50% of income on rent) — very limited rent-growth headroom before tenants either downsize or default.
Forward outlook
- Local home prices are declining (-3.0%/yr); year-one equity from $1k of loan paydown is wiped out by about $5k of value loss. Plan a longer hold.
- Milwaukee County population projected at +4% by 2050 — modest demand growth; plan on rents tracking national, not racing it.
- At projected returns (-3.0% appreciation + 3.8% rent growth), your $49k cash investment doubles in ~7 years — after that, you're playing with house money.
Negotiation context
- It's been on market 88 days — a 6% lower offer ($164k) is reasonable based on typical stale-listing flexibility.
Risks & watch-outs
- Watch-outs: built in 1927 — expect roof / HVAC / electrical / plumbing capex.
Questions for the listing agent
- It's been on market 88 days. Have you received any prior offers? Is the seller open to a 6% concession, seller financing, or rate buy-down credit?
- Can we see the unit-by-unit rent roll, current vacancy, and any below-market leases? What's the average tenancy length?
- What capital expenditures (roof, boiler, parking lot, exteriors) have been made in the last 5 years, and what's planned in the next 2?
- Built in 1927 — when were the roof, HVAC, electrical panel, plumbing, and water heater last replaced?
- Why hasn't it sold? Are there any deal-killer items the seller is aware of (foundation, flood, title, zoning, code violations)?
- Is there a deadline driving the sale (1031 exchange, divorce, estate, relocation)? That informs how much negotiation room exists.
- Schools are F-rated, which usually means shorter tenancies and higher turnover. Who's the typical renter profile here, and what's been the actual vacancy rate?
- Crime grade is F in this area — have there been break-ins, vandalism, or insurance claims at this property in the last 3 years? What carrier currently insures it and at what premium?
- What's the average days-on-market for RENTAL listings here right now (not sales)? A rising rental-DOM trend means longer vacancies and softer asking-rent achievability than the comps imply.
- What's the recent tenant-quality profile in this submarket — average credit score on applications, eviction rate, late-payment / NSF rate, and stable-employment percentage? A property-management company in the area should have these aggregated.
- How much new apartment / multifamily construction is in the pipeline within 1–3 miles? Heavy new supply (>2% of stock underway) typically softens rents 12–24 months out; light construction supports rent growth.
Investment metrics
- 1% rule
- 1.41% ✓
- Cap rate
- 11.37%
- Cash-on-cash
- 18.15%
- DSCR
- 1.81
- GRM
- 5.9
CMA / ARV
- ARV (median comp)
- $175,000
- List price
- $175,000
- Delta
- —
- Verdict
- FAIR
- Comps
- 20 within 1.0 mi
Show comp detail 12 sales within ~0.75 mi
| Address | Dist | Beds/Ba | Sqft | Sold | Price | $/sf | Match |
|---|---|---|---|---|---|---|---|
| 2848 N 50th St #2850 | 0.21mi | 6/2.0 | 2,222 (+10%) | 2mo | $239,900 | $108 | 64 |
| 2576 N 52nd St #2578 | 0.20mi | 5/2.0 (-1) | 2,031 (+1%) | 16mo | $147,000 | $72 | 63 |
| 2757 N 51st St #2759 | 0.07mi | 5/2.0 (-1) | 2,160 (+7%) | 13mo | $190,000 | $88 | 61 |
| 2927 N 52nd St Unit -A | 0.23mi | 5/3.0 (-1) | 2,112 (+5%) | 15mo | $254,000 | $120 | 60 |
| 2466 N 52nd St | 0.34mi | 6/2.0 | 1,960 (-3%) | 16mo | $154,900 | $79 | 58 |
| 2759 N 57th St #2761 | 0.29mi | 5/2.0 (-1) | 1,909 (-5%) | 12mo | $205,000 | $107 | 55 |
| 2632 N 49th St #2634 | 0.26mi | 6/2.0 | 2,200 (+9%) | 17mo | $18,500 | $8 | 51 |
| 3012 N 57th St | 0.43mi | 6/2.0 | 2,261 (+12%) | 3mo | $180,000 | $80 | 50 |
| 2227 N 47th St | 0.70mi | 6/2.0 | 1,953 (-3%) | 15mo | $220,000 | $113 | 42 |
| 2977 N 60th St #2979 | 0.54mi | 5/2.0 (-1) | 2,273 (+13%) | 1mo | $179,900 | $79 | 40 |
| 2338 N 45th St #2340 | 0.68mi | 6/2.0 | 2,304 (+14%) | 2mo | $170,000 | $74 | 35 |
| 2252 N Hi Mount Blvd | 0.60mi | 5/2.0 (-1) | 2,208 (+9%) | 15mo | $220,000 | $100 | 31 |
Match score weights: distance 35% · size 25% · config 20% · recency 20%. Top-matched comps best support the ARV.
Projected returns pro-forma
-3.0% appreciation · 3.82% rent growth · sell at horizon
- IRR
- 10.7%
- Equity multiple
- 1.43×
- Total profit
- $20,936
- Equity at exit
- $26,093
- IRR
- 20.4%
- Equity multiple
- 2.79×
- Total profit
- $87,732
- Equity at exit
- $15,131
Cash invested: $49,000 (down + closing). Projections, not guarantees.
Landlord ↔ Tenant lean methodology
- Overall (STATE)
- 73 Landlord-Friendly
- State Wisconsin
- 73 Landlord-Friendly · R+2
- County
- — inherits STATE
- City
- — inherits STATE
ZIP-level market 53210
- Home prices YoY
- -21.5%
- Rents YoY
- 3.8%
- Active inventory
- 143
- Price-to-rent
- 11.8×
Monthly cashflow live
- Estimated rent
- $2,469 high interval (Pro) →
- Mortgage (P&I)
- −$918
- Tax est. 1.5%
- −$219 /mo · $2,625/yr
- Insurance
- −$73
- HOA
- −$0
- Vacancy / Maint / Mgmt
- −$518
- Net cashflow
- $741
Break-even live
Sensitivity live
| Price | -10% $862 | -5% $802 | +0% $741 | +5% $681 | +10% $620 |
|---|---|---|---|---|---|
| Rent | -10% $546 | -5% $644 | +0% $741 | +5% $839 | +10% $936 |
| Rate | -1.0pp $829 | -0.5pp $786 | base $741 | +0.5pp $696 | +1.0pp $650 |
2-unit breakdown (identical units grouped — click to expand)
| Units | Beds | Baths | Est. rent |
|---|---|---|---|
| 2× units | 3 | 2 | $2,470 |
| #1 | 3 | 2 | $1,235 |
| #2 | 3 | 2 | $1,235 |
| Total (2 units) | $2,469 | ||
UW: 25.0% down · 7.5% · 30yr · 1.5% tax · 5.0% vac · 8.0% maint · 8.0% mgmt
Financing live
Cash to close
- Down payment
- $43,750
- Closing costs
- $5,250
- Reserves months
- —
- Total cash needed
- —
Loan-product check · same deal, 3 products live
Conventional
25% down · 7.5% · 30yr
- Down + closing
- —
- Monthly P&I
- —
- Monthly cashflow
- —
- DSCR
- —
- Eligible?
- —
Personal DTI + credit; lowest rate.
DSCR
20% down · 8.5% · 30yr
- Down + closing
- —
- Monthly P&I
- —
- Monthly cashflow
- —
- DSCR
- —
- Eligible?
- —
No personal income docs; deal must DSCR.
Hard money
10% down · 12.0% · 12mo
- Down + closing
- —
- Monthly P&I
- —
- Monthly cashflow
- —
- DSCR
- —
- Eligible?
- —
Short-term bridge; refi at stabilization.
Rent comps 1 comps
| Address | Beds | Baths | Sqft | Rent | $/sqft | DOM | Units | Dist |
|---|---|---|---|---|---|---|---|---|
| 2137 N 47th St Milwaukee, WI | 5.0 | 2.0 | 1723 | $1,850 | $1.07 | 16d | 1 | 0.83mi |
Listing history 16 events
-
2026-06-21days on market $175,000 Active 88 DOM
-
2026-06-18days on market $175,000 Active 85 DOM
-
2026-06-17days on market $175,000 Active 84 DOM
-
2026-06-16days on market $175,000 Active 83 DOM
-
2026-06-15days on market $175,000 Active 82 DOM
-
2026-06-13days on market $175,000 Active 80 DOM
-
2026-06-13days on market $175,000 Active 79 DOM
-
2026-06-09days on market $175,000 Active 76 DOM
-
2026-06-08days on market $175,000 Active 75 DOM
-
2026-06-07days on market $175,000 Active 74 DOM
-
2026-06-05days on market $175,000 Active 71 DOM
-
2026-06-03days on market $175,000 Active 70 DOM
-
2026-06-02days on market $175,000 Active 69 DOM
-
2026-06-01days on market $175,000 Active 68 DOM
-
2026-05-31days on market $175,000 Active 67 DOM
-
2026-03-25$175,000 Active 266-char remark
Show marketing remark (266 chars)
Excellent duplex bungalow! This home is prefect for owner occupant or investor looking for a great property. Hardwood floors, new windows, updated mechanicals and a new roof. This home is nestled in the middle of a quiet block with a private and secluded back yard.
ⓘ Source: listings_history table (triggers on properties + properties_extension) + one-shot
backfill from property_details.listing_events for pre-trigger history.
Climate risk First Street
- Flood 1/10 Low FEMA zone X (unshaded) · 0% chance over 30 yrs
- Wildfire 1/10 Low
- Heat 2/10 Low 7 d/yr ≥100°F today · 13 d/yr by 30 yrs out
- Wind 2/10 Low
- Air quality 2/10 Low 2 unhealthy d/yr today · 2 by 30 yrs out
Nearby sold comps map
Loading sold comps map…
Walkable amenities ~0.75 mi
Loading nearby amenities…
Taxation est. · year 1
- Rental income
- $29,628
- − Mortgage interest
- −$9,803
- − Property taxes
- −$2,625
- − Insurance
- −$875
- − Repairs & maintenance
- −$2,370
- − Management
- −$2,370
- − Depreciation
- −$5,091
- Taxable income
- $6,494
- Est. tax owed @ 24.0%
- −$1,559
- After-tax cash flow
- $7,335/yr
For passive investors: Depreciation is non-cash, so a rental often shows a tax loss while cash-flowing — sheltering income. Rental losses are passive: they offset passive income freely, and up to $25,000/yr can offset ordinary (W-2) income if you actively participate and your MAGI is under $100k (phasing out to $0 by $150k); unused losses carry forward. On sale, claimed depreciation is recaptured at up to 25%, and gains may owe capital-gains tax (a 1031 exchange can defer both). Figures are a year-1 estimate at your 24.0% rate — not tax advice; consult a CPA.
Condition & rehab AI · 1 photo
This well-maintained duplex bungalow is in good condition with a good roof, exterior, and landscaping. It is ready for a new owner or investor to move in.
Value-add opportunities
- Both Paint exterior siding — Painting the exterior siding can enhance the curb appeal and increase the home's value.
- Both Trim bushes — Trimming the bushes can improve the landscaping and make the home more attractive to potential buyers or renters.
Renovation cost estimate screening
Value-add ROI direction
- Both Paint exterior siding — Painting the exterior siding can enhance the curb appeal and increase the home's value. ↑
- Both Trim bushes — Trimming the bushes can improve the landscaping and make the home more attractive to potential buyers or renters. ↑
ⓘ Cost ranges are severity-bucket heuristics (US national rule-of-thumb). Get contractor quotes + a written scope before underwriting a rehab budget.
Schools (NCES district)
- District
- Milwaukee School District
- NCES district ID
- 5509600
- Math proficiency
- 10% ▼ -5.00%
- Reading proficiency
- 18% ▬ 0.00%
- Median HH income
- $36,339
- Composite
- 11.61/100
- National rank
- #9696
- State rank
- #337 of 342 in WI
Livability — Milwaukee
- Score
- 81/100
- State rank
- #55
- US rank
- #1534
Category grades
Schools grade is shown separately in the Schools card above.
Census & demographics
- Census place
- Milwaukee, WI
- County
- Milwaukee County · 926,379 people
- City population
- 573,768
- Metro
- Milwaukee-Waukesha, WI
- Population (ZIP)
- 23,922
- Household income
- $48,217
- Rent vs Own
- Severe rent burden
- 1730.0
Population outlook (Milwaukee County) Hauer SSP2
- Today (2025)
- 995,758 people
- By 2030
- 1,009,124 · +1.3%
- By 2040
- 1,028,128 · +3.3%
- By 2050
- 1,040,066 · +4.4%
- By 2075
- 1,057,849 · +6.2%
- By 2100
- 1,039,774 · +4.4%
Race, ethnicity, and origin ACS 2023
- Neighborhood character
- Predominantly Black (71%)
- Race & ethnicity
- Black 71% White 17% Hispanic / Latino 6% Two or more races 6% Asian 2%
- Hispanic origin (detail)
- Mexican 3% Puerto Rican 1%
- Common ancestry
- Romanian 2% Portuguese 1% Italian 1%
- Foreign-born
- 3% · Canada, Philippines
- Languages at home
- 94% English-only · Spanish 3% Other Asian/Pacific 2%
Political lean MEDSL · Milwaukee
- 2024 margin
- Solid D (+38.5) · D 68.3% · R 29.8% · Other 1.8%
- 2008→2024 swing
- +2.7pp toward D · 2008: 35.9pp · 2024: 38.5pp
- All cycles
- 2024: D+38.5 2020: D+39.9 2016: D+37.5 2012: D+34.6 2008: D+35.9
Not yet ingested
- Civics
- —
Market trends
- HPI YoY
- ▼ -76.77%
- Current HPI
- 280.0133
- Rent YoY
- ▲ 3.82%
- Metro
- Milwaukee-Waukesha, WI
- State GDP YoY
- ▲ 2.10%
- F500 in state
- 20
Industry mix (Fortune 500 HQ in WI)
| Industry | F500 HQs | Revenue |
|---|---|---|
| Industrial Machinery | 4 | $23B |
|
||
| Industrial Technology | 2 | $36B |
|
||
| Insurance | 1 | $36B |
|
||
| Professional Services | 1 | $19B |
|
||
| Utilities | 1 | $9B |
|
||
| Consumer Goods | 1 | $3B |
|
||
Price history
1 event — show timeline
- 2026-03-25 Listed $175,000 METROMLS
Cash-flow waterfall
monthlySold comps — $/sqft
last 12 mo · ≤1 miLoading sold comps…