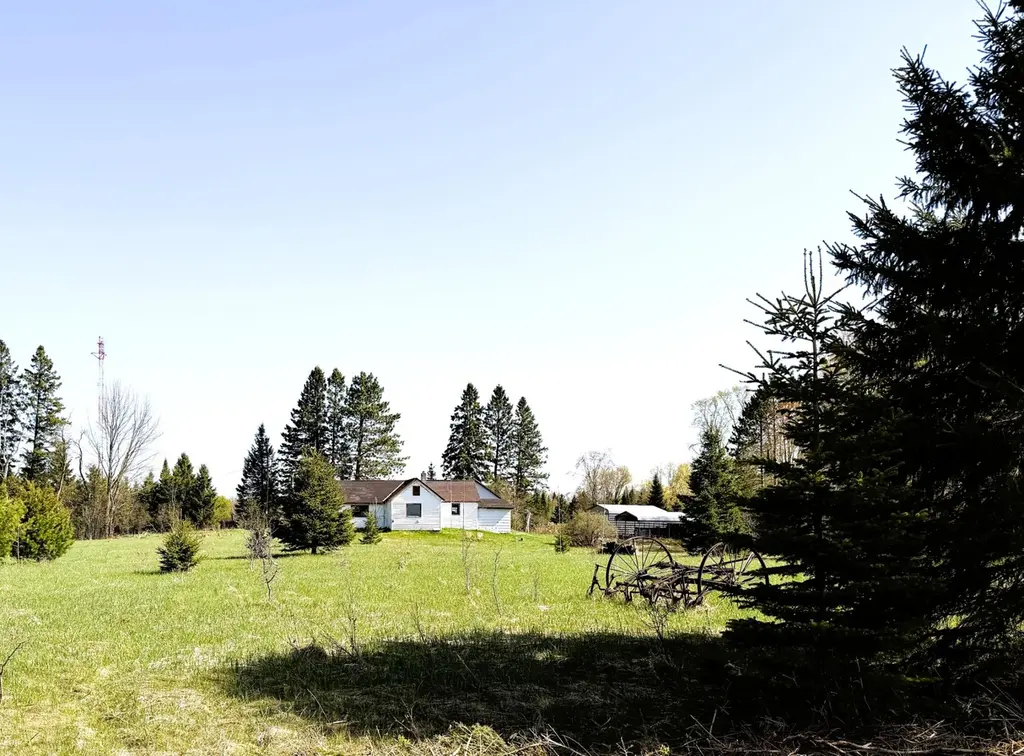
W8050 Cross Rd · Lake, WI
Flood risk 1/10 · Minimal
- FEMA flood zone
- X
- Chance of flooding over 30 yrs
- 0.0%
- Est. flood insurance / yr
- $473 – $860
Fire risk 3/10 · Minor
- Est. fire insurance / yr
- $636 – $1,182
Heat risk 1/10 · Minimal
- Hot days now (above 92°F)
- 7 days/yr
- Hot days in 30 yrs
- 13 days/yr
Wind risk 1/10 · Minimal
- Chance of severe wind over 30 yrs
- —
Air-quality risk 1/10 · Minimal
- Unhealthy air days now
- 0 days/yr
- Unhealthy air days in 30 yrs
- 0 days/yr
Risk factors via First Street. Map © Google.
Why this score? — see what drove the B grade
The composite is a weighted blend of 9 inputs, each scored 0–100. Each bar is that input's sub-score; the figure is the points it added to the 100-point composite (weight × sub-score).
- Cash flow +28.5/30.0
- DSCR +10.0/10.0
- 1% rule +7.9/10.0
- Appreciation +7.7/10.0
- ARV discount +7.5/15.0
- Rent growth +2.5/5.0
- Livability +2.5/5.0
- Condition / age +2.5/5.0
- Schools +2.3/10.0
$75,000
🖨 Deal sheet 📄 Offer letter ✓ Due diligence
Listing remarks
Opportunity awaits on this scenic 11-acre property with Smith Creek winding through the east corner of the land. The existing 2-bedroom, 1-bath home is being sold as-is and is in significant disrepair, with the ceiling currently falling in, making it suitable for a full renovation or tear-down. All personal property currently on the premises will remain with the sale. The property includes two detached garages and an additional carport for storage. The primary garage measures approximately 26' x 42' and features two overhead doors, a workshop area, and a spacious loft. A second 20' x 24' metal garage provides additional storage for vehicles, equipment, or recreational toys. A well and septi
Key facts
- Primary garage
- Workshop area
- Detached garages
Tags
Property features AI
Exterior
- Parking: 2-car garage; Carport; Driveway
- Utilities: Septic tank
- Home design: Single-family residence; Residential property; Entry level: 1
- Construction: Frame construction
- Exterior features: Farm setting; Level lot; Pasture; Private site; Secluded; Wooded
Interior
- Bathrooms: 1 full bathroom
- Heating & cooling: Forced air heating; Other heating
- Interior features: No fireplace
Neighborhood map
What this means for you Summary
Snapshot
- This is a 2-bed/1.0-bath other listed at $75k.
Deal economics
- At list price, monthly cash flow is $246 ($3k/yr) — positive.
- The deal already cash-flows at list — no discount required.
- Meets the 1% rule at list price ($965 rent vs $75k).
- Recommended offer: $74k (1.5% below list) — sets the bar for market timing.
Location & tenants
- Location reads: area grade B — affects rentability + tenant quality, not the cash-flow math above.
- Chequamegon School District (rural): math 25% / reading 29% proficiency, ranked #303 of 342 in WI (top 89%) — low school quality limits family demand, transient renter base, plan for 1-2y turnover.
- Market conditions: 20 active listings in the ZIP; 47 units permitted in Price County in 2024 (0 in 5+ unit buildings).
Forward outlook
- In year one you build about $5k of equity ($519 loan paydown + $4k appreciation (5.4% local appreciation)).
- Price County population projected at -25% by 2050 — secular population decline; favor cash flow + early exit over multi-decade hold.
- At projected returns (5.4% appreciation + 3.0% rent growth), your $21k cash investment doubles in ~3 years — after that, you're playing with house money.
- By year 8, paydown + projected appreciation supports a ~$35k cash-out refi (75% LTV) — recoverable capital for the next deal without selling this one.
Negotiation context
- It's been on market 15 days — a 2% lower offer ($74k) is reasonable based on typical stale-listing flexibility.
Questions for the listing agent
- Is there a deadline driving the sale (1031 exchange, divorce, estate, relocation)? That informs how much negotiation room exists.
- What's the average days-on-market for RENTAL listings here right now (not sales)? A rising rental-DOM trend means longer vacancies and softer asking-rent achievability than the comps imply.
- What's the recent tenant-quality profile in this submarket — average credit score on applications, eviction rate, late-payment / NSF rate, and stable-employment percentage? A property-management company in the area should have these aggregated.
- How much new for-sale + rental construction is in the pipeline within 1–3 miles? Heavy new supply typically softens prices + rents 12–24 months out; constrained supply supports both.
Investment metrics
- 1% rule
- 1.29% ✓
- Cap rate
- 10.22%
- Cash-on-cash
- 14.03%
- DSCR
- 1.62
- GRM
- 6.5
CMA / ARV
No comps found within radius.
Projected returns pro-forma
5.4% appreciation · 3.0% rent growth · sell at horizon
- IRR
- 25.8%
- Equity multiple
- 2.65×
- Total profit
- $34,672
- Equity at exit
- $44,344
- IRR
- 24.6%
- Equity multiple
- 5.31×
- Total profit
- $90,562
- Equity at exit
- $78,100
Cash invested: $21,000 (down + closing). Projections, not guarantees.
Landlord ↔ Tenant lean methodology
- Overall (STATE)
- 73 Landlord-Friendly
- State Wisconsin
- 73 Landlord-Friendly · R+2
- County
- — inherits STATE
- City
- — inherits STATE
ZIP-level market 54514
- Home prices YoY
- 3.3%
- Active inventory
- 20
- Price-to-rent
- 6.5×
Monthly cashflow live
- Estimated rent
- $965 medium interval (Pro) →
- Mortgage (P&I)
- −$393
- Tax from tax record
- −$92 /mo · $1,108/yr
- Insurance
- −$31
- HOA
- −$0
- Vacancy / Maint / Mgmt
- −$203
- Net cashflow
- $246
Break-even live
UW: 25.0% down · 7.5% · 30yr · 1.5% tax · 5.0% vac · 8.0% maint · 8.0% mgmt
Financing live
Cash to close
- Down payment
- $18,750
- Closing costs
- $2,250
- Reserves months
- —
- Total cash needed
- —
Loan-product check · same deal, 3 products live
Conventional
25% down · 7.5% · 30yr
- Down + closing
- —
- Monthly P&I
- —
- Monthly cashflow
- —
- DSCR
- —
- Eligible?
- —
Personal DTI + credit; lowest rate.
DSCR
20% down · 8.5% · 30yr
- Down + closing
- —
- Monthly P&I
- —
- Monthly cashflow
- —
- DSCR
- —
- Eligible?
- —
No personal income docs; deal must DSCR.
Hard money
10% down · 12.0% · 12mo
- Down + closing
- —
- Monthly P&I
- —
- Monthly cashflow
- —
- DSCR
- —
- Eligible?
- —
Short-term bridge; refi at stabilization.
Listing history 13 events
-
2026-06-18days on market $75,000 Active 15 DOM
-
2026-06-17days on market $75,000 Active 14 DOM
-
2026-06-16days on market $75,000 Active 13 DOM
-
2026-06-15days on market $75,000 Active 12 DOM
-
2026-06-15days on market $75,000 Active 11 DOM
-
2026-06-13days on market $75,000 Active 10 DOM
-
2026-06-12days on market $75,000 Active 9 DOM
-
2026-06-09days on market $75,000 Active 6 DOM
-
2026-06-08days on market $75,000 Active 5 DOM
-
2026-06-08statusdays on market $75,000 Active 4 DOM
-
2026-06-02statusdays on market $75,000 Pending 2 DOM
-
2026-05-31remarks 699-char remark
-
2026-05-31$75,000 Active 1 DOM
ⓘ Source: listings_history table (triggers on properties + properties_extension) + one-shot
backfill from property_details.listing_events for pre-trigger history.
Tax reassessment forecast WI · Partial reset (capped growth)
- Current annual tax
- $1,108 · $92/mo
- Projected year-2 tax
- $1,248 · $104/mo
- Expected delta
- +$140/yr (+$12/mo · 12.6%)
ⓘ Screening estimate from a state-policy table — verify with the county assessor before closing.
Climate risk First Street
- Flood 1/10 Low FEMA zone X · 0% chance over 30 yrs
- Wildfire 3/10 Moderate
- Heat 1/10 Low 7 d/yr ≥92°F today · 13 d/yr by 30 yrs out
- Wind 1/10 Low
- Air quality 1/10 Low 0 unhealthy d/yr today · 0 by 30 yrs out
Nearby sold comps map
Loading sold comps map…
Walkable amenities ~0.75 mi
Loading nearby amenities…
Taxation est. · year 1
- Rental income
- $11,582
- − Mortgage interest
- −$4,201
- − Property taxes
- −$1,108
- − Insurance
- −$375
- − Repairs & maintenance
- −$927
- − Management
- −$927
- − Depreciation
- −$2,182
- Taxable income
- $1,863
- Est. tax owed @ 24.0%
- −$447
- After-tax cash flow
- $2,500/yr
For passive investors: Depreciation is non-cash, so a rental often shows a tax loss while cash-flowing — sheltering income. Rental losses are passive: they offset passive income freely, and up to $25,000/yr can offset ordinary (W-2) income if you actively participate and your MAGI is under $100k (phasing out to $0 by $150k); unused losses carry forward. On sale, claimed depreciation is recaptured at up to 25%, and gains may owe capital-gains tax (a 1031 exchange can defer both). Figures are a year-1 estimate at your 24.0% rate — not tax advice; consult a CPA.
Schools (NCES district)
- District
- Chequamegon School District
- NCES district ID
- 5500058
- Math proficiency
- 25% ▼ -18.00%
- Reading proficiency
- 29% ▼ -9.00%
- Median HH income
- $42,432
- Composite
- 22.98/100
- National rank
- #7984
- State rank
- #303 of 342 in WI
Livability — Lake
No livability data for this city. (Only ~50 U.S. cities are tracked.)
Census & demographics
- Population (ZIP)
- 1,810
Population outlook (Price County) Hauer SSP2
- Today (2025)
- 12,757 people
- By 2030
- 12,157 · -4.7%
- By 2040
- 10,761 · -15.6%
- By 2050
- 9,515 · -25.4%
- By 2075
- 8,293 · -35.0%
- By 2100
- 7,470 · -41.4%
Race, ethnicity, and origin ACS 2023
- Neighborhood character
- Predominantly White (97%)
- Race & ethnicity
- White 97% Two or more races 2%
- Common ancestry
- Romanian 17% Portuguese 6% Lithuanian 4%
- Foreign-born
- 0%
- Languages at home
- 99% English-only · Spanish 1%
Political lean MEDSL · Price
- 2024 margin
- Solid R (+31.1) · D 33.9% · R 65.1%
- 2008→2024 swing
- -44.5pp toward R · 2008: 13.4pp · 2024: -31.1pp
- All cycles
- 2024: R+31.1 2020: R+27.6 2016: R+25.0 2012: D+0.0 2008: D+13.4
Not yet ingested
- Civics
- —
Market trends
- HPI YoY
- ▲ 5.40%
- Current HPI
- 168.3677
- Rent YoY
- —
- Metro
- —
- State GDP YoY
- ▲ 2.10%
- F500 in state
- 20
Industry mix (Fortune 500 HQ in WI)
| Industry | F500 HQs | Revenue |
|---|---|---|
| Industrial Machinery | 4 | $23B |
|
||
| Industrial Technology | 2 | $36B |
|
||
| Insurance | 1 | $36B |
|
||
| Professional Services | 1 | $19B |
|
||
| Utilities | 1 | $9B |
|
||
| Consumer Goods | 1 | $3B |
|
||
Price history
1 event — show timeline
- 2026-05-29 Listed $75,000 GNMLS
Property tax history
+0.5%/yrLatest (2025): $1,108 · +9.3% YoY. Source: county tax records.
Cash-flow waterfall
monthlySold comps — $/sqft
last 12 mo · ≤1 miLoading sold comps…