 18-Plex
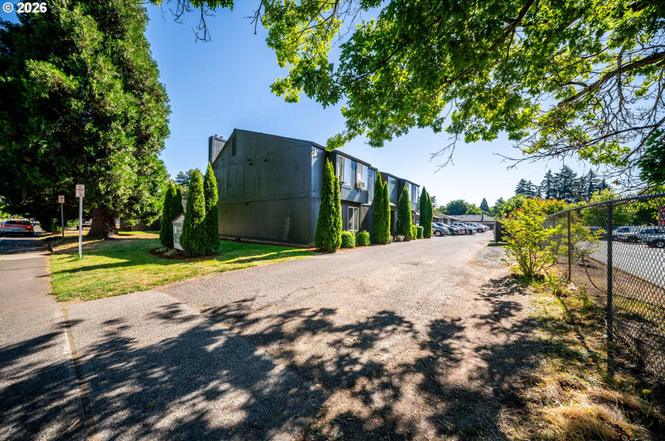
1046 NE 17th Ave · Hillsboro, OR
Flood risk 1/10 · Minimal
- FEMA flood zone
- X (unshaded)
- Chance of flooding over 30 yrs
- 0.0%
- Est. flood insurance / yr
- $507 – $1,088
Fire risk 1/10 · Minimal
- Est. fire insurance / yr
- $498 – $926
Heat risk 3/10 · Minor
- Hot days now (above 92°F)
- 7 days/yr
- Hot days in 30 yrs
- 14 days/yr
Wind risk 1/10 · Minimal
- Chance of severe wind over 30 yrs
- —
Air-quality risk 8/10 · Major
- Unhealthy air days now
- 11 days/yr
- Unhealthy air days in 30 yrs
- 11 days/yr
Risk factors via First Street. Map © Google.
Why this score? — see what drove the B grade
The composite is a weighted blend of 9 inputs, each scored 0–100. Each bar is that input's sub-score; the figure is the points it added to the 100-point composite (weight × sub-score).
- Cash flow +30.0/30.0
- 1% rule +10.0/10.0
- DSCR +10.0/10.0
- ARV discount +7.5/15.0
- Livability +4.4/5.0
- Schools +3.7/10.0
- Condition / age +2.5/5.0
- Rent growth +2.2/5.0
- Appreciation +0.0/10.0
$3,150,000
🖨 Deal sheet (PDF) 📄 Offer letter ✓ Due diligence
Multi-family units
County records classify this as Multi-Family (5+ Unit). Listing-text estimate: 18 units. confirmed
5+ unit building — per-unit beds/baths from public records are typically unavailable; the breakdown below (if shown) is an estimate from the listing text.
Listing remarks MLS
Well kept 18 Unit Apartment Complex. The Wexford Apartments. Newer windows, minimal deferred maintenance. Onsite Manager willing to stay. Room to increase rents, rents below market value. Owner manages the complex themselves, reflected in NOI.
Key facts
- On site laundry room
- Major roadways
- Owner managed
Tags
Property features AI
Finance
- Other: Lot size approximately 0.94 acres (level)
- Financial info: Rent includes water, sewer and trash; Overall property cap rate: 6.32; Gross rent multiplier: 10.42; Actual rents by unit type: 15 units at $1,400; 2 units at $1,200; 1 unit at $1,700
- HOA & community: Zoned MR2
Exterior
- Parking: Open parking; Space for 38 vehicles
- Utilities: Public water; Public sewer; Electric service
- Home design: Multi-family property; Not attached to another building; Approximately maintained condition
- Construction: Built in 1975; Composition roof; Concrete perimeter foundation
- Exterior features: Panel and wood siding exterior; Level lot; Territorial view; Paved road access
Interior
- Kitchen: Dishwasher; Range; Refrigerator
- Bedrooms: Fifteen 2-bedroom units; Two 1-bedroom units; One 3-bedroom unit
- Bathrooms: 15 units with 1 bath; 2 units with 1 bath; 1 unit with 2 baths
- Heating & cooling: Baseboard heating; No central cooling
- Interior features: Crawl space basement; Laundry facility in community
- Laundry & utility: Community laundry; Electric hot water
Neighborhood map
What this means for you Summary
Snapshot
- This is a 18 × 35-bed/19.0-bath units multifamily listed at $3.15M.
Deal economics
- At list price, monthly cash flow is $24k ($282k/yr) — positive. Per door: $1k/mo.
- The deal already cash-flows at list — no discount required.
- Meets the 1% rule at list price ($57k rent vs $3.15M).
- Cap rate 15.3% vs local median 3.0% in Hillsboro — top-decile yield for the area; either an underpriced asset or a hidden risk that comps aren't pricing in. Stress-test before assuming the spread holds.
Location & tenants
- Location reads 87/100 on livability (#13 in OR, #282 nationally) — a professional / high-income tenant draw. Strengths: amenities A+, commute A+, employment A+; Watch: crime D+, cost of living F.
- Hillsboro SD 1J (urban): math 35% / reading 46% proficiency, ranked #13 of 58 in OR (top 22%) — families likely to look elsewhere, expect single-tenant / working-renter base with shorter leases.
- Zoned schools: Mooberry Elementary School (math 15% / reading 24%, grade F, #366 of 412 statewide, top 91%, 381 students, 66% FRL); J W Poynter Middle School (math 42% / reading 62%, grade C+, #25 of 128 statewide, top 19%, 654 students, 62% FRL); Liberty High School (math 50% / reading 70%, grade C+, #23 of 143 statewide, top 19%, 1,454 students, 46% FRL) — zoned schools average 58% FRL vs 40% district-wide (18 pts higher); higher-poverty schools than district average — tighter screening recommended.
- Market conditions: Rents soft (-1.3%/yr); 233 active listings in the ZIP; high-income renter base; 2,224 units permitted in Washington County in 2024 (242 in 5+ unit buildings).
- At $57,336/mo this rent would consume 625% of the median local household income ($110k/yr) (locally 2097% of renters already pay >50% of income on rent) — very limited rent-growth headroom before tenants either downsize or default.
Forward outlook
- Local home prices are declining (-3.0%/yr); year-one equity from $22k of loan paydown is wiped out by about $94k of value loss. Plan a longer hold.
- Washington County population projected at +33% by 2050 — long-run rental-demand tailwind backs the buy-and-hold thesis.
- At projected returns (-3.0% appreciation + 0.0% rent growth), your $882k cash investment doubles in ~5 years — after that, you're playing with house money.
Negotiation context
- Only 4 days on market — expect competitive offers; lowballing is unlikely to land.
- 2 sale attempts since 15y ago with the ask held roughly flat each time — persistent listings suggest the price (not the market) is what's stuck; bring a comps-based counter.
- Current owner paid $970k; list at $3.15M implies a 225% gain — meaningful room to come down on a strong offer.
Questions for the listing agent
- Can we see the unit-by-unit rent roll, current vacancy, and any below-market leases? What's the average tenancy length?
- What capital expenditures (roof, boiler, parking lot, exteriors) have been made in the last 5 years, and what's planned in the next 2?
- Built in 1975 — when were the roof, HVAC, electrical panel, plumbing, and water heater last replaced?
- Is there a deadline driving the sale (1031 exchange, divorce, estate, relocation)? That informs how much negotiation room exists.
- Crime grade is D in this area — have there been break-ins, vandalism, or insurance claims at this property in the last 3 years? What carrier currently insures it and at what premium?
- What's the average days-on-market for RENTAL listings here right now (not sales)? A rising rental-DOM trend means longer vacancies and softer asking-rent achievability than the comps imply.
- What's the recent tenant-quality profile in this submarket — average credit score on applications, eviction rate, late-payment / NSF rate, and stable-employment percentage? A property-management company in the area should have these aggregated.
- How much new apartment / multifamily construction is in the pipeline within 1–3 miles? Heavy new supply (>2% of stock underway) typically softens rents 12–24 months out; light construction supports rent growth.
Investment metrics
- 1% rule
- 1.82% ✓
- Cap rate
- 15.26%
- Cash-on-cash
- 32.01%
- DSCR
- 2.42
- GRM
- 4.6
CMA / ARV
No comps found within radius.
Projected returns pro-forma
-3.0% appreciation · 0.0% rent growth · sell at horizon
- IRR
- 23.6%
- Equity multiple
- 1.93×
- Total profit
- $820,816
- Equity at exit
- $469,675
- IRR
- 29.5%
- Equity multiple
- 3.27×
- Total profit
- $1,998,348
- Equity at exit
- $272,354
Cash invested: $882,000 (down + closing). Projections, not guarantees.
Landlord ↔ Tenant lean methodology
- Overall (STATE)
- 28 Tenant-Leaning
- State Oregon
- 28 Tenant-Leaning · D+6
- County
- — inherits STATE
- City
- — inherits STATE
ZIP-level market 97124
- Rents YoY
- -1.3%
- Active inventory
- 233
- Price-to-rent
- 82.4×
Monthly cashflow live
- Estimated rent
- $57,336 medium interval (Pro) →
- Mortgage (P&I)
- −$16,519
- Tax est. 1.5%
- −$3,938 /mo · $47,250/yr
- Insurance
- −$1,312
- HOA
- −$0
- Vacancy / Maint / Mgmt
- −$12,041
- Net cashflow
- $23,526
Break-even live
Sensitivity live
| Price | -10% $25,703 | -5% $24,615 | +0% $23,526 | +5% $22,438 | +10% $21,350 |
|---|---|---|---|---|---|
| Rent | -10% $18,997 | -5% $21,262 | +0% $23,526 | +5% $25,791 | +10% $28,056 |
| Rate | -1.0pp $25,113 | -0.5pp $24,328 | base $23,526 | +0.5pp $22,710 | +1.0pp $21,880 |
18-unit breakdown (identical units grouped — click to expand)
| Units | Beds | Baths | Est. rent |
|---|---|---|---|
| 18× units | 35 | 19 | $57,330 |
| #1 | 35 | 19 | $3,185 |
| #2 | 35 | 19 | $3,185 |
| #3 | 35 | 19 | $3,185 |
| #4 | 35 | 19 | $3,185 |
| #5 | 35 | 19 | $3,185 |
| #6 | 35 | 19 | $3,185 |
| #7 | 35 | 19 | $3,185 |
| #8 | 35 | 19 | $3,185 |
| #9 | 35 | 19 | $3,185 |
| #10 | 35 | 19 | $3,185 |
| #11 | 35 | 19 | $3,185 |
| #12 | 35 | 19 | $3,185 |
| #13 | 35 | 19 | $3,185 |
| #14 | 35 | 19 | $3,185 |
| #15 | 35 | 19 | $3,185 |
| #16 | 35 | 19 | $3,185 |
| #17 | 35 | 19 | $3,185 |
| #18 | 35 | 19 | $3,185 |
| Total (18 units) | $57,336 | ||
UW: 25.0% down · 7.5% · 30yr · 1.5% tax · 5.0% vac · 8.0% maint · 8.0% mgmt
Financing live
Cash to close
- Down payment
- $787,500
- Closing costs
- $94,500
- Reserves months
- —
- Total cash needed
- —
Loan-product check · same deal, 3 products live
Conventional
25% down · 7.5% · 30yr
- Down + closing
- —
- Monthly P&I
- —
- Monthly cashflow
- —
- DSCR
- —
- Eligible?
- —
Personal DTI + credit; lowest rate.
DSCR
20% down · 8.5% · 30yr
- Down + closing
- —
- Monthly P&I
- —
- Monthly cashflow
- —
- DSCR
- —
- Eligible?
- —
No personal income docs; deal must DSCR.
Hard money
10% down · 12.0% · 12mo
- Down + closing
- —
- Monthly P&I
- —
- Monthly cashflow
- —
- DSCR
- —
- Eligible?
- —
Short-term bridge; refi at stabilization.
Listing history 3 events
-
2026-06-21days on market $3,150,000 Active 4 DOM
-
2026-06-17remarks 646-char remark
-
2026-06-17$3,150,000 Active 1 DOM
ⓘ Source: listings_history table (triggers on properties + properties_extension) + one-shot
backfill from property_details.listing_events for pre-trigger history.
Climate risk First Street
- Flood 1/10 Low FEMA zone X (unshaded) · 0% chance over 30 yrs
- Wildfire 1/10 Low
- Heat 3/10 Moderate 7 d/yr ≥92°F today · 14 d/yr by 30 yrs out
- Wind 1/10 Low
- Air quality 8/10 Severe 11 unhealthy d/yr today · 11 by 30 yrs out
Nearby sold comps map
Loading sold comps map…
Walkable amenities ~0.75 mi
Loading nearby amenities…
Taxation est. · year 1
- Rental income
- $688,032
- − Mortgage interest
- −$176,449
- − Property taxes
- −$47,250
- − Insurance
- −$15,750
- − Repairs & maintenance
- −$55,043
- − Management
- −$55,043
- − Depreciation
- −$91,636
- Taxable income
- $246,862
- Est. tax owed @ 24.0%
- −$59,247
- After-tax cash flow
- $223,071/yr
For passive investors: Depreciation is non-cash, so a rental often shows a tax loss while cash-flowing — sheltering income. Rental losses are passive: they offset passive income freely, and up to $25,000/yr can offset ordinary (W-2) income if you actively participate and your MAGI is under $100k (phasing out to $0 by $150k); unused losses carry forward. On sale, claimed depreciation is recaptured at up to 25%, and gains may owe capital-gains tax (a 1031 exchange can defer both). Figures are a year-1 estimate at your 24.0% rate — not tax advice; consult a CPA.
Schools (NCES district)
- District
- Hillsboro SD 1J
- NCES district ID
- 4100023
- Math proficiency
- 35% ▼ -4.00%
- Reading proficiency
- 46% ▼ -7.00%
- Median HH income
- $68,587
- Composite
- 36.64/100
- National rank
- #4617
- State rank
- #13 of 58 in OR
Livability — Hillsboro
- Score
- 87/100
- State rank
- #13
- US rank
- #282
Category grades
Schools grade is shown separately in the Schools card above.
Census & demographics
- Census place
- Hillsboro, OR
- County
- Washington County · 583,254 people
- City population
- 102,767
- Metro
- Portland-Vancouver-Hillsboro, OR-WA
- Population (ZIP)
- 54,357
- Household income
- $110,067
- Rent vs Own
- Severe rent burden
- 2097.0
Population outlook (Washington County) Hauer SSP2
- Today (2025)
- 674,042 people
- By 2030
- 721,804 · +7.1%
- By 2040
- 812,732 · +20.6%
- By 2050
- 895,143 · +32.8%
- By 2075
- 1,058,806 · +57.1%
- By 2100
- 1,131,692 · +67.9%
Race, ethnicity, and origin ACS 2023
- Neighborhood character
- Diverse neighborhood (Simpson 0.62)
- Race & ethnicity
- White 56% Hispanic / Latino 24% Two or more races 14% Asian 11% Black 3% Pacific Islander 1%
- Hispanic origin (detail)
- Mexican 19%
- Common ancestry
- Italian 4% Portuguese 3% Slovak 2%
- Foreign-born
- 19% · Canada, China, South Korea
- Languages at home
- 73% English-only · Spanish 15% Other Asian/Pacific 4% Other Indo-European 3%
Political lean MEDSL · Washington
- 2024 margin
- Solid D (+34.0) · D 65.3% · R 31.3% · Other 3.4%
- 2008→2024 swing
- +11.8pp toward D · 2008: 22.1pp · 2024: 34.0pp
- All cycles
- 2024: D+34.0 2020: D+34.6 2016: D+26.7 2012: D+17.5 2008: D+22.1
Not yet ingested
- Civics
- —
Market trends
- HPI YoY
- ▼ -456.64%
- Current HPI
- 294.9757
- Rent YoY
- ▼ -1.34%
- Metro
- Portland-Vancouver-Hillsboro, OR-WA
- State GDP YoY
- ▲ 2.05%
- F500 in state
- 2
Industry mix (Fortune 500 HQ in OR)
| Industry | F500 HQs | Revenue |
|---|---|---|
| Consumer Goods | 1 | $51B |
|
||
Price history
+231.6% since first listed4 events — show timeline
- 2026-06-17 Listed $3,150,000 RMLS
- 2012-04-16 Sold (MLS) $970,000 RMLS
- 2011-11-16 Pending — RMLS
- 2011-10-27 Listed $950,000 RMLS
Cash-flow waterfall
monthlySold comps — $/sqft
last 12 mo · ≤1 miLoading sold comps…