 Duplex
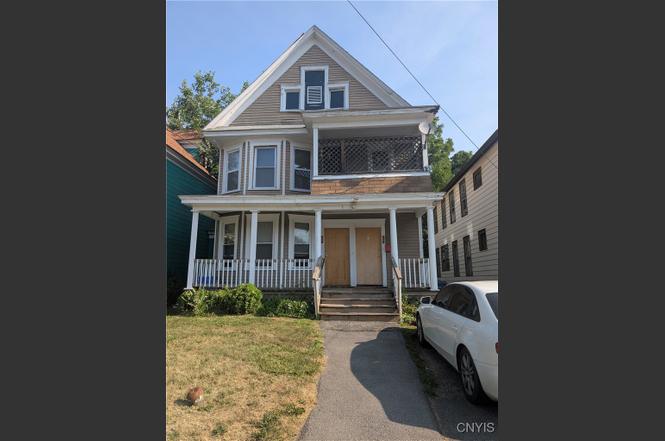
248 Rockland Ave #50 · Syracuse, NY
Flood risk 1/10 · Minimal
- FEMA flood zone
- X (unshaded)
- Chance of flooding over 30 yrs
- 0.0%
- Est. flood insurance / yr
- $473 – $860
Fire risk 1/10 · Minimal
- Est. fire insurance / yr
- $691 – $1,283
Heat risk 3/10 · Minor
- Hot days now (above 95°F)
- 7 days/yr
- Hot days in 30 yrs
- 16 days/yr
Wind risk 1/10 · Minimal
- Chance of severe wind over 30 yrs
- 1.0%
Air-quality risk 2/10 · Minimal
- Unhealthy air days now
- 0 days/yr
- Unhealthy air days in 30 yrs
- 1 days/yr
Risk factors via First Street. Map © Google.
Why this score? — see what drove the B grade
The composite is a weighted blend of 9 inputs, each scored 0–100. Each bar is that input's sub-score; the figure is the points it added to the 100-point composite (weight × sub-score).
- Cash flow +30.0/30.0
- ARV discount +11.4/15.0
- 1% rule +10.0/10.0
- DSCR +10.0/10.0
- Livability +3.9/5.0
- Rent growth +2.5/5.0
- Condition / age +2.5/5.0
- Schools +1.8/10.0
- Appreciation +0.0/10.0
$114,900
🖨 Deal sheet (PDF) 📄 Offer letter ✓ Due diligence
Multi-family units
County records classify this as Multi-Family (2-4 Unit). Listing-text estimate: 2 units. confirmed
Listing remarks
Final and Best Offers due Sunday 3/22 5:30 pm. Two family in good condition, with newer furnaces and water heaters. Each flat is 1100+ sq ft and has three bedrooms and 1 full bath. There are separate utilities for each unit. There is a full basement and a full walk-up attic. This would make a nice investment property, or you could occupy one apartment and rent the other to pay your mortgage. These are nice-sized units. The average rent for all bedrooms and all property types in 13207 is $1,395 Delayed showings and negotiations until December 17, 2025
Key facts
- Separate utilities
- Newer water heaters
- Newer furnaces
Tags
Neighborhood map
What this means for you Summary
Snapshot
- This is a 2 × 3-bed/1.0-bath units multifamily listed at $115k.
Deal economics
- At list price, monthly cash flow is $2k ($25k/yr) — positive. Per door: $1k/mo.
- The deal already cash-flows at list — no discount required.
- Meets the 1% rule at list price ($4k rent vs $115k).
- Recommended offer: $105k (9.0% below list) — sets the bar for market timing.
- Cap rate 28.3% vs local median 8.2% in Syracuse — top-decile yield for the area; either an underpriced asset or a hidden risk that comps aren't pricing in. Stress-test before assuming the spread holds.
Location & tenants
- Location reads 77/100 on livability (#187 in NY, #2,869 nationally) — a middle-class / working-renter tenant base. Strengths: amenities A+, commute A+, cost of living A+; Watch: crime F, employment D-.
- Syracuse City School District (urban): math 18% / reading 26% proficiency, ranked #590 of 590 in NY (top 100%) — low school quality limits family demand, transient renter base, plan for 1-2y turnover; 74% free/reduced lunch — lower-income household profile, screen leases tightly.
- Zoned schools: Syracuse Latin School (math 31% / reading 62%, grade D-, #1,262 of 2,108 statewide, top 60%, 642 students, 42% FRL); Expeditionary Learning Middle School (math 17% / reading 32%, grade F, #611 of 729 statewide, top 88%, 170 students, 76% FRL); Corcoran High School (math 61% / reading 62%, grade B-, #842 of 1,100 statewide, top 77%, 1,252 students, 87% FRL).
- Zoned-school proficiency averages 44% at this address vs 22% district-wide (+22 pts) — the actual schools serving this property are materially stronger than the Syracuse City School District average implies; a family-tenant draw the district grade alone would hide.
- Market conditions: 64 active listings in the ZIP; 616 units permitted in Onondaga County in 2024 (256 in 5+ unit buildings).
Forward outlook
- Local home prices are declining (-3.0%/yr); year-one equity from $794 of loan paydown is wiped out by about $3k of value loss. Plan a longer hold.
- Onondaga County population projected to shrink 9% by 2050 — rents likely to lag national; underwrite the cash flow, not the appreciation.
- At projected returns (-3.0% appreciation + 3.0% rent growth), your $32k cash investment doubles in ~2 years — after that, you're playing with house money.
Negotiation context
- It's been on market 120 days — a 9% lower offer ($105k) is reasonable based on typical stale-listing flexibility.
- 2 sale attempts with the ask held roughly flat each time — persistent listings suggest the price (not the market) is what's stuck; bring a comps-based counter.
- Current owner paid $16k; list at $115k implies a 623% gain — meaningful room to come down on a strong offer.
Risks & watch-outs
- Watch-outs: built in 1910 — expect roof / HVAC / electrical / plumbing capex.
Questions for the listing agent
- It's been on market 120 days. Have you received any prior offers? Is the seller open to a 9% concession, seller financing, or rate buy-down credit?
- Can we see the unit-by-unit rent roll, current vacancy, and any below-market leases? What's the average tenancy length?
- What capital expenditures (roof, boiler, parking lot, exteriors) have been made in the last 5 years, and what's planned in the next 2?
- Built in 1910 — when were the roof, HVAC, electrical panel, plumbing, and water heater last replaced?
- Why hasn't it sold? Are there any deal-killer items the seller is aware of (foundation, flood, title, zoning, code violations)?
- Is there a deadline driving the sale (1031 exchange, divorce, estate, relocation)? That informs how much negotiation room exists.
- Schools are D-rated, which usually means shorter tenancies and higher turnover. Who's the typical renter profile here, and what's been the actual vacancy rate?
- Crime grade is F in this area — have there been break-ins, vandalism, or insurance claims at this property in the last 3 years? What carrier currently insures it and at what premium?
- What's the average days-on-market for RENTAL listings here right now (not sales)? A rising rental-DOM trend means longer vacancies and softer asking-rent achievability than the comps imply.
- What's the recent tenant-quality profile in this submarket — average credit score on applications, eviction rate, late-payment / NSF rate, and stable-employment percentage? A property-management company in the area should have these aggregated.
- How much new apartment / multifamily construction is in the pipeline within 1–3 miles? Heavy new supply (>2% of stock underway) typically softens rents 12–24 months out; light construction supports rent growth.
Investment metrics
- 1% rule
- 3.13% ✓
- Cap rate
- 28.27%
- Cash-on-cash
- 78.50%
- DSCR
- 4.49
- GRM
- 2.7
CMA / ARV
- ARV (on-the-fly)
- $125,664
- Comps found
- 12
Show comp detail 12 sales within ~0.75 mi
| Address | Dist | Beds/Ba | Sqft | Sold | Price | $/sf | Match |
|---|---|---|---|---|---|---|---|
| 1420 Midland Ave | 0.34mi | 6/2.0 | 2,306 (+3%) | 2mo | $100,000 | $43 | 78 |
| 140 Hatch & Elmhurst Ave | 0.33mi | 6/3.0 | 2,268 (+1%) | 3mo | $180,000 | $79 | 76 |
| 1541 South Ave #43 | 0.15mi | 6/2.0 | 2,064 (-8%) | 6mo | $119,000 | $58 | 75 |
| 337 W Kennedy St | 0.36mi | 6/3.0 | 2,326 (+4%) | 3mo | $110,000 | $47 | 71 |
| 317 Marguerite Ave #19 | 0.31mi | 6/2.0 | 2,406 (+7%) | 4mo | $179,000 | $74 | 71 |
| 221 Mclennan Ave #23 | 0.51mi | 6/2.0 | 2,288 (+2%) | 8mo | $127,000 | $56 | 66 |
| 217-19 Valley Dr | 0.48mi | 5/3.5 (-1) | 2,212 (-1%) | 2mo | $240,000 | $108 | 62 |
| 236-38 Webster Ave #38 | 0.64mi | 6/2.0 | 2,086 (-7%) | 1mo | $27,000 | $13 | 58 |
| 417 Roberts Ave #19 | 0.73mi | 6/2.0 | 2,304 (+3%) | 4mo | $252,550 | $110 | 58 |
| 152 Fage Ave #54 | 0.46mi | 6/2.0 | 2,506 (+12%) | 8mo | $110,000 | $44 | 52 |
| 164 Hudson St #66 | 0.69mi | 6/2.0 | 2,496 (+11%) | 5mo | $90,250 | $36 | 45 |
| 705 South Ave | 0.52mi | 6/2.0 | 1,920 (-14%) | 8mo | $105,000 | $55 | 44 |
Match score weights: distance 35% · size 25% · config 20% · recency 20%. Top-matched comps best support the ARV.
Projected returns pro-forma
-3.0% appreciation · 3.0% rent growth · sell at horizon
- IRR
- 78.6%
- Equity multiple
- 4.59×
- Total profit
- $115,436
- Equity at exit
- $17,132
- IRR
- 82.1%
- Equity multiple
- 9.49×
- Total profit
- $273,193
- Equity at exit
- $9,934
Cash invested: $32,172 (down + closing). Projections, not guarantees.
Landlord ↔ Tenant lean methodology
- Overall (STATE)
- 15 Strongly Tenant-Friendly
- State New York
- 15 Strongly Tenant-Friendly · D+10
- County
- — inherits STATE
- City
- — inherits STATE
ZIP-level market 13207
- Home prices YoY
- -23.0%
- Active inventory
- 64
- Price-to-rent
- 5.3×
Monthly cashflow live
- Estimated rent
- $3,599 high interval (Pro) →
- Mortgage (P&I)
- −$603
- Tax from tax record
- −$88 /mo · $1,060/yr
- Insurance
- −$48
- HOA
- −$0
- Vacancy / Maint / Mgmt
- −$756
- Net cashflow
- $2,104
Break-even live
Sensitivity live
| Price | -10% $2,170 | -5% $2,137 | +0% $2,104 | +5% $2,072 | +10% $2,039 |
|---|---|---|---|---|---|
| Rent | -10% $1,820 | -5% $1,962 | +0% $2,104 | +5% $2,247 | +10% $2,389 |
| Rate | -1.0pp $2,162 | -0.5pp $2,134 | base $2,104 | +0.5pp $2,075 | +1.0pp $2,044 |
2-unit breakdown (identical units grouped — click to expand)
| Units | Beds | Baths | Est. rent |
|---|---|---|---|
| 2× units | 3 | 1 | $3,598 |
| #1 | 3 | 1 | $1,799 |
| #2 | 3 | 1 | $1,799 |
| Total (2 units) | $3,599 | ||
UW: 25.0% down · 7.5% · 30yr · 1.5% tax · 5.0% vac · 8.0% maint · 8.0% mgmt
Financing live
Cash to close
- Down payment
- $28,725
- Closing costs
- $3,447
- Reserves months
- —
- Total cash needed
- —
Loan-product check · same deal, 3 products live
Conventional
25% down · 7.5% · 30yr
- Down + closing
- —
- Monthly P&I
- —
- Monthly cashflow
- —
- DSCR
- —
- Eligible?
- —
Personal DTI + credit; lowest rate.
DSCR
20% down · 8.5% · 30yr
- Down + closing
- —
- Monthly P&I
- —
- Monthly cashflow
- —
- DSCR
- —
- Eligible?
- —
No personal income docs; deal must DSCR.
Hard money
10% down · 12.0% · 12mo
- Down + closing
- —
- Monthly P&I
- —
- Monthly cashflow
- —
- DSCR
- —
- Eligible?
- —
Short-term bridge; refi at stabilization.
Listing history 7 events
-
2026-04-02status Pending
-
2026-03-23historical Active Under Contract
-
2026-03-18status Active
-
2025-12-26historical Active Under Contract
-
2025-12-02$114,900 Active
-
2016-09-19soldstatus $15,900
-
2004-07-16soldstatus $28,500
ⓘ Source: listings_history table (triggers on properties + properties_extension) + one-shot
backfill from property_details.listing_events for pre-trigger history.
Tax reassessment forecast NY · Partial reset (capped growth)
- Current annual tax
- $1,060 · $88/mo
- Projected year-2 tax
- $1,501 · $125/mo
- Expected delta
- +$441/yr (+$37/mo · 41.6%)
ⓘ Screening estimate from a state-policy table — verify with the county assessor before closing.
Climate risk First Street
- Flood 1/10 Low FEMA zone X (unshaded) · 0% chance over 30 yrs
- Wildfire 1/10 Low
- Heat 3/10 Moderate 7 d/yr ≥95°F today · 16 d/yr by 30 yrs out
- Wind 1/10 Low 100% chance of damaging wind over 30 yrs
- Air quality 2/10 Low 0 unhealthy d/yr today · 1 by 30 yrs out
Nearby sold comps map
Loading sold comps map…
Walkable amenities ~0.75 mi
Loading nearby amenities…
Taxation est. · year 1
- Rental income
- $43,188
- − Mortgage interest
- −$6,436
- − Property taxes
- −$1,060
- − Insurance
- −$574
- − Repairs & maintenance
- −$3,455
- − Management
- −$3,455
- − Depreciation
- −$3,343
- Taxable income
- $24,865
- Est. tax owed @ 24.0%
- −$5,968
- After-tax cash flow
- $19,286/yr
For passive investors: Depreciation is non-cash, so a rental often shows a tax loss while cash-flowing — sheltering income. Rental losses are passive: they offset passive income freely, and up to $25,000/yr can offset ordinary (W-2) income if you actively participate and your MAGI is under $100k (phasing out to $0 by $150k); unused losses carry forward. On sale, claimed depreciation is recaptured at up to 25%, and gains may owe capital-gains tax (a 1031 exchange can defer both). Figures are a year-1 estimate at your 24.0% rate — not tax advice; consult a CPA.
Schools (NCES district)
- District
- Syracuse City School District
- NCES district ID
- 3628590
- Math proficiency
- 18% ▼ -5.00%
- Reading proficiency
- 26% ▬ 0.00%
- Median HH income
- $32,097
- Composite
- 17.83/100
- National rank
- #9007
- State rank
- #590 of 590 in NY
Livability — Syracuse
- Score
- 77/100
- State rank
- #187
- US rank
- #2869
Category grades
Schools grade is shown separately in the Schools card above.
Census & demographics
- Census place
- Syracuse, NY
- City population
- 152,627
- Population (ZIP)
- 12,383
Population outlook (Onondaga County) Hauer SSP2
- Today (2025)
- 467,894 people
- By 2030
- 463,381 · -1.0%
- By 2040
- 447,697 · -4.3%
- By 2050
- 426,399 · -8.9%
- By 2075
- 373,661 · -20.1%
- By 2100
- 307,967 · -34.2%
Race, ethnicity, and origin ACS 2023
- Neighborhood character
- Diverse neighborhood (Simpson 0.68)
- Race & ethnicity
- White 43% Black 33% Hispanic / Latino 17% Two or more races 11% Native American 1% Asian 1%
- Hispanic origin (detail)
- Puerto Rican 13% Cuban 1%
- Common ancestry
- Romanian 3% Lithuanian 1% Slovak 1%
- Foreign-born
- 4% · Canada, South Korea
- Languages at home
- 89% English-only · Spanish 9% French/Haitian/Cajun 1%
Political lean MEDSL · Onondaga
- 2024 margin
- D (+17.3) · D 58.6% · R 41.4%
- 2008→2024 swing
- -3.0pp toward R · 2008: 20.3pp · 2024: 17.3pp
- All cycles
- 2024: D+17.3 2020: D+20.6 2016: D+12.8 2012: D+21.1 2008: D+20.3
Not yet ingested
- Civics
- —
Market trends
- HPI YoY
- ▼ -95.17%
- Current HPI
- 318.9257
- Rent YoY
- —
- Metro
- —
- State GDP YoY
- ▲ 2.60%
- F500 in state
- 92
Industry mix (Fortune 500 HQ in NY)
| Industry | F500 HQs | Revenue |
|---|---|---|
| Financial Services | 10 | $950B |
|
||
| Consumer Goods | 9 | $162B |
|
||
| Insurance | 4 | $225B |
|
||
| Telecommunications | 2 | $144B |
|
||
| Pharmaceuticals | 2 | $112B |
|
||
| Media / Entertainment | 2 | $69B |
|
||
Price history
+303.2% since first listed7 events — show timeline
- 2026-04-02 Pending — CNYIS
- 2026-03-23 Contingent — CNYIS
- 2026-03-18 Relisted — CNYIS
- 2025-12-26 Contingent — CNYIS
- 2025-12-02 Listed $114,900 CNYIS
- 2016-09-19 Sold (Public Records) $15,900 Public Records
- 2004-07-16 Sold (Public Records) $28,500 Public Records
Property tax history
+1.1%/yrLatest (2025): $1,060 · +0.0% YoY. Source: county tax records.
Cash-flow waterfall
monthlySold comps — $/sqft
last 12 mo · ≤1 miLoading sold comps…