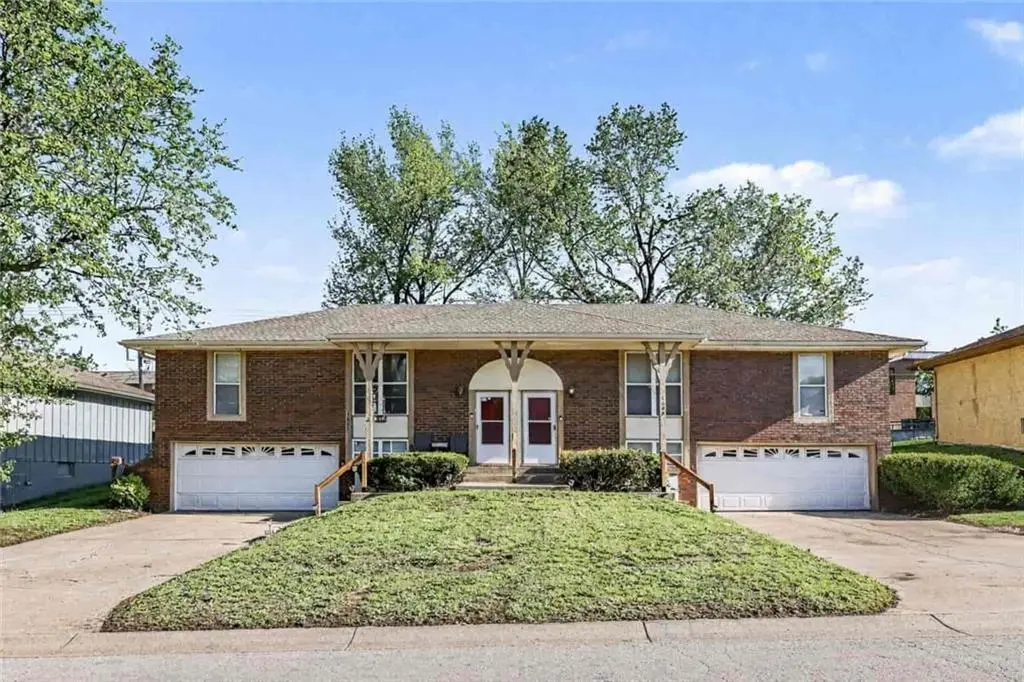
 Duplex
1601-1603 SW Sunset St · Blue Springs, MO
Flood risk 1/10 · Minimal
- FEMA flood zone
- X (unshaded)
- Chance of flooding over 30 yrs
- 0.0%
- Est. flood insurance / yr
- $473 – $860
Fire risk 1/10 · Minimal
- Est. fire insurance / yr
- $1,054 – $1,958
Heat risk 4/10 · Minor
- Hot days now (above 107°F)
- 7 days/yr
- Hot days in 30 yrs
- 16 days/yr
Wind risk 2/10 · Minimal
- Chance of severe wind over 30 yrs
- —
Air-quality risk 4/10 · Minor
- Unhealthy air days now
- 5 days/yr
- Unhealthy air days in 30 yrs
- 5 days/yr
Risk factors via First Street. Map © Google.
Why this score? — see what drove the C- grade
The composite is a weighted blend of 9 inputs, each scored 0–100. Each bar is that input's sub-score; the figure is the points it added to the 100-point composite (weight × sub-score).
- Cash flow +18.7/30.0
- ARV discount +7.8/15.0
- DSCR +5.9/10.0
- Schools +5.1/10.0
- 1% rule +4.4/10.0
- Livability +4.1/5.0
- Rent growth +2.8/5.0
- Condition / age +2.5/5.0
- Appreciation +0.0/10.0
$379,000
🖨 Deal sheet (PDF) 📄 Offer letter ✓ Due diligence
Multi-family units
County records classify this as Multi-Family (2-4 Unit). Listing-text estimate: 2 units. confirmed
Listing remarks
Calling all savvy rental property investors! This charming duplex offers two spacious 3 Bed/1.5 Bath units with excellent natural light. The roof was replaced in 2021 and windows in 2020. Both units are currently occupied at $1,200/month and $1,400/month (market rents ~$1,595). The well-kept units have clean classic finishes, featuring finished basements and attached 2-car garages. Future cosmetic renovations will bring corresponding rental income upside. Located in family-friendly Blue Springs near Blue Springs School District schools (Blue Springs High, James Lewis Elementary), St. Mary's Medical Center, convenient I-70/I-470 access, Lake Jacomo, Fleming Park, and Burr Oak Woods Conservat
Key facts
- Finished basements
- Lake jacomo
- I-70/i-470 access
Tags
Property features AI
Finance
- Financial info: Gross income reported at $38,280; Operating expenses include real estate tax
- HOA & community: No association fees
Exterior
- Parking: Attached garage
- Utilities: Public water; Public sewer; Separate meters
- Home design: Duplex residential income property; Single-story
- Construction: Brick/mortar construction; Composition roof
- Exterior features: Lot approximately 10,117 square feet; Not in a flood plain
Interior
- Bedrooms: Three-bedroom units (two total units)
- Bathrooms: Each unit has one full bathroom and one half bathroom
- Heating & cooling: Natural gas heating; Electric cooling
- Interior features: Basement present
Neighborhood map
What this means for you Summary
Snapshot
- This is a 2 × 3.0-bed/1.5-bath units multifamily listed at $379k.
Deal economics
- At list price, monthly cash flow is $376 ($5k/yr) — positive. Per door: $188/mo.
- The deal already cash-flows at list — no discount required.
- To meet the 1% rule (rent ≥ 1% of price), the offer needs to be $356k (6.0% below list).
- Recommended offer: $356k (6.0% below list) — sets the bar for 1% rule.
- Cap rate 7.5% vs local median 3.2% in Blue Springs — top-decile yield for the area; either an underpriced asset or a hidden risk that comps aren't pricing in. Stress-test before assuming the spread holds.
Location & tenants
- Location reads 82/100 on livability (#11 in MO, #1,297 nationally) — a professional / high-income tenant draw. Strengths: cost of living A+, housing A+, health & safety A+; Watch: commute F.
- Blue Springs R-IV (suburban): math 55% / reading 60% proficiency, ranked #17 of 324 in MO (top 5%) — acceptable for families but not a draw, mixed tenant base, ~2y average lease.
- Market conditions: Rents rising (+1.0%/yr); 141 active listings in the ZIP; 3 comparable units currently listed for rent nearby; rentals leasing fast (median 8d on market — plan ~1-2 weeks tenant-placement turnaround); solid renter incomes; 4,002 units permitted in Jackson County in 2024 (2,271 in 5+ unit buildings).
- At $3,563/mo this rent would consume 51% of the median local household income ($85k/yr) (locally 555% of renters already pay >50% of income on rent) — very limited rent-growth headroom before tenants either downsize or default.
Forward outlook
- Local home prices are declining (-3.0%/yr); year-one equity from $3k of loan paydown is wiped out by about $11k of value loss. Plan a longer hold.
- Jackson County population projected at +4% by 2050 — modest demand growth; plan on rents tracking national, not racing it.
Negotiation context
- It's been on market 46 days — a 3% lower offer ($368k) is reasonable based on typical stale-listing flexibility.
- 2 sale attempts with the ask held roughly flat each time — persistent listings suggest the price (not the market) is what's stuck; bring a comps-based counter.
Questions for the listing agent
- It's been on market 46 days. Have you received any prior offers? Is the seller open to a 6% concession, seller financing, or rate buy-down credit?
- Can we see the unit-by-unit rent roll, current vacancy, and any below-market leases? What's the average tenancy length?
- What capital expenditures (roof, boiler, parking lot, exteriors) have been made in the last 5 years, and what's planned in the next 2?
- Built in 1972 — when were the roof, HVAC, electrical panel, plumbing, and water heater last replaced?
- Is there a deadline driving the sale (1031 exchange, divorce, estate, relocation)? That informs how much negotiation room exists.
- Schools are A-rated — typically a magnet for longer-tenancy family renters. What's the average tenant stay here, and is there a school-zone premium baked into asking?
- What's the average days-on-market for RENTAL listings here right now (not sales)? A rising rental-DOM trend means longer vacancies and softer asking-rent achievability than the comps imply.
- What's the recent tenant-quality profile in this submarket — average credit score on applications, eviction rate, late-payment / NSF rate, and stable-employment percentage? A property-management company in the area should have these aggregated.
- How much new apartment / multifamily construction is in the pipeline within 1–3 miles? Heavy new supply (>2% of stock underway) typically softens rents 12–24 months out; light construction supports rent growth.
Investment metrics
- 1% rule
- 0.94% ✗
- Cap rate
- 7.48%
- Cash-on-cash
- 4.25%
- DSCR
- 1.19
- GRM
- 8.9
CMA / ARV
- ARV (median comp)
- $381,171
- List price
- $379,000
- Delta
- -0.57%
- Verdict
- FAIR
- Comps
- 12 within 1.0 mi
Projected returns pro-forma
-3.0% appreciation · 1.01% rent growth · sell at horizon
- IRR
- -11.8%
- Equity multiple
- 0.58×
- Total profit
- $-44,514
- Equity at exit
- $56,510
- IRR
- -5.7%
- Equity multiple
- 0.66×
- Total profit
- $-35,732
- Equity at exit
- $32,769
Cash invested: $106,120 (down + closing). Projections, not guarantees.
Landlord ↔ Tenant lean methodology
- Overall (STATE)
- 81 Strongly Landlord-Friendly
- State Missouri
- 81 Strongly Landlord-Friendly · R+10
- County
- — inherits STATE
- City
- — inherits STATE
ZIP-level market 64015
- Rents YoY
- 1.0%
- Active inventory
- 141
- Price-to-rent
- 17.7×
Monthly cashflow live
- Estimated rent
- $3,563 high interval (Pro) →
- Mortgage (P&I)
- −$1,988
- Tax from tax record
- −$293 /mo · $3,519/yr
- Insurance
- −$158
- HOA
- −$0
- Vacancy / Maint / Mgmt
- −$748
- Net cashflow
- $376
Break-even live
Sensitivity live
| Price | -10% $591 | -5% $483 | +0% $376 | +5% $269 | +10% $162 |
|---|---|---|---|---|---|
| Rent | -10% $95 | -5% $235 | +0% $376 | +5% $517 | +10% $658 |
| Rate | -1.0pp $567 | -0.5pp $472 | base $376 | +0.5pp $278 | +1.0pp $178 |
2-unit breakdown (identical units grouped — click to expand)
| Units | Beds | Baths | Est. rent |
|---|---|---|---|
| 2× units | 3.0 | 1.5 | $3,564 |
| #1 | 3.0 | 1.5 | $1,782 |
| #2 | 3.0 | 1.5 | $1,782 |
| Total (2 units) | $3,563 | ||
UW: 25.0% down · 7.5% · 30yr · 1.5% tax · 5.0% vac · 8.0% maint · 8.0% mgmt
Financing live
Cash to close
- Down payment
- $94,750
- Closing costs
- $11,370
- Reserves months
- —
- Total cash needed
- —
Loan-product check · same deal, 3 products live
Conventional
25% down · 7.5% · 30yr
- Down + closing
- —
- Monthly P&I
- —
- Monthly cashflow
- —
- DSCR
- —
- Eligible?
- —
Personal DTI + credit; lowest rate.
DSCR
20% down · 8.5% · 30yr
- Down + closing
- —
- Monthly P&I
- —
- Monthly cashflow
- —
- DSCR
- —
- Eligible?
- —
No personal income docs; deal must DSCR.
Hard money
10% down · 12.0% · 12mo
- Down + closing
- —
- Monthly P&I
- —
- Monthly cashflow
- —
- DSCR
- —
- Eligible?
- —
Short-term bridge; refi at stabilization.
Rent comps 3 comps
| Address | Beds | Baths | Sqft | Rent | $/sqft | DOM | Units | Dist |
|---|---|---|---|---|---|---|---|---|
| 1707 SW Walnut St Blue Springs, MO | 4.0 | 2.0 | 1800 | $2,600 | $1.44 | 17d | 1 | 0.56mi |
| 900 SE Tequesta Ln Blue Springs, MO | 3.0 | 2.5–3.5 | 1647 | $2,128 | $1.29 | 2d | 11 | 1.27mi |
| 401 SE Westminister Rd Blue Springs, MO | 3.0 | 3.0 | 2050 | $2,206 | $1.08 | 8d | 1 | 1.31mi |
Listing history 21 events
-
2026-06-18days on market $379,000 Active 46 DOM
-
2026-06-17days on market $379,000 Active 45 DOM
-
2026-06-16days on market $379,000 Active 44 DOM
-
2026-06-15days on market $379,000 Active 43 DOM
-
2026-06-13days on market $379,000 Active 41 DOM
-
2026-06-13days on market $379,000 Active 40 DOM
-
2026-06-09days on market $379,000 Active 37 DOM
-
2026-06-08days on market $379,000 Active 36 DOM
-
2026-06-07days on market $379,000 Active 35 DOM
-
2026-06-05days on market $379,000 Active 32 DOM
-
2026-06-03days on market $379,000 Active 31 DOM
-
2026-06-02days on market $379,000 Active 30 DOM
-
2026-06-01days on market $379,000 Active 29 DOM
-
2026-05-31days on market $379,000 Active 28 DOM
-
2026-05-03$379,000 Active 815-char remark
-
2026-03-18historical
-
2025-11-18$2,200,000 Active
-
2003-11-10soldstatus
-
2001-05-25soldstatus
-
1999-05-21soldstatus
-
1994-10-26soldstatus
ⓘ Source: listings_history table (triggers on properties + properties_extension) + one-shot
backfill from property_details.listing_events for pre-trigger history.
Tax reassessment forecast MO · Resets to sale price
- Current annual tax
- $3,519 · $293/mo
- Projected year-2 tax
- $3,676 · $306/mo
- Expected delta
- +$157/yr (+$13/mo · 4.5%)
ⓘ Screening estimate from a state-policy table — verify with the county assessor before closing.
Climate risk First Street
- Flood 1/10 Low FEMA zone X (unshaded) · 0% chance over 30 yrs
- Wildfire 1/10 Low
- Heat 4/10 Moderate 7 d/yr ≥107°F today · 16 d/yr by 30 yrs out
- Wind 2/10 Low
- Air quality 4/10 Moderate 5 unhealthy d/yr today · 5 by 30 yrs out
Nearby sold comps map
Loading sold comps map…
Walkable amenities ~0.75 mi
Loading nearby amenities…
Taxation est. · year 1
- Rental income
- $42,756
- − Mortgage interest
- −$21,230
- − Property taxes
- −$3,519
- − Insurance
- −$1,895
- − Repairs & maintenance
- −$3,420
- − Management
- −$3,420
- − Depreciation
- −$11,025
- Taxable loss
- −$1,754
- Est. tax savings @ 24.0%
- +$421
- After-tax cash flow
- $4,934/yr
For passive investors: Depreciation is non-cash, so a rental often shows a tax loss while cash-flowing — sheltering income. Rental losses are passive: they offset passive income freely, and up to $25,000/yr can offset ordinary (W-2) income if you actively participate and your MAGI is under $100k (phasing out to $0 by $150k); unused losses carry forward. On sale, claimed depreciation is recaptured at up to 25%, and gains may owe capital-gains tax (a 1031 exchange can defer both). Figures are a year-1 estimate at your 24.0% rate — not tax advice; consult a CPA.
Schools (NCES district)
- District
- Blue Springs R-IV
- NCES district ID
- 2905310
- Math proficiency
- 55% ▼ -10.00%
- Reading proficiency
- 60% ▼ -6.00%
- Median HH income
- $67,959
- Composite
- 50.71/100
- National rank
- #1819
- State rank
- #17 of 324 in MO
Livability — Blue Springs
- Score
- 82/100
- State rank
- #11
- US rank
- #1297
Category grades
Schools grade is shown separately in the Schools card above.
Census & demographics
- Census place
- Blue Springs, MO
- County
- Jackson County · 687,798 people
- City population
- 61,033
- Metro
- Kansas City, MO-KS
- Population (ZIP)
- 32,245
- Household income
- $84,518
- Rent vs Own
- Severe rent burden
- 555.0
Population outlook (Jackson County) Hauer SSP2
- Today (2025)
- 719,589 people
- By 2030
- 731,456 · +1.6%
- By 2040
- 746,689 · +3.8%
- By 2050
- 749,289 · +4.1%
- By 2075
- 736,227 · +2.3%
- By 2100
- 668,210 · -7.1%
Race, ethnicity, and origin ACS 2023
- Neighborhood character
- Predominantly White (80%)
- Race & ethnicity
- White 80% Black 7% Two or more races 7% Hispanic / Latino 7% Asian 1%
- Hispanic origin (detail)
- Mexican 5%
- Common ancestry
- Italian 11% Slovak 3% Lithuanian 2%
- Foreign-born
- 2% · Canada, Vietnam
- Languages at home
- 96% English-only · Spanish 2%
Political lean MEDSL · Jackson
- 2024 margin
- D (+19.3) · D 58.9% · R 39.5% · Other 1.6%
- 2008→2024 swing
- -6.1pp toward R · 2008: 25.4pp · 2024: 19.3pp
- All cycles
- 2024: D+19.3 2020: D+22.0 2016: D+16.6 2012: D+19.0 2008: D+25.4
Not yet ingested
- Civics
- —
Market trends
- HPI YoY
- ▼ -199.47%
- Current HPI
- 232.221
- Rent YoY
- ▲ 1.01%
- Metro
- Kansas City, MO-KS
- State GDP YoY
- ▲ 1.84%
- F500 in state
- 20
Industry mix (Fortune 500 HQ in MO)
| Industry | F500 HQs | Revenue |
|---|---|---|
| Healthcare | 1 | $163B |
|
||
| Insurance | 1 | $21B |
|
||
| Industrial Technology | 1 | $17B |
|
||
| Retail | 1 | $16B |
|
||
| Industrial Distribution | 1 | $10B |
|
||
| Utilities | 1 | $9B |
|
||
Price history
-82.8% since first listed7 events — show timeline
- 2026-05-03 Listed $379,000 Heartland MLS as Distributed by MLS Grid
- 2026-03-18 Listing Removed — Heartland MLS as Distributed by MLS Grid
- 2025-11-18 Listed $2,200,000 Heartland MLS as Distributed by MLS Grid
- 2003-11-10 Sold (Public Records) — Public Records
- 2001-05-25 Sold (Public Records) — Public Records
- 1999-05-21 Sold (Public Records) — Public Records
- 1994-10-26 Sold (Public Records) — Public Records
Property tax history
+5.0%/yrLatest (2025): $3,519 · -24.3% YoY. Source: county tax records.
Cash-flow waterfall
monthlySold comps — $/sqft
last 12 mo · ≤1 miLoading sold comps…