150 W Catalina Dr · Yuma, AZ
Flood risk 1/10 · Minimal
- FEMA flood zone
- X (shaded)
- Chance of flooding over 30 yrs
- 0.0%
- Est. flood insurance / yr
- $507 – $1,088
Fire risk 1/10 · Minimal
- Est. fire insurance / yr
- $610 – $1,132
Heat risk 9/10 · Severe
- Hot days now (above 113°F)
- 7 days/yr
- Hot days in 30 yrs
- 20 days/yr
Wind risk 1/10 · Minimal
- Chance of severe wind over 30 yrs
- —
Air-quality risk 2/10 · Minimal
- Unhealthy air days now
- 2 days/yr
- Unhealthy air days in 30 yrs
- 2 days/yr
Risk factors via First Street. Map © Google.
Why this score? — see what drove the D grade
The composite is a weighted blend of 9 inputs, each scored 0–100. Each bar is that input's sub-score; the figure is the points it added to the 100-point composite (weight × sub-score).
- Cash flow +15.0/30.0
- ARV discount +7.5/15.0
- 1% rule +5.0/10.0
- DSCR +5.0/10.0
- Livability +3.6/5.0
- Rent growth +3.0/5.0
- Condition / age +2.5/5.0
- Schools +1.3/10.0
- Appreciation +0.0/10.0
$13,500
🖨 Deal sheet (PDF) 📄 Offer letter ✓ Due diligence
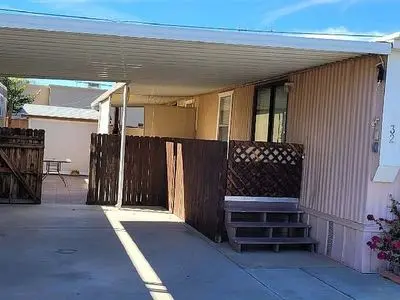
Listing remarks
This home is priced to sell as we have decided to move on . Sweet place with eat in kitchen , a new sink and butcher block countertop . All appliances included. Lots of storage space plus an outdoor shed in a large fenced area, great for relaxing and enjoying an evening meal and a great space for your furry friends. Club house and heated pool included plus water and garbage are included in the 425.00 rent. To much to list . Come and check this home out . It is located in a 55 plus community.
Key facts
- Eat in kitchen
- New sink
- Outdoor shed
Tags
Property features AI
Exterior
- Home design: Built in 1986
- Construction: 1986 construction
- Exterior features: Located in the Country Club Manor subdivision
Neighborhood map
What this means for you Summary
Snapshot
- This is a 2-bed/1.0-bath manufactured listed at $14k.
Deal economics
- At list price, monthly cash flow is $966 ($12k/yr) — positive.
- The deal already cash-flows at list — no discount required.
- Meets the 1% rule at list price ($1k rent vs $14k).
- Recommended offer: $13k (1.5% below list) — sets the bar for market timing.
- Cap rate 92.1% vs local median 3.9% in Yuma — top-decile yield for the area; either an underpriced asset or a hidden risk that comps aren't pricing in. Stress-test before assuming the spread holds.
Location & tenants
- Location reads 71/100 on livability (#30 in AZ) — a middle-class / working-renter tenant base. Strengths: cost of living A+, housing A+, health & safety A+; Watch: crime C-, employment D, commute F.
- Yuma Union High School District (4507) (urban): math 14% / reading 16% proficiency, ranked #212 of 249 in AZ (top 85%) — low school quality limits family demand, transient renter base, plan for 1-2y turnover.
- Zoned schools: Kofa High School (math 13% / reading 15%, grade F, #277 of 381 statewide, top 73%, 2,541 students, 75% FRL).
- Market conditions: Rents rising (+2.0%/yr); 263 active listings in the ZIP; 22 comparable units currently listed for rent nearby; rentals at typical pace (median 16d on market — plan ~3-4 weeks tenant-placement turnaround); 1,399 units permitted in Yuma County in 2024 (180 in 5+ unit buildings).
Forward outlook
- Local home prices are declining (-3.0%/yr); year-one equity from $93 of loan paydown is wiped out by about $405 of value loss. Plan a longer hold.
- Yuma County population projected at +4% by 2050 — modest demand growth; plan on rents tracking national, not racing it.
- At projected returns (-3.0% appreciation + 2.0% rent growth), your $4k cash investment doubles in ~1 year — after that, you're playing with house money.
Negotiation context
- It's been on market 20 days — a 2% lower offer ($13k) is reasonable based on typical stale-listing flexibility.
Risks & watch-outs
- Climate carrying-cost: extreme-heat days projected 7→20/yr by 2055 (HVAC capex compounding) — expect insurance premiums to compound above CPI over the hold.
Questions for the listing agent
- Is there a deadline driving the sale (1031 exchange, divorce, estate, relocation)? That informs how much negotiation room exists.
- The area grade is low — what's the realistic commute time and amenity access for the typical tenant pool here? Any planned neighborhood developments (good or bad) we should know about?
- What's the average days-on-market for RENTAL listings here right now (not sales)? A rising rental-DOM trend means longer vacancies and softer asking-rent achievability than the comps imply.
- What's the recent tenant-quality profile in this submarket — average credit score on applications, eviction rate, late-payment / NSF rate, and stable-employment percentage? A property-management company in the area should have these aggregated.
- How much new for-sale + rental construction is in the pipeline within 1–3 miles? Heavy new supply typically softens prices + rents 12–24 months out; constrained supply supports both.
Investment metrics
- 1% rule
- 9.93% ✓
- Cap rate
- 92.12%
- Cash-on-cash
- 306.51%
- DSCR
- 14.64
- GRM
- 0.8
CMA / ARV
- ARV (on-the-fly)
- $151,000
- Comps found
- 2
Show comp detail 2 sales within ~0.75 mi
| Address | Dist | Beds/Ba | Sqft | Sold | Price | $/sf | Match |
|---|---|---|---|---|---|---|---|
| 270 W El Camino Dr | 0.67mi | 2/2.0 | 958 (-4%) | 14mo | $145,000 | $151 | 46 |
| 3473 S Hermosa Rd | 0.74mi | 2/2.0 | 882 (-12%) | 2mo | $119,900 | $136 | 40 |
Match score weights: distance 35% · size 25% · config 20% · recency 20%. Top-matched comps best support the ARV.
Projected returns pro-forma
-3.0% appreciation · 2.04% rent growth · sell at horizon
- IRR
- —
- Equity multiple
- 16.36×
- Total profit
- $58,044
- Equity at exit
- $2,013
- IRR
- —
- Equity multiple
- 33.98×
- Total profit
- $124,648
- Equity at exit
- $1,167
Cash invested: $3,780 (down + closing). Projections, not guarantees.
Landlord ↔ Tenant lean methodology
- Overall (STATE)
- 87 Strongly Landlord-Friendly
- State Arizona
- 87 Strongly Landlord-Friendly · R+3
- County
- — inherits STATE
- City
- — inherits STATE
ZIP-level market 85364
- Rents YoY
- 2.0%
- Active inventory
- 263
- Price-to-rent
- 0.8×
Monthly cashflow live
- Estimated rent
- $1,340 high interval (Pro) →
- Mortgage (P&I)
- −$71
- Tax est. 1.5%
- −$17 /mo · $202/yr
- Insurance
- −$6
- HOA
- −$0
- Vacancy / Maint / Mgmt
- −$281
- Net cashflow
- $966
Break-even live
Sensitivity live
| Price | -10% $975 | -5% $970 | +0% $966 | +5% $961 | +10% $956 |
|---|---|---|---|---|---|
| Rent | -10% $860 | -5% $913 | +0% $966 | +5% $1,018 | +10% $1,071 |
| Rate | -1.0pp $972 | -0.5pp $969 | base $966 | +0.5pp $962 | +1.0pp $958 |
UW: 25.0% down · 7.5% · 30yr · 1.5% tax · 5.0% vac · 8.0% maint · 8.0% mgmt
Financing live
Cash to close
- Down payment
- $3,375
- Closing costs
- $405
- Reserves months
- —
- Total cash needed
- —
Loan-product check · same deal, 3 products live
Conventional
25% down · 7.5% · 30yr
- Down + closing
- —
- Monthly P&I
- —
- Monthly cashflow
- —
- DSCR
- —
- Eligible?
- —
Personal DTI + credit; lowest rate.
DSCR
20% down · 8.5% · 30yr
- Down + closing
- —
- Monthly P&I
- —
- Monthly cashflow
- —
- DSCR
- —
- Eligible?
- —
No personal income docs; deal must DSCR.
Hard money
10% down · 12.0% · 12mo
- Down + closing
- —
- Monthly P&I
- —
- Monthly cashflow
- —
- DSCR
- —
- Eligible?
- —
Short-term bridge; refi at stabilization.
Rent comps 22 comps
| Address | Beds | Baths | Sqft | Rent | $/sqft | DOM | Units | Dist |
|---|---|---|---|---|---|---|---|---|
| 225 W Catalina Dr Yuma, AZ | 1.0–2.0 | 1.0–2.0 | 777 | $1,363 | $1.75 | 15d | 7 | 0.15mi |
| 143 W 27th Pl Yuma, AZ | 3.0 | 2.0 | 1277 | $1,500 | $1.17 | 23d | 1 | 0.20mi |
| 2714 S Virginia Dr Yuma, AZ | 2.0 | 1.0 | 750 | $925 | $1.23 | 15d | 2 | 0.21mi |
| 515 E Country Club Dr Unit 515B Yuma, AZ | 2.0 | 1.0 | 800 | $1,200 | $1.50 | 15d | 1 | 0.55mi |
| 517 E Country Club Dr Unit 517D Yuma, AZ | 2.0 | 1.0 | 800 | $1,200 | $1.50 | 15d | 1 | 0.57mi |
| 1169 W 34th St Yuma, AZ | 3.0 | 1.5 | 1430 | $1,750 | $1.22 | 15d | 1 | 0.93mi |
| 1280 W 24th St Unit 02 Yuma, AZ | 2.0 | 2.0 | 750 | $1,250 | $1.67 | 23d | 1 | 0.98mi |
| 1280 W 24th St Apt 23 Yuma, AZ | 2.0 | 1.0 | 700 | $1,200 | $1.71 | 15d | 1 | 1.01mi |
| 1280 W 24th St Unit 32 Yuma, AZ | 2.0 | 1.0 | 700 | $1,200 | $1.71 | 23d | 1 | 1.01mi |
| 1778 W 28th St Yuma, AZ | 3.0 | 2.0 | 1200 | $3,300 | $2.75 | 15d | 1 | 1.06mi |
| 2045 S Walnut Ave Yuma, AZ | 3.0 | 1.0 | 940 | $1,480 | $1.57 | 23d | 1 | 1.10mi |
| 3749 S 4th Ave Unit 224 Yuma, AZ | 2.0 | 2.0 | 960 | $1,400 | $1.46 | 23d | 1 | 1.12mi |
| 2150 S Avenue A #26 Yuma, AZ | 2.0 | 2.0 | 905 | $1,550 | $1.71 | 15d | 1 | 1.13mi |
| 2150 S Avenue A #60 Yuma, AZ | 2.0 | 2.0 | 905 | $1,050 | $1.16 | 15d | 1 | 1.13mi |
| 2533 S Olivia Ave Yuma, AZ | 3.0 | 2.0 | 1287 | $1,495 | $1.16 | 15d | 1 | 1.18mi |
| 1900 W 30th St Yuma, AZ | 2.0–3.0 | 2.0 | 1024 | $804 | $0.79 | 15d | 1 | 1.19mi |
| 2369 S Camino Tierra Yuma, AZ | 3.0 | 2.0 | 1479 | $2,300 | $1.56 | 15d | 1 | 1.21mi |
| 2240 S Elks Ln #37 Yuma, AZ | 2.0 | 1.5 | 1212 | $1,950 | $1.61 | 15d | 1 | 1.23mi |
| 1103 W 20th St Unit 1005 Yuma, AZ | 2.0 | 1.0 | 742 | $1,000 | $1.35 | 15d | 1 | 1.26mi |
| 2155 S 14th Ave #16 Yuma, AZ | 2.0 | 2.0 | 1200 | $1,300 | $1.08 | 15d | 1 | 1.29mi |
| 1955 South Avenue A Unit A Yuma, AZ | 3.0 | 1.5 | 1308 | $1,400 | $1.07 | 23d | 1 | 1.34mi |
| 1910 S Avenue A Yuma, AZ | 2.0 | 1.0 | 543 | $970 | $1.79 | 15d | 5 | 1.36mi |
Listing history 13 events
-
2026-06-15days on market $13,500 Active 20 DOM
-
2026-06-14days on market $13,500 Active 18 DOM
-
2026-06-13days on market $13,500 Active 17 DOM
-
2026-06-10days on market $13,500 Active 15 DOM
-
2026-06-09days on market $13,500 Active 14 DOM
-
2026-06-08days on market $13,500 Active 13 DOM
-
2026-06-07days on market $13,500 Active 12 DOM
-
2026-06-05days on market $13,500 Active 9 DOM
-
2026-06-02days on market $13,500 Active 7 DOM
-
2026-06-01days on market $13,500 Active 6 DOM
-
2026-05-31days on market $13,500 Active 5 DOM
-
2026-05-30days on market $13,500 Active 4 DOM
-
2026-05-26$13,500 Active
ⓘ Source: listings_history table (triggers on properties + properties_extension) + one-shot
backfill from property_details.listing_events for pre-trigger history.
Climate risk First Street
- Flood 1/10 Low FEMA zone X (shaded) · 0% chance over 30 yrs
- Wildfire 1/10 Low
- Heat 9/10 Extreme 7 d/yr ≥113°F today · 20 d/yr by 30 yrs out
- Wind 1/10 Low
- Air quality 2/10 Low 2 unhealthy d/yr today · 2 by 30 yrs out
Nearby sold comps map
Loading sold comps map…
Walkable amenities ~0.75 mi
Loading nearby amenities…
Taxation est. · year 1
- Rental income
- $16,083
- − Mortgage interest
- −$756
- − Property taxes
- −$202
- − Insurance
- −$68
- − Repairs & maintenance
- −$1,287
- − Management
- −$1,287
- − Depreciation
- −$393
- Taxable income
- $12,091
- Est. tax owed @ 24.0%
- −$2,902
- After-tax cash flow
- $8,684/yr
For passive investors: Depreciation is non-cash, so a rental often shows a tax loss while cash-flowing — sheltering income. Rental losses are passive: they offset passive income freely, and up to $25,000/yr can offset ordinary (W-2) income if you actively participate and your MAGI is under $100k (phasing out to $0 by $150k); unused losses carry forward. On sale, claimed depreciation is recaptured at up to 25%, and gains may owe capital-gains tax (a 1031 exchange can defer both). Figures are a year-1 estimate at your 24.0% rate — not tax advice; consult a CPA.
Schools (NCES district)
- District
- Yuma Union High School District (4507)
- NCES district ID
- 0409630
- Math proficiency
- 14% ▼ -12.00%
- Reading proficiency
- 16% ▼ -10.00%
- Median HH income
- $40,512
- Composite
- 12.86/100
- National rank
- #9592
- State rank
- #212 of 249 in AZ
Livability — Yuma
- Score
- 71/100
- State rank
- #30
- US rank
- #6635
Category grades
Schools grade is shown separately in the Schools card above.
Census & demographics
- Census place
- Yuma, AZ
- County
- Yuma County · 149,809 people
- City population
- 149,809
- Metro
- Yuma, AZ
- Population (ZIP)
- 72,960
- Household income
- $57,874
- Rent vs Own
- Severe rent burden
- 2195.0
Population outlook (Yuma County) Hauer SSP2
- Today (2025)
- 211,633 people
- By 2030
- 214,114 · +1.2%
- By 2040
- 217,856 · +2.9%
- By 2050
- 220,276 · +4.1%
- By 2075
- 222,359 · +5.1%
- By 2100
- 198,880 · -6.0%
Race, ethnicity, and origin ACS 2023
- Neighborhood character
- Predominantly Hispanic (70%)
- Race & ethnicity
- Hispanic / Latino 70% Two or more races 29% White 24% Asian 2% Black 2% Native American 1%
- Hispanic origin (detail)
- Mexican 67%
- Common ancestry
- Portuguese 1% Lithuanian 1% Romanian 1%
- Foreign-born
- 22% · Canada
- Languages at home
- 48% English-only · Spanish 50% Tagalog/Filipino 1%
Political lean MEDSL · Yuma
- 2024 margin
- Strong R (+20.4) · D 39.3% · R 59.8%
- 2008→2024 swing
- -6.6pp toward R · 2008: -13.8pp · 2024: -20.4pp
- All cycles
- 2024: R+20.4 2020: R+6.2 2016: R+5.5 2012: R+16.1 2008: R+13.8
Not yet ingested
- Civics
- —
Market trends
- HPI YoY
- ▼ -197.00%
- Current HPI
- 220.8058
- Rent YoY
- ▲ 2.04%
- Metro
- Yuma, AZ
- State GDP YoY
- ▲ 4.54%
- F500 in state
- 20
Industry mix (Fortune 500 HQ in AZ)
| Industry | F500 HQs | Revenue |
|---|---|---|
| Technology | 2 | $13B |
|
||
| Mining / Metals | 1 | $23B |
|
||
| Environmental Services | 1 | $16B |
|
||
| Metals / Steel | 1 | $14B |
|
||
| Technology Distribution | 1 | $9B |
|
||
| Homebuilding | 1 | $8B |
|
||
Price history
1 event — show timeline
- 2026-05-26 Listed $13,500 FSBO.com
Property tax history
+2.8%/yrLatest (2025): $14,154 · +3.5% YoY. Source: county tax records.
Cash-flow waterfall
monthlySold comps — $/sqft
last 12 mo · ≤1 miLoading sold comps…