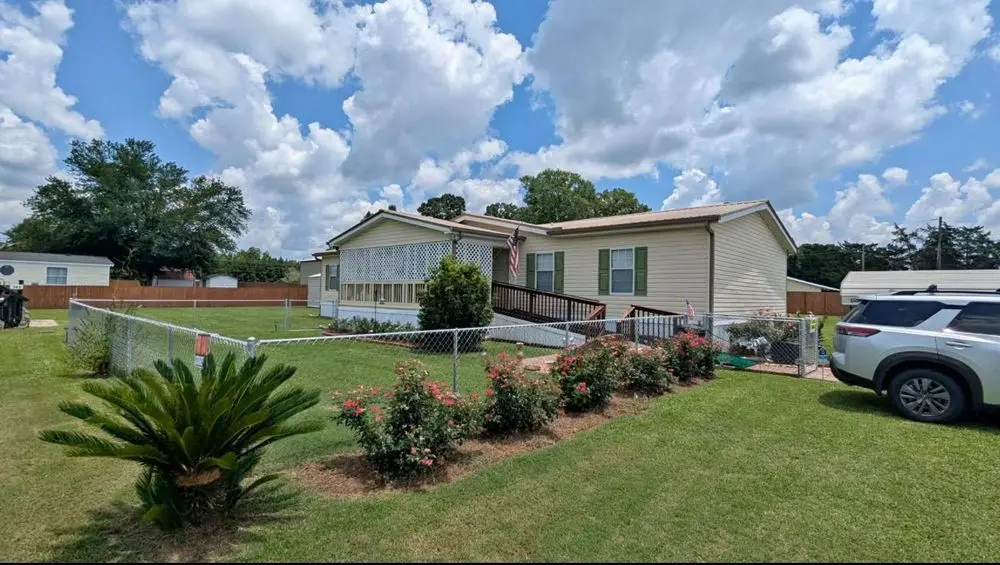
1432 Dunbar Rd · Byron, GA
Flood risk 1/10 · Minimal
- FEMA flood zone
- X (unshaded)
- Chance of flooding over 30 yrs
- 0.0%
- Est. flood insurance / yr
- $507 – $1,088
Fire risk 3/10 · Minor
- Est. fire insurance / yr
- $963 – $1,789
Heat risk 7/10 · Major
- Hot days now (above 108°F)
- 7 days/yr
- Hot days in 30 yrs
- 19 days/yr
Wind risk 7/10 · Major
- Chance of severe wind over 30 yrs
- 78.0%
Air-quality risk 3/10 · Minor
- Unhealthy air days now
- 3 days/yr
- Unhealthy air days in 30 yrs
- 3 days/yr
Risk factors via First Street. Map © Google.
Why this score? — see what drove the B+ grade
The composite is a weighted blend of 9 inputs, each scored 0–100. Each bar is that input's sub-score; the figure is the points it added to the 100-point composite (weight × sub-score).
- Cash flow +30.0/30.0
- ARV discount +15.0/15.0
- 1% rule +10.0/10.0
- DSCR +10.0/10.0
- Schools +3.9/10.0
- Condition / age +3.8/5.0
- Livability +3.4/5.0
- Rent growth +2.5/5.0
- Appreciation +0.0/10.0
$115,000
🖨 Deal sheet 📄 Offer letter ✓ Due diligence
Listing remarks MLS
FOR SALE: Immaculate very well kept 2007 3-Bedroom 2-Bath 32x68 Horton Big Boss Mobile Home Located in Kingridge Senior Park (55+ gated community). Very quiet, clean and safe community. This is mobile home only. Land is not included. Lot rent is $325. Includes storage house and covered parking unit. Perfect for retired person or couple looking to downsize living spaces. Home can be moved.
Key facts
- Gated community
- Storage house
- Covered parking unit
Tags
Neighborhood map
What this means for you Summary
Snapshot
- This is a 3-bed/2.0-bath single-family listed at $115k. Condition is rated good.
Deal economics
- At list price, monthly cash flow is $714 ($9k/yr) — positive.
- The deal already cash-flows at list — no discount required.
- Meets the 1% rule at list price ($2k rent vs $115k).
- Recommended offer: $101k (12.0% below list) — sets the bar for market timing.
- Cap rate 13.7% vs local median 4.0% in Byron — top-decile yield for the area; either an underpriced asset or a hidden risk that comps aren't pricing in. Stress-test before assuming the spread holds.
Location & tenants
- Location reads 68/100 on livability (#137 in GA) — a middle-class / working-renter tenant base. Strengths: cost of living A+, housing A+, crime A; Watch: schools C-, employment D, amenities F.
- Houston County (urban): math 43% / reading 46% proficiency, ranked #23 of 174 in GA (top 13%) — families likely to look elsewhere, expect single-tenant / working-renter base with shorter leases.
- Market conditions: 205 active listings in the ZIP; 10 comparable units currently listed for rent nearby; rentals at typical pace (median 21d on market — plan ~3-4 weeks tenant-placement turnaround); 40% of comp listings sitting > 30 days — soft ceiling on asking rent; 1,545 units permitted in Houston County in 2024 (336 in 5+ unit buildings).
Forward outlook
- Local home prices are declining (-3.0%/yr); year-one equity from $795 of loan paydown is wiped out by about $3k of value loss. Plan a longer hold.
- Houston County population projected at +22% by 2050 — long-run rental-demand tailwind backs the buy-and-hold thesis.
- At projected returns (-3.0% appreciation + 3.0% rent growth), your $32k cash investment doubles in ~5 years — after that, you're playing with house money.
Negotiation context
- It's been on market 124 days — a 12% lower offer ($101k) is reasonable based on typical stale-listing flexibility.
Risks & watch-outs
- Climate carrying-cost: major wind risk, 78% chance of damaging wind over 30y; extreme-heat days projected 7→19/yr by 2055 (HVAC capex compounding) — expect insurance premiums to compound above CPI over the hold.
Questions for the listing agent
- It's been on market 124 days. Have you received any prior offers? Is the seller open to a 12% concession, seller financing, or rate buy-down credit?
- Why hasn't it sold? Are there any deal-killer items the seller is aware of (foundation, flood, title, zoning, code violations)?
- Is there a deadline driving the sale (1031 exchange, divorce, estate, relocation)? That informs how much negotiation room exists.
- What's the average days-on-market for RENTAL listings here right now (not sales)? A rising rental-DOM trend means longer vacancies and softer asking-rent achievability than the comps imply.
- What's the recent tenant-quality profile in this submarket — average credit score on applications, eviction rate, late-payment / NSF rate, and stable-employment percentage? A property-management company in the area should have these aggregated.
- How much new for-sale + rental construction is in the pipeline within 1–3 miles? Heavy new supply typically softens prices + rents 12–24 months out; constrained supply supports both.
Investment metrics
- 1% rule
- 1.66% ✓
- Cap rate
- 13.74%
- Cash-on-cash
- 26.61%
- DSCR
- 2.18
- GRM
- 5.0
CMA / ARV
- ARV (median comp)
- $224,433
- List price
- $115,000
- Delta
- -48.76%
- Verdict
- UNDERPRICED
- Comps
- 20 within 1.0 mi
Show comp detail 12 sales within ~0.75 mi
| Address | Dist | Beds/Ba | Sqft | Sold | Price | $/sf | Match |
|---|---|---|---|---|---|---|---|
| 100 Crystal Ridge Cir | 0.29mi | 3/2.0 | 2,048 (-6%) | 1mo | $282,000 | $138 | 76 |
| 101 Crystal Ridge Cir | 0.30mi | 3/2.0 | 2,090 (-4%) | 9mo | $275,000 | $132 | 72 |
| 146 Crystal Ridge Cir | 0.15mi | 3/2.0 | 1,875 (-14%) | 8mo | $265,000 | $141 | 63 |
| 127 Marlin Ter | 0.62mi | 4/2.0 (+1) | 2,130 (-2%) | 9mo | $186,000 | $87 | 55 |
| 196 Amelia Dr | 0.55mi | 4/3.0 (+1) | 2,238 (+3%) | 7mo | $289,300 | $129 | 55 |
| 339 Brighton Dr | 0.28mi | 4/3.0 (+1) | 2,387 (+10%) | 10mo | $155,000 | $65 | 54 |
| 255 Bayberry Dr | 0.59mi | 4/2.0 (+1) | 2,280 (+5%) | 7mo | $170,000 | $75 | 53 |
| 125 Gleneagle Dr | 0.73mi | 3/2.0 | 2,069 (-5%) | 7mo | $304,000 | $147 | 52 |
| 116 Dundee Pass | 0.74mi | 3/2.0 | 2,318 (+6%) | 10mo | $295,000 | $127 | 46 |
| 143 Gleneagle Dr | 0.69mi | 4/2.0 (+1) | 2,372 (+9%) | 12mo | $299,000 | $126 | 38 |
| 930 Amelia Dr | 0.74mi | 4/3.0 (+1) | 2,188 (+1%) | 23mo | $280,000 | $128 | 37 |
| 138 Gleneagle Dr | 0.70mi | 3/2.0 | 1,851 (-15%) | 15mo | $270,000 | $146 | 30 |
Match score weights: distance 35% · size 25% · config 20% · recency 20%. Top-matched comps best support the ARV.
Projected returns pro-forma
-3.0% appreciation · 3.0% rent growth · sell at horizon
- IRR
- 20.5%
- Equity multiple
- 1.83×
- Total profit
- $26,864
- Equity at exit
- $17,147
- IRR
- 28.7%
- Equity multiple
- 3.55×
- Total profit
- $82,059
- Equity at exit
- $9,943
Cash invested: $32,200 (down + closing). Projections, not guarantees.
Landlord ↔ Tenant lean methodology
- Overall (STATE)
- 90 Strongly Landlord-Friendly
- State Georgia
- 90 Strongly Landlord-Friendly · R+3
- County
- — inherits STATE
- City
- — inherits STATE
ZIP-level market 31008
- Home prices YoY
- -18.1%
- Active inventory
- 205
- Price-to-rent
- 5.0×
Monthly cashflow live
- Estimated rent
- $1,910 high interval (Pro) →
- Mortgage (P&I)
- −$603
- Tax est. 1.5%
- −$144 /mo · $1,725/yr
- Insurance
- −$48
- HOA
- −$0
- Vacancy / Maint / Mgmt
- −$401
- Net cashflow
- $714
Break-even live
UW: 25.0% down · 7.5% · 30yr · 1.5% tax · 5.0% vac · 8.0% maint · 8.0% mgmt
Financing live
Cash to close
- Down payment
- $28,750
- Closing costs
- $3,450
- Reserves months
- —
- Total cash needed
- —
Loan-product check · same deal, 3 products live
Conventional
25% down · 7.5% · 30yr
- Down + closing
- —
- Monthly P&I
- —
- Monthly cashflow
- —
- DSCR
- —
- Eligible?
- —
Personal DTI + credit; lowest rate.
DSCR
20% down · 8.5% · 30yr
- Down + closing
- —
- Monthly P&I
- —
- Monthly cashflow
- —
- DSCR
- —
- Eligible?
- —
No personal income docs; deal must DSCR.
Hard money
10% down · 12.0% · 12mo
- Down + closing
- —
- Monthly P&I
- —
- Monthly cashflow
- —
- DSCR
- —
- Eligible?
- —
Short-term bridge; refi at stabilization.
Rent comps 10 comps
| Address | Beds | Baths | Sqft | Rent | $/sqft | DOM | Units | Dist |
|---|---|---|---|---|---|---|---|---|
| 807 Citrona Dr Byron, GA | 4.0 | 2.5 | 2164 | $2,020 | $0.93 | 21d | 1 | 0.65mi |
| 807 Citrona Dr Byron, GA | 4.0 | 2.5 | 2164 | $2,020 | $0.93 | 43d | 1 | 0.65mi |
| 156 Amelia Dr Byron, GA | 4.0 | 3.0 | 2200 | $2,300 | $1.05 | 13d | 1 | 0.71mi |
| 111 Brighton Dr Byron, GA | 3.0 | 2.0 | 1782 | $1,500 | $0.84 | 43d | 1 | 0.74mi |
| 111 Brighton Dr Byron, GA | 3.0 | 2.0 | 1782 | $1,400 | $0.79 | 21d | 1 | 0.74mi |
| 307 Timberwind Dr Byron, GA | 3.0 | 2.5 | 1908 | $1,850 | $0.97 | 13d | 1 | 1.23mi |
| 302 Timberwind Dr Byron, GA | 3.0 | 2.0 | 1449 | $1,500 | $1.04 | 13d | 1 | 1.24mi |
| 112 Rock Run Trl Warner Robins, GA | 4.0 | 2.5 | 2376 | $2,295 | $0.97 | 43d | 1 | 1.41mi |
| 110 Sea Oaks Ct Byron, GA | 3.0 | 2.0 | 2055 | $2,050 | $1.00 | 43d | 1 | 1.44mi |
| 1280 Dunbar Rd Warner Robins, GA | 2.0–4.0 | 2.0 | 1235 | $2,052 | $1.66 | 13d | 11 | 1.47mi |
Listing history 12 events
-
2026-06-10days on market $115,000 Active 124 DOM
-
2026-06-09days on market $115,000 Active 123 DOM
-
2026-06-08days on market $115,000 Active 122 DOM
-
2026-06-07days on market $115,000 Active 121 DOM
-
2026-06-05days on market $115,000 Active 118 DOM
-
2026-06-03days on market $115,000 Active 117 DOM
-
2026-06-02days on market $115,000 Active 116 DOM
-
2026-06-01days on market $115,000 Active 115 DOM
-
2026-05-31days on market $115,000 Active 114 DOM
-
2026-05-30days on market $115,000 Active 113 DOM
-
2026-02-12price $115,000 393-char remark
Show marketing remark (393 chars)
FOR SALE: Immaculate very well kept 2007 3-Bedroom 2-Bath 32x68 Horton Big Boss Mobile Home Located in Kingridge Senior Park (55+ gated community). Very quiet, clean and safe community. This is mobile home only. Land is not included. Lot rent is $325. Includes storage house and covered parking unit. Perfect for retired person or couple looking to downsize living spaces. Home can be moved.
-
2026-02-06$120,000 Active 393-char remark
Show marketing remark (393 chars)
FOR SALE: Immaculate very well kept 2007 3-Bedroom 2-Bath 32x68 Horton Big Boss Mobile Home Located in Kingridge Senior Park (55+ gated community). Very quiet, clean and safe community. This is mobile home only. Land is not included. Lot rent is $325. Includes storage house and covered parking unit. Perfect for retired person or couple looking to downsize living spaces. Home can be moved.
ⓘ Source: listings_history table (triggers on properties + properties_extension) + one-shot
backfill from property_details.listing_events for pre-trigger history.
Climate risk First Street
- Flood 1/10 Low FEMA zone X (unshaded) · 0% chance over 30 yrs
- Wildfire 3/10 Moderate
- Heat 7/10 Severe 7 d/yr ≥108°F today · 19 d/yr by 30 yrs out
- Wind 7/10 Severe 78% chance of damaging wind over 30 yrs
- Air quality 3/10 Moderate 3 unhealthy d/yr today · 3 by 30 yrs out
Nearby sold comps map
Loading sold comps map…
Walkable amenities ~0.75 mi
Loading nearby amenities…
Taxation est. · year 1
- Rental income
- $22,916
- − Mortgage interest
- −$6,442
- − Property taxes
- −$1,725
- − Insurance
- −$575
- − Repairs & maintenance
- −$1,833
- − Management
- −$1,833
- − Depreciation
- −$3,345
- Taxable income
- $7,162
- Est. tax owed @ 24.0%
- −$1,719
- After-tax cash flow
- $6,848/yr
For passive investors: Depreciation is non-cash, so a rental often shows a tax loss while cash-flowing — sheltering income. Rental losses are passive: they offset passive income freely, and up to $25,000/yr can offset ordinary (W-2) income if you actively participate and your MAGI is under $100k (phasing out to $0 by $150k); unused losses carry forward. On sale, claimed depreciation is recaptured at up to 25%, and gains may owe capital-gains tax (a 1031 exchange can defer both). Figures are a year-1 estimate at your 24.0% rate — not tax advice; consult a CPA.
Condition & rehab AI · 12 photos
This mobile home is in good condition with some cosmetic updates needed to enhance its resale and rental value.
Repairs flagged
- Moderate kitchen cabinets — dated and in need of updating
- Moderate bathroom fixtures — dated and in need of updating
- Moderate kitchen appliances — dated and in need of updating
Value-add opportunities
- Resale paint interior walls — Fresh paint can make a significant difference in the home's appearance
- Resale update kitchen cabinets and appliances — Modernizing the kitchen can attract more buyers
- Resale update bathroom fixtures — Fresh, updated fixtures can make a big impact on the home's appeal
- Both landscaping — A well-maintained yard can increase both resale and rental value
Renovation cost estimate screening
| Repair item | Severity | Est. cost |
|---|---|---|
| kitchen cabinets · dated and in need of updating | Moderate | $3,000–15,000 |
| bathroom fixtures · dated and in need of updating | Moderate | $3,000–15,000 |
| kitchen appliances · dated and in need of updating | Moderate | $3,000–15,000 |
| Total estimated repair cost · 3 items | $9,000–45,000 |
Value-add ROI direction
- Resale paint interior walls — Fresh paint can make a significant difference in the home's appearance ↑
- Resale update kitchen cabinets and appliances — Modernizing the kitchen can attract more buyers ↑
- Resale update bathroom fixtures — Fresh, updated fixtures can make a big impact on the home's appeal ↑
- Both landscaping — A well-maintained yard can increase both resale and rental value ↑
ⓘ Cost ranges are severity-bucket heuristics (US national rule-of-thumb). Get contractor quotes + a written scope before underwriting a rehab budget.
Schools (NCES district)
- District
- Houston County
- NCES district ID
- 1302880
- Math proficiency
- 43% ▼ -7.00%
- Reading proficiency
- 46% ▼ -2.00%
- Median HH income
- $54,823
- Composite
- 38.68/100
- National rank
- #4144
- State rank
- #23 of 174 in GA
Livability — Byron
- Score
- 68/100
- State rank
- #137
- US rank
- #9318
Category grades
Schools grade is shown separately in the Schools card above.
Census & demographics
- Population (ZIP)
- 20,882
Population outlook (Houston County) Hauer SSP2
- Today (2025)
- 169,502 people
- By 2030
- 178,486 · +5.3%
- By 2040
- 194,642 · +14.8%
- By 2050
- 207,119 · +22.2%
- By 2075
- 231,480 · +36.6%
- By 2100
- 235,034 · +38.7%
Race, ethnicity, and origin ACS 2023
- Neighborhood character
- Majority White (61%)
- Race & ethnicity
- White 61% Black 27% Two or more races 7% Hispanic / Latino 6%
- Hispanic origin (detail)
- Mexican 3% Puerto Rican 2%
- Common ancestry
- Slovak 2% Serbian 1% Lithuanian 1%
- Foreign-born
- 2% · Canada
- Languages at home
- 95% English-only · Spanish 4%
Political lean MEDSL · Houston
- 2024 margin
- R (+11.3) · D 44.0% · R 55.3%
- 2008→2024 swing
- +8.9pp toward D · 2008: -20.2pp · 2024: -11.3pp
- All cycles
- 2024: R+11.3 2020: R+12.4 2016: R+21.6 2012: R+20.7 2008: R+20.2
Not yet ingested
- Civics
- —
Market trends
- HPI YoY
- ▼ -45.93%
- Current HPI
- 208.0889
- Rent YoY
- —
- Metro
- —
- State GDP YoY
- ▲ 2.66%
- F500 in state
- 28
Industry mix (Fortune 500 HQ in GA)
| Industry | F500 HQs | Revenue |
|---|---|---|
| Paper / Packaging | 2 | $29B |
|
||
| Retail | 1 | $160B |
|
||
| Transportation / Logistics | 1 | $91B |
|
||
| Airlines | 1 | $62B |
|
||
| Consumer Goods | 1 | $47B |
|
||
| Utilities | 1 | $25B |
|
||
Price history
-4.2% since first listed2 events — show timeline
- 2026-02-12 Price Changed $115,000 ForSaleByOwner.com
- 2026-02-06 Listed $120,000 ForSaleByOwner.com
Cash-flow waterfall
monthlySold comps — $/sqft
last 12 mo · ≤1 miLoading sold comps…