 Multi-family
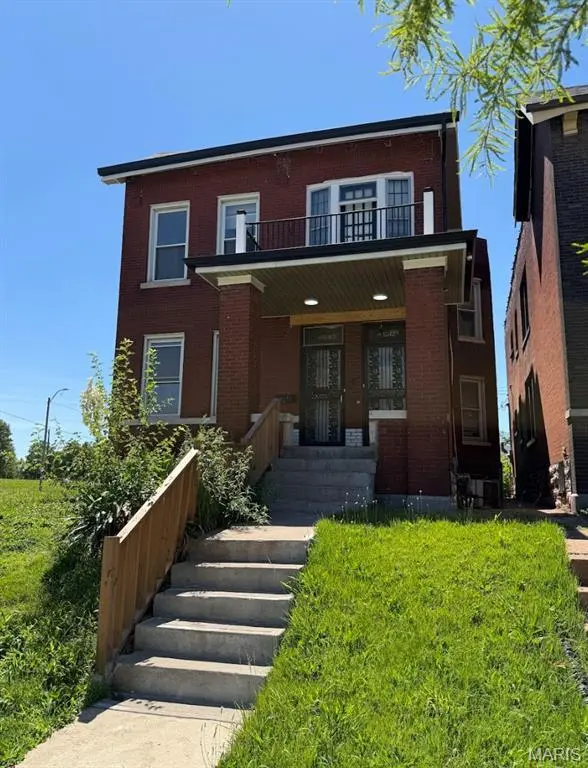
4582 Clarence Ave · St. Louis, MO
Flood risk 1/10 · Minimal
- FEMA flood zone
- X (unshaded)
- Chance of flooding over 30 yrs
- 0.0%
- Est. flood insurance / yr
- $473 – $860
Fire risk 1/10 · Minimal
- Est. fire insurance / yr
- $1,054 – $1,958
Heat risk 5/10 · Moderate
- Hot days now (above 108°F)
- 7 days/yr
- Hot days in 30 yrs
- 21 days/yr
Wind risk 2/10 · Minimal
- Chance of severe wind over 30 yrs
- 1.0%
Air-quality risk 4/10 · Minor
- Unhealthy air days now
- 5 days/yr
- Unhealthy air days in 30 yrs
- 6 days/yr
Risk factors via First Street. Map © Google.
Why this score? — see what drove the B- grade
The composite is a weighted blend of 9 inputs, each scored 0–100. Each bar is that input's sub-score; the figure is the points it added to the 100-point composite (weight × sub-score).
- Cash flow +30.0/30.0
- 1% rule +10.0/10.0
- DSCR +10.0/10.0
- ARV discount +7.5/15.0
- Appreciation +3.3/10.0
- Rent growth +2.5/5.0
- Livability +2.5/5.0
- Condition / age +2.5/5.0
- Schools +1.2/10.0
$89,900
🖨 Deal sheet (PDF) 📄 Offer letter ✓ Due diligence
Multi-family units
County records classify this as Multi-Family (2-4 Unit). Listing-text estimate: 1 unit. estimate disagrees with records
Listing remarks MLS
PRIME INVESTMENT OPPORTUNITY: 2-Family Flat Across from O'Fallon Park - Perfect for Rehabbers & First-Time Flippers! Welcome to an exceptional opportunity in the heart of St. Louis! This solid 2-family flat sits directly across from the beautiful O'Fallon Park, offering unbeatable location and tremendous upside potential for the savvy investor ready to roll up their sleeves. LOCATION, LOCATION, LOCATION: Imagine owning a property with park views and green space right outside your door. O'Fallon Park is one of St. Louis's cherished community assets, providing residents with walking trails, recreational facilities, and that rare urban commodity - open space. This location alone sets your investment apart, offering future tenants or homeowners a lifestyle advantage that commands premium rents or resale value. This property was impacted by the devastating tornadoes that struck St. Louis on May 16, 2025. While many properties in the area suffered catastrophic damage, this building's bones remain strong. The roof has already been professionally repaired and secured, eliminating one of the most critical and expensive components of the restoration process. This means you can focus your rehab budget on the interiors, where your sweat equity and design choices will create the most value. BUILDING SPECIFICATIONS: - True 2-family configuration with separate units - Each unit features 2 bedrooms, 1 bathroom - Central air conditioning systems in both units - Full basement with dedicated washer/dryer hookups for each unit (a major selling point for tenants!) - New roof already installed and weather-tight - Both units are vacant and ready for your creative vision WHY THIS IS PERFECT FOR FIRST-TIME FLIPPERS: Starting your real estate investment journey can feel overwhelming, but this property offers the ideal entry point. The 2-family structure provides multiple exit strategies. Rehab both units and hold as a rental property, generating dual income streams. Complete one unit at a time, living in one while renting the other to offset your mortgage. Or renovate and sell to an owner-occupant or another investor. The flexibility is built right into the property. THE NUMBERS MAKE SENSE: St. Louis offers some of the most affordable real estate in the nation, making it possible to enter the investment market with manageable capital requirements. Paired with strong rental demand in established neighborhoods near amenities like O'Fallon Park, this property represents the kind of value-add opportunity that builds wealth. RENOVATION ROADMAP: For the hands-on investor, this is a manageable project scope. Two 2-bedroom units mean eight rooms plus bathrooms and kitchens - substantial enough to build real equity, but not so overwhelming that you'll be underwater for years. Set your timeline, create your budget, and execute your plan knowing the building envelope is secure. THE VISION: 68This is more than a damaged property needing repairs. This is your opportunity to create something special while building your real estate portfolio. The hardest decision has been made for you - the roof is done. Now comes the exciting part: designing, renovating, and bringing this property back to life while building equity with every improvement. Don't let this opportunity pass by. Properties across from parks in established St. Louis neighborhoods don't stay available long, especially at value-add pricing. Whether you're launching your flipping career or adding to your rental portfolio, this 2-family flat offers the location, structure, and potential that successful investments are built on. Your real estate journey starts here. Are you ready to make your move? THIS IS AN "AS-IS" PROPERTY.
Key facts
- Newer roof
- One new furnace
- 6,860 sq ft lot
Tags
Property features AI
Finance
- Other: Property type: Residential Income (2-4 units); Lot size approximately 0.1575 acres; Above-grade finished area reported as 2,752 (source: public records)
- Financial info: Seller may consider concessions; No second mortgage reported; No existing leases; 0 of 2 units leased
- HOA & community: Community contains 2 units
Exterior
- Parking: Off-street parking
- Utilities: Public water; Electricity connected; Natural gas connected
- Home design: Residential income property (2–4 units); Two-story building; Fixer condition
- Construction: Brick and stone construction
- Exterior features: Private ownership; No pool
Interior
- Bedrooms: One 2-bedroom unit; One 3-bedroom unit
- Bathrooms: Each unit has 1 bathroom
- Heating & cooling: Central air
- Interior features: Unfinished basement
Neighborhood map
What this means for you Summary
Snapshot
- This is a 5-bed/2.0-bath multifamily listed at $90k.
Deal economics
- At list price, monthly cash flow is $1k ($13k/yr) — positive.
- The deal already cash-flows at list — no discount required.
- Meets the 1% rule at list price ($2k rent vs $90k).
- Recommended offer: $89k (1.5% below list) — sets the bar for market timing.
- Cap rate 20.7% vs local median 5.0% in St. Louis — top-decile yield for the area; either an underpriced asset or a hidden risk that comps aren't pricing in. Stress-test before assuming the spread holds.
Location & tenants
- Location reads: area grade B — affects rentability + tenant quality, not the cash-flow math above.
- St. Louis City (urban): math 10% / reading 18% proficiency, ranked #312 of 324 in MO (top 96%) — low school quality limits family demand, transient renter base, plan for 1-2y turnover; 80% free/reduced lunch — lower-income household profile, screen leases tightly.
- Zoned schools: Hickey Elem. (math 2% / reading 8%, grade F, #1,072 of 1,115 statewide, top 98%, 273 students, 99% FRL); Vashon High (math 2% / reading 2%, grade F, #520 of 521 statewide, top 100%, 568 students, 100% FRL) — zoned schools average 99% FRL vs 80% district-wide (19 pts higher); higher-poverty schools than district average — tighter screening recommended.
- Market conditions: 97 active listings in the ZIP; lower-income renter base — watch delinquency; 294 units permitted in St. Louis city in 2024 (227 in 5+ unit buildings).
Forward outlook
- Local home prices are declining (-3.0%/yr); year-one equity from $622 of loan paydown is wiped out by about $3k of value loss. Plan a longer hold.
- St. Louis County population projected to shrink 6% by 2050 — rents likely to lag national; underwrite the cash flow, not the appreciation.
- At projected returns (-3.0% appreciation + 3.0% rent growth), your $25k cash investment doubles in ~3 years — after that, you're playing with house money.
Negotiation context
- It's been on market 15 days — a 2% lower offer ($89k) is reasonable based on typical stale-listing flexibility.
- 2 sale attempts with the ask held roughly flat each time — persistent listings suggest the price (not the market) is what's stuck; bring a comps-based counter.
- Current owner paid $70k; 28% above their basis — modest negotiation headroom, anchor on the comps not their cost.
Risks & watch-outs
- Watch-outs: built in 1912 — expect roof / HVAC / electrical / plumbing capex.
- Climate carrying-cost: extreme-heat days projected 7→21/yr by 2055 (HVAC capex compounding) — expect insurance premiums to compound above CPI over the hold.
Questions for the listing agent
- Built in 1912 — when were the roof, HVAC, electrical panel, plumbing, and water heater last replaced?
- Is there a deadline driving the sale (1031 exchange, divorce, estate, relocation)? That informs how much negotiation room exists.
- What's the average days-on-market for RENTAL listings here right now (not sales)? A rising rental-DOM trend means longer vacancies and softer asking-rent achievability than the comps imply.
- What's the recent tenant-quality profile in this submarket — average credit score on applications, eviction rate, late-payment / NSF rate, and stable-employment percentage? A property-management company in the area should have these aggregated.
- How much new apartment / multifamily construction is in the pipeline within 1–3 miles? Heavy new supply (>2% of stock underway) typically softens rents 12–24 months out; light construction supports rent growth.
Investment metrics
- 1% rule
- 2.27% ✓
- Cap rate
- 20.73%
- Cash-on-cash
- 51.56%
- DSCR
- 3.29
- GRM
- 3.7
CMA / ARV
- ARV (on-the-fly)
- $52,288
- Comps found
- 7
Show comp detail 7 sales within ~0.75 mi
| Address | Dist | Beds/Ba | Sqft | Sold | Price | $/sf | Match |
|---|---|---|---|---|---|---|---|
| 4582 Clarence Ave | 0.00mi | 4/2.0 (-1) | 2,752 (0%) | 4mo | $50,000 | $18 | 92 |
| 4418 Athlone Ave | 0.28mi | 5/2.0 | 2,686 (-2%) | 16mo | $52,000 | $19 | 70 |
| 4450 Holly Ave | 0.22mi | 6/3.0 (+1) | 2,566 (-7%) | 3mo | $86,000 | $34 | 68 |
| 2138 E Fair Ave | 0.35mi | 4/2.0 (-1) | 2,706 (-2%) | 20mo | $44,800 | $17 | 60 |
| 4210 Holly Ave | 0.46mi | 4/2.0 (-1) | 2,528 (-8%) | 1mo | $37,000 | $15 | 59 |
| 4511 Red Bud Ave | 0.22mi | 5/3.0 | 2,388 (-13%) | 12mo | $220,000 | $92 | 53 |
| 4434 Clarence Ave | 0.26mi | 6/6.0 (+1) | 2,600 (-6%) | 8mo | $60,000 | $23 | 52 |
Match score weights: distance 35% · size 25% · config 20% · recency 20%. Top-matched comps best support the ARV.
Projected returns pro-forma
-3.0% appreciation · 3.0% rent growth · sell at horizon
- IRR
- 49.4%
- Equity multiple
- 3.16×
- Total profit
- $54,291
- Equity at exit
- $13,404
- IRR
- 54.9%
- Equity multiple
- 6.40×
- Total profit
- $135,879
- Equity at exit
- $7,773
Cash invested: $25,172 (down + closing). Projections, not guarantees.
Landlord ↔ Tenant lean methodology
- Overall (STATE)
- 81 Strongly Landlord-Friendly
- State Missouri
- 81 Strongly Landlord-Friendly · R+10
- County
- — inherits STATE
- City
- — inherits STATE
ZIP-level market 63115
- Home prices YoY
- -2.6%
- Active inventory
- 97
- Price-to-rent
- 7.3×
Monthly cashflow live
- Estimated rent
- $2,045 high interval (Pro) →
- Mortgage (P&I)
- −$471
- Tax from tax record
- −$25 /mo · $302/yr
- Insurance
- −$37
- HOA
- −$0
- Vacancy / Maint / Mgmt
- −$429
- Net cashflow
- $1,082
Break-even live
Sensitivity live
| Price | -10% $1,132 | -5% $1,107 | +0% $1,082 | +5% $1,056 | +10% $1,031 |
|---|---|---|---|---|---|
| Rent | -10% $920 | -5% $1,001 | +0% $1,082 | +5% $1,162 | +10% $1,243 |
| Rate | -1.0pp $1,127 | -0.5pp $1,104 | base $1,082 | +0.5pp $1,058 | +1.0pp $1,035 |
2-unit breakdown (identical units grouped — click to expand)
| Units | Beds | Baths | Est. rent |
|---|---|---|---|
| 2× units | 2 | 1 | $2,044 |
| #1 | 2 | 1 | $1,022 |
| #2 | 2 | 1 | $1,022 |
| Total (2 units) | $2,045 | ||
UW: 25.0% down · 7.5% · 30yr · 1.5% tax · 5.0% vac · 8.0% maint · 8.0% mgmt
Financing live
Cash to close
- Down payment
- $22,475
- Closing costs
- $2,697
- Reserves months
- —
- Total cash needed
- —
Loan-product check · same deal, 3 products live
Conventional
25% down · 7.5% · 30yr
- Down + closing
- —
- Monthly P&I
- —
- Monthly cashflow
- —
- DSCR
- —
- Eligible?
- —
Personal DTI + credit; lowest rate.
DSCR
20% down · 8.5% · 30yr
- Down + closing
- —
- Monthly P&I
- —
- Monthly cashflow
- —
- DSCR
- —
- Eligible?
- —
No personal income docs; deal must DSCR.
Hard money
10% down · 12.0% · 12mo
- Down + closing
- —
- Monthly P&I
- —
- Monthly cashflow
- —
- DSCR
- —
- Eligible?
- —
Short-term bridge; refi at stabilization.
Listing history 10 events
-
2026-06-18days on market $89,900 Active 15 DOM
-
2026-06-17days on market $89,900 Active 14 DOM
-
2026-06-16days on market $89,900 Active 13 DOM
-
2026-06-15days on market $89,900 Active 12 DOM
-
2026-06-13days on market $89,900 Active 10 DOM
-
2026-06-09days on market $89,900 Active 6 DOM
-
2026-06-08days on market $89,900 Active 5 DOM
-
2026-06-07days on market $89,900 Active 4 DOM
-
2026-06-05remarks 327-char remark
-
2026-06-05$89,900 Active 1 DOM
ⓘ Source: listings_history table (triggers on properties + properties_extension) + one-shot
backfill from property_details.listing_events for pre-trigger history.
Tax reassessment forecast MO · Resets to sale price
- Current annual tax
- $302 · $25/mo
- Projected year-2 tax
- $872 · $73/mo
- Expected delta
- +$570/yr (+$48/mo · 189.0%)
ⓘ Screening estimate from a state-policy table — verify with the county assessor before closing.
Climate risk First Street
- Flood 1/10 Low FEMA zone X (unshaded) · 0% chance over 30 yrs
- Wildfire 1/10 Low
- Heat 5/10 Major 7 d/yr ≥108°F today · 21 d/yr by 30 yrs out
- Wind 2/10 Low 100% chance of damaging wind over 30 yrs
- Air quality 4/10 Moderate 5 unhealthy d/yr today · 6 by 30 yrs out
Nearby sold comps map
Loading sold comps map…
Walkable amenities ~0.75 mi
Loading nearby amenities…
Taxation est. · year 1
- Rental income
- $24,540
- − Mortgage interest
- −$5,036
- − Property taxes
- −$302
- − Insurance
- −$450
- − Repairs & maintenance
- −$1,963
- − Management
- −$1,963
- − Depreciation
- −$2,615
- Taxable income
- $12,211
- Est. tax owed @ 24.0%
- −$2,931
- After-tax cash flow
- $10,047/yr
For passive investors: Depreciation is non-cash, so a rental often shows a tax loss while cash-flowing — sheltering income. Rental losses are passive: they offset passive income freely, and up to $25,000/yr can offset ordinary (W-2) income if you actively participate and your MAGI is under $100k (phasing out to $0 by $150k); unused losses carry forward. On sale, claimed depreciation is recaptured at up to 25%, and gains may owe capital-gains tax (a 1031 exchange can defer both). Figures are a year-1 estimate at your 24.0% rate — not tax advice; consult a CPA.
Schools (NCES district)
- District
- St. Louis City
- NCES district ID
- 2929280
- Math proficiency
- 10% ▼ -6.00%
- Reading proficiency
- 18% ▼ -3.00%
- Median HH income
- $35,685
- Composite
- 11.54/100
- National rank
- #9699
- State rank
- #312 of 324 in MO
Livability — St. Louis
No livability data for this city. (Only ~50 U.S. cities are tracked.)
Census & demographics
- Census place
- St. Louis, MO
- County
- Saint Louis City · 254,015 people
- City population
- 283,259
- Metro
- St. Louis, MO-IL
- Population (ZIP)
- 14,488
- Household income
- $30,622
- Rent vs Own
- Severe rent burden
- 1655.0
Population outlook (St. Louis County) Hauer SSP2
- Today (2025)
- 315,737 people
- By 2030
- 313,865 · -0.6%
- By 2040
- 305,439 · -3.3%
- By 2050
- 296,529 · -6.1%
- By 2075
- 271,028 · -14.2%
- By 2100
- 255,359 · -19.1%
Race, ethnicity, and origin ACS 2023
- Neighborhood character
- Predominantly Black (95%)
- Race & ethnicity
- Black 95% White 2% Two or more races 2%
- Foreign-born
- 0%
Political lean MEDSL · St. Louis
- 2024 margin
- Solid D (+64.7) · D 81.4% · R 16.7% · Other 2.0%
- 2008→2024 swing
- -3.5pp toward R · 2008: 68.2pp · 2024: 64.7pp
- All cycles
- 2024: D+64.7 2020: D+66.2 2016: D+63.7 2012: D+66.6 2008: D+68.2
Not yet ingested
- Civics
- —
Market trends
- HPI YoY
- ▼ -3.42%
- Current HPI
- 127.3403
- Rent YoY
- —
- Metro
- St. Louis, MO-IL
- State GDP YoY
- ▲ 1.84%
- F500 in state
- 20
Industry mix (Fortune 500 HQ in MO)
| Industry | F500 HQs | Revenue |
|---|---|---|
| Healthcare | 1 | $163B |
|
||
| Insurance | 1 | $21B |
|
||
| Industrial Technology | 1 | $17B |
|
||
| Retail | 1 | $16B |
|
||
| Industrial Distribution | 1 | $10B |
|
||
| Utilities | 1 | $9B |
|
||
Price history
+28.4% since first listed5 events — show timeline
- 2026-06-03 Listed $89,900 MARIS as Distributed by MLS Grid
- 2026-02-25 Sold (MLS) — MARIS as Distributed by MLS Grid
- 2026-02-10 Contingent — MARIS as Distributed by MLS Grid
- 2026-02-02 Listed $50,000 MARIS as Distributed by MLS Grid
- 2008-06-09 Sold (Public Records) $70,000 Public Records
Property tax history
-2.2%/yrLatest (2024): $302 · +4.7% YoY. Source: county tax records.
Cash-flow waterfall
monthlySold comps — $/sqft
last 12 mo · ≤1 miLoading sold comps…