 Multi-family
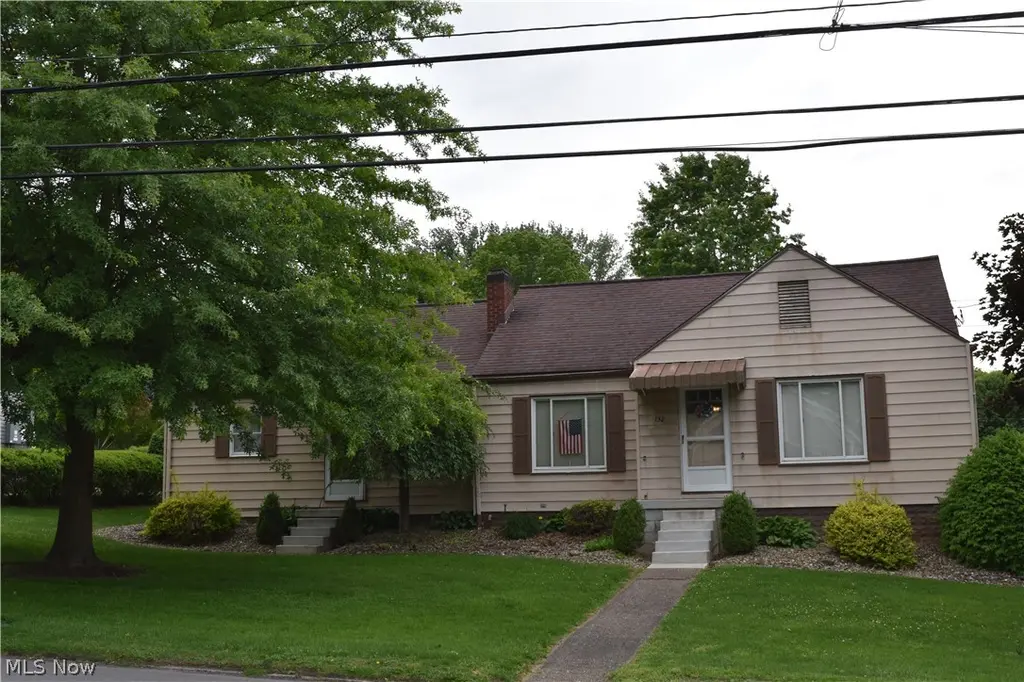
132 N Sugar St · St. Clairsville, OH
Flood risk 6/10 · Moderate
- FEMA flood zone
- X (unshaded)
- Chance of flooding over 30 yrs
- 0.75%
- Est. flood insurance / yr
- $473 – $860
Fire risk 1/10 · Minimal
- Est. fire insurance / yr
- $713 – $1,323
Heat risk 3/10 · Minor
- Hot days now (above 96°F)
- 7 days/yr
- Hot days in 30 yrs
- 19 days/yr
Wind risk 1/10 · Minimal
- Chance of severe wind over 30 yrs
- 0.0%
Air-quality risk 1/10 · Minimal
- Unhealthy air days now
- 0 days/yr
- Unhealthy air days in 30 yrs
- 0 days/yr
Risk factors via First Street. Map © Google.
Why this score? — see what drove the D grade
The composite is a weighted blend of 9 inputs, each scored 0–100. Each bar is that input's sub-score; the figure is the points it added to the 100-point composite (weight × sub-score).
- Cash flow +13.2/30.0
- ARV discount +7.5/15.0
- Schools +5.5/10.0
- DSCR +4.0/10.0
- 1% rule +3.7/10.0
- Rent growth +2.5/5.0
- Livability +2.5/5.0
- Condition / age +2.2/5.0
- Appreciation +0.0/10.0
$195,000
🖨 Deal sheet (PDF) 📄 Offer letter ✓ Due diligence
Multi-family units
County records classify this as Multi-Family (2-4 Unit). Listing-text estimate: 1 unit. estimate disagrees with records
Listing remarks
Don't miss your chance to own this wonderful income producing home in St Clairsville. Larger unit has 1 bed, living room, dining room, kitchen and bath on the main floor. There are 2 beds upstairs and a bath in the basement. The other side unit has 1 bed, open concept kitchen, dining and living room. Main unit has an integral 1 car garage. This home sits on a beautiful level corner lot with a paved driveway and an additional parking area in the rear.
Key facts
- Open concept kitchen
- Paved driveway
- Level corner lot
Tags
Property features AI
Finance
- Other: No additional financial amenities provided
- Financial info: No investor or income/expense details provided
- HOA & community: No HOA details provided
Exterior
- Parking: Driveway; Off-street parking; Attached garage with 1 garage space
- Security: No security details provided
- Utilities: Public water; Public sewer
- Home design: Single building; Above-grade finished area approximately 1,536 (source: assessor)
- Construction: Aluminum siding; Asphalt shingle roof; Year built per public records
- Exterior features: Corner lot
Interior
- Kitchen: No appliance details provided
- Bedrooms: One 1-bedroom unit (leased); One 3-bedroom unit (leased)
- Flooring: No flooring details provided
- Bathrooms: Three full bathrooms total; 1 bathroom in the 1-bedroom unit; 2 bathrooms in the 3-bedroom unit
- Heating & cooling: Forced air heating; Central air conditioning
- Interior features: Basement with bath rough-in/stubbed; Total of 10 rooms
- Laundry & utility: No laundry details provided
Neighborhood map
What this means for you Summary
Snapshot
- This is a 4-bed/3.0-bath multifamily listed at $195k. Condition is rated fair.
Deal economics
- At list price, monthly cash flow is $-5 ($-55/yr) — negative.
- To cash-flow at today's rent, offer at most $194k (0.3% below list).
- To meet the 1% rule (rent ≥ 1% of price), the offer needs to be $170k (12.8% below list).
- Recommended offer: $170k (12.8% below list) — sets the bar for 1% rule.
- Cap rate 6.3% vs local median 3.1% in St. Clairsville — top-decile yield for the area; either an underpriced asset or a hidden risk that comps aren't pricing in. Stress-test before assuming the spread holds.
Location & tenants
- Location reads: area grade D — affects rentability + tenant quality, not the cash-flow math above.
- St Clairsville-Richland City (suburban): math 57% / reading 71% proficiency, ranked #220 of 656 in OH (top 34%) — acceptable for families but not a draw, mixed tenant base, ~2y average lease.
- Zoned schools: St Clairsville Elementary School (math 70% / reading 71%, grade A-, #376 of 1,584 statewide, top 24%, 600 students, 28% FRL); St Clairsville Middle School (math 52% / reading 70%, grade B+, #252 of 654 statewide, top 39%, 510 students, 44% FRL); St Clairsville High School (math 52% / reading 72%, grade B-, #202 of 781 statewide, top 29%, 482 students, 0% FRL) — zoned schools average 24% FRL vs 40% district-wide (16 pts lower); this property's tenant base skews higher-income than the district average.
- Market conditions: 61 active listings in the ZIP; 4 units permitted in Belmont County in 2024 (0 in 5+ unit buildings).
Forward outlook
- Local home prices are declining (-3.0%/yr); year-one equity from $1k of loan paydown is wiped out by about $6k of value loss. Plan a longer hold.
- Belmont County population projected at -15% by 2050 — secular population decline; favor cash flow + early exit over multi-decade hold.
Negotiation context
- It's been on market 31 days — a 3% lower offer ($189k) is reasonable based on typical stale-listing flexibility.
- 2 sale attempts; this cycle's ask has dropped $25k (11%) from the opening price — seller is motivated, your offer sets the floor, not the list.
Risks & watch-outs
- Watch-outs: built in 1948 — expect roof / HVAC / electrical / plumbing capex.
- Climate carrying-cost: major flood risk — expect insurance premiums to compound above CPI over the hold.
Questions for the listing agent
- What do current leases actually rent for vs. the listed asking? Can we see a recent rent roll and the last 12 months of T-12 income?
- It's been on market 31 days. Have you received any prior offers? Is the seller open to a 13% concession, seller financing, or rate buy-down credit?
- Have any recent inspections been done? Can we get a copy of the seller's disclosures and any deferred-maintenance estimates?
- Built in 1948 — when were the roof, HVAC, electrical panel, plumbing, and water heater last replaced?
- Is there a deadline driving the sale (1031 exchange, divorce, estate, relocation)? That informs how much negotiation room exists.
- The area grade is low — what's the realistic commute time and amenity access for the typical tenant pool here? Any planned neighborhood developments (good or bad) we should know about?
- What's the average days-on-market for RENTAL listings here right now (not sales)? A rising rental-DOM trend means longer vacancies and softer asking-rent achievability than the comps imply.
- What's the recent tenant-quality profile in this submarket — average credit score on applications, eviction rate, late-payment / NSF rate, and stable-employment percentage? A property-management company in the area should have these aggregated.
- How much new apartment / multifamily construction is in the pipeline within 1–3 miles? Heavy new supply (>2% of stock underway) typically softens rents 12–24 months out; light construction supports rent growth.
Investment metrics
- 1% rule
- 0.87% ✗
- Cap rate
- 6.26%
- Cash-on-cash
- -0.10%
- DSCR
- 1.00
- GRM
- 9.6
CMA / ARV
No comps found within radius.
Projected returns pro-forma
-3.0% appreciation · 3.0% rent growth · sell at horizon
- IRR
- -16.5%
- Equity multiple
- 0.42×
- Total profit
- $-31,866
- Equity at exit
- $29,075
- IRR
- -8.2%
- Equity multiple
- 0.49×
- Total profit
- $-28,021
- Equity at exit
- $16,860
Cash invested: $54,600 (down + closing). Projections, not guarantees.
Landlord ↔ Tenant lean methodology
- Overall (STATE)
- 73 Landlord-Friendly
- State Ohio
- 73 Landlord-Friendly · R+6
- County
- — inherits STATE
- City
- — inherits STATE
ZIP-level market 43950
- Home prices YoY
- -29.5%
- Active inventory
- 61
- Price-to-rent
- 19.1×
Monthly cashflow live
- Estimated rent
- $1,700 medium interval (Pro) →
- Mortgage (P&I)
- −$1,023
- Tax est. 1.5%
- −$244 /mo · $2,925/yr
- Insurance
- −$81
- HOA
- −$0
- Vacancy / Maint / Mgmt
- −$357
- Net cashflow
- $-5
Break-even live
Sensitivity live
| Price | -10% $130 | -5% $63 | +0% $-5 | +5% $-72 | +10% $-139 |
|---|---|---|---|---|---|
| Rent | -10% $-139 | -5% $-72 | +0% $-5 | +5% $63 | +10% $130 |
| Rate | -1.0pp $94 | -0.5pp $45 | base $-5 | +0.5pp $-55 | +1.0pp $-107 |
2-unit breakdown (identical units grouped — click to expand)
| Units | Beds | Baths | Est. rent |
|---|---|---|---|
| 1× unit | 1 | 1 | $850 |
| 1× unit | 2 | 1 | $850 |
| Total (2 units) | $1,700 | ||
UW: 25.0% down · 7.5% · 30yr · 1.5% tax · 5.0% vac · 8.0% maint · 8.0% mgmt
Financing live
Cash to close
- Down payment
- $48,750
- Closing costs
- $5,850
- Reserves months
- —
- Total cash needed
- —
Loan-product check · same deal, 3 products live
Conventional
25% down · 7.5% · 30yr
- Down + closing
- —
- Monthly P&I
- —
- Monthly cashflow
- —
- DSCR
- —
- Eligible?
- —
Personal DTI + credit; lowest rate.
DSCR
20% down · 8.5% · 30yr
- Down + closing
- —
- Monthly P&I
- —
- Monthly cashflow
- —
- DSCR
- —
- Eligible?
- —
No personal income docs; deal must DSCR.
Hard money
10% down · 12.0% · 12mo
- Down + closing
- —
- Monthly P&I
- —
- Monthly cashflow
- —
- DSCR
- —
- Eligible?
- —
Short-term bridge; refi at stabilization.
Listing history 20 events
-
2026-06-22days on market $195,000 Active 31 DOM
-
2026-06-21days on market $195,000 Active 30 DOM
-
2026-06-21days on market $195,000 Active 29 DOM
-
2026-06-18days on market $195,000 Active 27 DOM
-
2026-06-18price $195,000 Active 26 DOM
-
2026-06-17days on market $220,000 Active 26 DOM
-
2026-06-16days on market $220,000 Active 25 DOM
-
2026-06-16status $220,000 Active 24 DOM
-
2026-06-15days on market $220,000 Contingent 24 DOM
-
2026-06-13days on market $220,000 Contingent 22 DOM
-
2026-06-12days on market $220,000 Contingent 21 DOM
-
2026-06-09days on market $220,000 Contingent 18 DOM
-
2026-06-08days on market $220,000 Contingent 17 DOM
-
2026-06-08days on market $220,000 Contingent 16 DOM
-
2026-06-04days on market $220,000 Contingent 12 DOM
-
2026-06-03status $220,000 Contingent 11 DOM
-
2026-06-02days on market $220,000 Active 11 DOM
-
2026-06-01days on market $220,000 Active 10 DOM
-
2026-05-31days on market $220,000 Active 9 DOM
-
2026-05-21$220,000 Active
ⓘ Source: listings_history table (triggers on properties + properties_extension) + one-shot
backfill from property_details.listing_events for pre-trigger history.
Climate risk First Street
- Flood 6/10 Major FEMA zone X (unshaded) · 75% chance over 30 yrs
- Wildfire 1/10 Low
- Heat 3/10 Moderate 7 d/yr ≥96°F today · 19 d/yr by 30 yrs out
- Wind 1/10 Low 0% chance of damaging wind over 30 yrs
- Air quality 1/10 Low 0 unhealthy d/yr today · 0 by 30 yrs out
Nearby sold comps map
Loading sold comps map…
Walkable amenities ~0.75 mi
Loading nearby amenities…
Taxation est. · year 1
- Rental income
- $20,400
- − Mortgage interest
- −$10,923
- − Property taxes
- −$2,925
- − Insurance
- −$975
- − Repairs & maintenance
- −$1,632
- − Management
- −$1,632
- − Depreciation
- −$5,673
- Taxable loss
- −$3,360
- Est. tax savings @ 24.0%
- +$806
- After-tax cash flow
- $751/yr
For passive investors: Depreciation is non-cash, so a rental often shows a tax loss while cash-flowing — sheltering income. Rental losses are passive: they offset passive income freely, and up to $25,000/yr can offset ordinary (W-2) income if you actively participate and your MAGI is under $100k (phasing out to $0 by $150k); unused losses carry forward. On sale, claimed depreciation is recaptured at up to 25%, and gains may owe capital-gains tax (a 1031 exchange can defer both). Figures are a year-1 estimate at your 24.0% rate — not tax advice; consult a CPA.
Condition & rehab AI · 2 photos
This multi-family home requires moderate rehabilitation, focusing on the roof and exterior. Improvements in these areas would significantly enhance its value and appeal to buyers or renters.
Repairs flagged
- Major roof — Signs of wear and discoloration suggest significant damage.
- Moderate exterior siding — Some wear and discoloration is visible, indicating a need for repair or repainting.
- Minor HVAC system — No specific issues are visible, but maintenance may be needed to ensure efficiency.
Value-add opportunities
- Resale New roof — A new roof would significantly improve the home's appearance and value.
- Resale Exterior painting and siding repair — Fresh paint and repairs would enhance curb appeal and property value.
- Rental HVAC system maintenance or replacement — A functional HVAC system is crucial for tenant satisfaction and rental value.
- Both Landscaping and curb appeal improvements — A well-maintained and attractive exterior can boost both resale and rental values.
Renovation cost estimate screening
| Repair item | Severity | Est. cost |
|---|---|---|
| roof · Signs of wear and discoloration suggest significant damage. | Major | $15,000–50,000 |
| exterior siding · Some wear and discoloration is visible, indicating a need for repair or repainting. | Moderate | $3,000–15,000 |
| HVAC system · No specific issues are visible, but maintenance may be needed to ensure efficiency. | Minor | $500–3,000 |
| Total estimated repair cost · 3 items | $18,500–68,000 |
Value-add ROI direction
- Resale New roof — A new roof would significantly improve the home's appearance and value. ↑
- Resale Exterior painting and siding repair — Fresh paint and repairs would enhance curb appeal and property value. ↑
- Rental HVAC system maintenance or replacement — A functional HVAC system is crucial for tenant satisfaction and rental value. ↑
- Both Landscaping and curb appeal improvements — A well-maintained and attractive exterior can boost both resale and rental values. ↑
ⓘ Cost ranges are severity-bucket heuristics (US national rule-of-thumb). Get contractor quotes + a written scope before underwriting a rehab budget.
Schools (NCES district)
- District
- St Clairsville-Richland City
- NCES district ID
- 3904599
- Math proficiency
- 57% ▼ -12.00%
- Reading proficiency
- 71% ▼ -4.00%
- Median HH income
- $54,816
- Composite
- 54.8/100
- National rank
- #1314
- State rank
- #220 of 656 in OH
Livability — St. Clairsville
No livability data for this city. (Only ~50 U.S. cities are tracked.)
Census & demographics
- Census place
- St. Clairsville, OH
- County
- Belmont · 63,139 people
- Metro
- Wheeling, WV-OH
- Population (ZIP)
- 16,422
- Household income
- $73,135
- Rent vs Own
- Severe rent burden
- 8.5
Population outlook (Belmont County) Hauer SSP2
- Today (2025)
- 66,568 people
- By 2030
- 64,818 · -2.6%
- By 2040
- 60,702 · -8.8%
- By 2050
- 56,427 · -15.2%
- By 2075
- 46,222 · -30.6%
- By 2100
- 34,611 · -48.0%
Race, ethnicity, and origin ACS 2023
- Neighborhood character
- Predominantly White (87%)
- Race & ethnicity
- White 87% Black 6% Two or more races 4% Hispanic / Latino 3%
- Common ancestry
- Romanian 6% Slovak 4% Italian 3%
- Foreign-born
- 2% · Canada
- Languages at home
- 97% English-only · Spanish 2%
Political lean MEDSL · Belmont
- 2024 margin
- Solid R (+47.3) · D 26.0% · R 73.3%
- 2008→2024 swing
- -50.0pp toward R · 2008: 2.7pp · 2024: -47.3pp
- All cycles
- 2024: R+47.3 2020: R+43.6 2016: R+39.5 2012: R+8.4 2008: D+2.7
Not yet ingested
- Civics
- —
Market trends
- HPI YoY
- ▼ -74.90%
- Current HPI
- 179.0223
- Rent YoY
- —
- Metro
- —
- State GDP YoY
- ▲ 1.98%
- F500 in state
- 48
Industry mix (Fortune 500 HQ in OH)
| Industry | F500 HQs | Revenue |
|---|---|---|
| Insurance | 3 | $145B |
|
||
| Industrial Machinery | 3 | $49B |
|
||
| Financial Services | 3 | $24B |
|
||
| Consumer Goods | 2 | $93B |
|
||
| Aerospace / Defense | 2 | $47B |
|
||
| Utilities | 2 | $33B |
|
||
Price history
-11.4% since first listed4 events — show timeline
- 2026-06-17 Price Changed $195,000 MLSNOW
- 2026-06-15 Relisted — MLSNOW
- 2026-06-02 Contingent — MLSNOW
- 2026-05-21 Listed $220,000 MLSNOW
Cash-flow waterfall
monthlySold comps — $/sqft
last 12 mo · ≤1 miLoading sold comps…