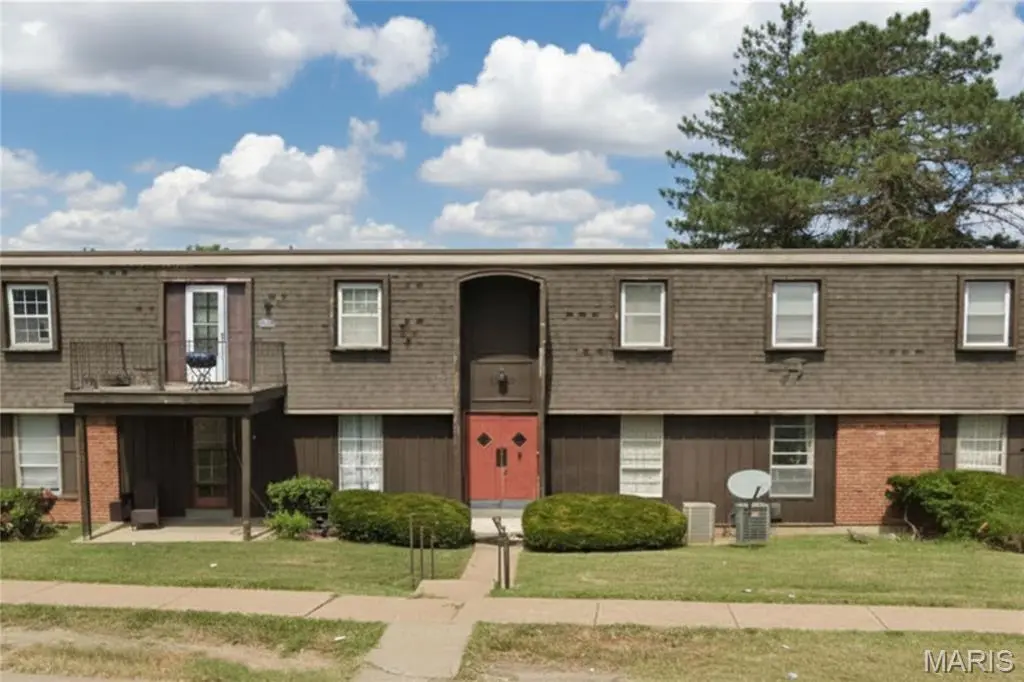
6683 Parker Rd Unit B · Florissant, MO
Flood risk 1/10 · Minimal
- FEMA flood zone
- X (unshaded)
- Chance of flooding over 30 yrs
- 0.0%
- Est. flood insurance / yr
- $473 – $860
Fire risk 1/10 · Minimal
- Est. fire insurance / yr
- $1,054 – $1,958
Heat risk 5/10 · Moderate
- Hot days now (above 106°F)
- 7 days/yr
- Hot days in 30 yrs
- 21 days/yr
Wind risk 2/10 · Minimal
- Chance of severe wind over 30 yrs
- 1.0%
Air-quality risk 4/10 · Minor
- Unhealthy air days now
- 4 days/yr
- Unhealthy air days in 30 yrs
- 5 days/yr
Risk factors via First Street. Map © Google.
Why this score? — see what drove the A grade
The composite is a weighted blend of 9 inputs, each scored 0–100. Each bar is that input's sub-score; the figure is the points it added to the 100-point composite (weight × sub-score).
- Cash flow +30.0/30.0
- ARV discount +15.0/15.0
- 1% rule +10.0/10.0
- DSCR +10.0/10.0
- Appreciation +10.0/10.0
- Rent growth +4.4/5.0
- Livability +3.7/5.0
- Condition / age +2.5/5.0
- Schools +1.7/10.0
$75,000
🖨 Deal sheet 📄 Offer letter ✓ Due diligence
Listing remarks MLS
GROUND-LEVEL carefree condo, walking distance to shops and restaurants, with GARAGE, private laundry and storage. Gracious entry foyer opens to flexible GREAT ROOM with wall sconces and WONDERFUL NATURAL LIGHT. FRESH INTERIOR PAINT and some new window blinds. Eat-in kitchen features NEW smooth cooktop, vent hood, wall oven, double sink and tile backsplash. Breakfast area with wall sconce and sliding door access to COVERED DECK - ideal for entertaining. Bedrooms each feature WALK-IN CLOSET and share hall bath with tub/shower combo. Basement garage with PRIVATE LAUNDRY and secure STORAGE locker. Association provides exterior maintenance, water, sewer, trash and recycle. Stay active at the nearby North County Rec Complex (gym, track, pool, playground, golf); 48-acre Evangelista Park (playground, sports, trail); and 135-acre Florissant Golf Club. CONVENIENT LOCATION with most errands within a mile and easy access to Highways 367/270/67.
Key facts
- $224 HOA
- Garage
- Built 1968
Neighborhood map
What this means for you Summary
Snapshot
- This is a 2-bed/1.0-bath condo listed at $75k.
Deal economics
- At list price, monthly cash flow is $433 ($5k/yr) — positive.
- The deal already cash-flows at list — no discount required.
- Meets the 1% rule at list price ($1k rent vs $75k).
- Recommended offer: $70k (6.0% below list) — sets the bar for market timing.
- Cap rate 13.2% vs local median 6.3% in Florissant — top-decile yield for the area; either an underpriced asset or a hidden risk that comps aren't pricing in. Stress-test before assuming the spread holds.
Location & tenants
- Location reads 73/100 on livability (#82 in MO) — a middle-class / working-renter tenant base. Strengths: cost of living A+, housing A+, health & safety B+; Watch: crime C-, amenities D+, schools D.
- Hazelwood (suburban): math 11% / reading 26% proficiency, ranked #306 of 324 in MO (top 94%) — low school quality limits family demand, transient renter base, plan for 1-2y turnover.
- Market conditions: Rents rising fast (+7.5%/yr); 218 active listings in the ZIP; 15 comparable units currently listed for rent nearby; rentals at typical pace (median 22d on market — plan ~3-4 weeks tenant-placement turnaround); 920 units permitted in St. Louis County in 2024 (250 in 5+ unit buildings).
Forward outlook
- In year one you build about $8k of equity ($519 loan paydown + $8k appreciation (10.0% local appreciation)).
- At projected returns (10.0% appreciation + 7.5% rent growth), your $21k cash investment doubles in ~2 years — after that, you're playing with house money.
- By year 5, paydown + projected appreciation supports a ~$37k cash-out refi (75% LTV) — recoverable capital for the next deal without selling this one.
Negotiation context
- It's been on market 64 days — a 6% lower offer ($70k) is reasonable based on typical stale-listing flexibility.
- Current owner paid $65k; 15% above their basis — modest negotiation headroom, anchor on the comps not their cost.
Risks & watch-outs
- Climate carrying-cost: extreme-heat days projected 7→21/yr by 2055 (HVAC capex compounding) — expect insurance premiums to compound above CPI over the hold.
Questions for the listing agent
- It's been on market 64 days. Have you received any prior offers? Is the seller open to a 6% concession, seller financing, or rate buy-down credit?
- Built in 1968 — when were the roof, HVAC, electrical panel, plumbing, and water heater last replaced?
- What does the HOA fee cover, when was the last increase, and are there any pending special assessments or reserve-fund shortfalls?
- Any open or pending special assessments — roof, HVAC, plumbing, elevator, façade? What's the per-unit balance and payoff schedule, and is the seller paying it off at close or rolling it to the buyer?
- Why hasn't it sold? Are there any deal-killer items the seller is aware of (foundation, flood, title, zoning, code violations)?
- Is there a deadline driving the sale (1031 exchange, divorce, estate, relocation)? That informs how much negotiation room exists.
- Schools are D-rated, which usually means shorter tenancies and higher turnover. Who's the typical renter profile here, and what's been the actual vacancy rate?
- What's the average days-on-market for RENTAL listings here right now (not sales)? A rising rental-DOM trend means longer vacancies and softer asking-rent achievability than the comps imply.
- What's the recent tenant-quality profile in this submarket — average credit score on applications, eviction rate, late-payment / NSF rate, and stable-employment percentage? A property-management company in the area should have these aggregated.
- How much new apartment / multifamily construction is in the pipeline within 1–3 miles? Heavy new supply (>2% of stock underway) typically softens rents 12–24 months out; light construction supports rent growth.
Investment metrics
- 1% rule
- 1.93% ✓
- Cap rate
- 13.22%
- Cash-on-cash
- 24.74%
- DSCR
- 2.10
- GRM
- 4.3
CMA / ARV
- ARV (median comp)
- $98,501
- List price
- $75,000
- Delta
- -23.86%
- Verdict
- UNDERPRICED
- Comps
- 20 within 1.0 mi
Projected returns pro-forma
10.0% appreciation · 7.51% rent growth · sell at horizon
- IRR
- 46.1%
- Equity multiple
- 4.59×
- Total profit
- $75,438
- Equity at exit
- $67,566
- IRR
- 42.2%
- Equity multiple
- 11.36×
- Total profit
- $217,462
- Equity at exit
- $145,709
Cash invested: $21,000 (down + closing). Projections, not guarantees.
Landlord ↔ Tenant lean methodology
- Overall (STATE)
- 81 Strongly Landlord-Friendly
- State Missouri
- 81 Strongly Landlord-Friendly · R+10
- County
- — inherits STATE
- City
- — inherits STATE
ZIP-level market 63033
- Home prices YoY
- 2.5%
- Rents YoY
- 7.5%
- Active inventory
- 218
- Price-to-rent
- 4.3×
Monthly cashflow live
- Estimated rent
- $1,450 high interval (Pro) →
- Mortgage (P&I)
- −$393
- Tax from tax record
- −$64 /mo · $764/yr
- Insurance
- −$31
- HOA
- −$224
- Vacancy / Maint / Mgmt
- −$304
- Net cashflow
- $433
Break-even live
UW: 25.0% down · 7.5% · 30yr · 1.5% tax · 5.0% vac · 8.0% maint · 8.0% mgmt
Financing live
Cash to close
- Down payment
- $18,750
- Closing costs
- $2,250
- Reserves months
- —
- Total cash needed
- —
Loan-product check · same deal, 3 products live
Conventional
25% down · 7.5% · 30yr
- Down + closing
- —
- Monthly P&I
- —
- Monthly cashflow
- —
- DSCR
- —
- Eligible?
- —
Personal DTI + credit; lowest rate.
DSCR
20% down · 8.5% · 30yr
- Down + closing
- —
- Monthly P&I
- —
- Monthly cashflow
- —
- DSCR
- —
- Eligible?
- —
No personal income docs; deal must DSCR.
Hard money
10% down · 12.0% · 12mo
- Down + closing
- —
- Monthly P&I
- —
- Monthly cashflow
- —
- DSCR
- —
- Eligible?
- —
Short-term bridge; refi at stabilization.
Rent comps 15 comps
| Address | Beds | Baths | Sqft | Rent | $/sqft | DOM | Units | Dist |
|---|---|---|---|---|---|---|---|---|
| 11969 Continental Dr St. Louis, MO | 2.0–3.0 | 1.5 | 1075 | $1,035 | $0.96 | 1d | 3 | 0.51mi |
| 11592 Las Ladera Dr Florissant, MO | 3.0 | 2.0 | 986 | $1,616 | $1.64 | 7d | 1 | 0.67mi |
| 1911 Redman Rd Saint Louis, MO | 3.0 | 1.0 | 1454 | $1,495 | $1.03 | 2d | 1 | 0.79mi |
| 12810 Verwood Dr Florissant, MO | 3.0 | 2.0 | 1408 | $2,026 | $1.44 | 43d | 1 | 0.96mi |
| 1708 San Remo Ct St. Louis, MO | 1.0–3.0 | 1.0–1.5 | 1053 | $1,100 | $1.04 | 1d | 9 | 0.99mi |
| 12887 Fox Haven Dr Florissant, MO | 3.0 | 2.0 | 1135 | $1,750 | $1.54 | 43d | 1 | 1.09mi |
| 12367 Horizon Village Dr Unit 12367 I St. Louis, MO | 2.0 | 1.0 | 836 | $995 | $1.19 | 23d | 1 | 1.18mi |
| 11321 Amboy Ln Saint Louis, MO | 3.0 | 3.0 | 1182 | $1,756 | $1.49 | 1d | 1 | 1.20mi |
| 12035 Krenning Ln Saint Louis, MO | 3.0 | 1.0 | 1170 | $1,125 | $0.96 | 23d | 1 | 1.23mi |
| 12401 Horizon Village Dr Unit 12415 A St. Louis, MO | 2.0 | 1.0 | 836 | $995 | $1.19 | 43d | 1 | 1.28mi |
| 1473 Broadlawns Ln Saint Louis, MO | 3.0 | 1.0 | 1000 | $1,400 | $1.40 | 43d | 1 | 1.36mi |
| 1516 Farmview Ave Saint Louis, MO | 3.0 | 1.5 | 1156 | $1,295 | $1.12 | 43d | 1 | 1.36mi |
| 1455 Broadlawns Ln Saint Louis, MO | 3.0 | 1.0 | 912 | $1,395 | $1.53 | 12d | 1 | 1.40mi |
| 1504 Redman Blvd Saint Louis, MO | 3.0 | 2.0 | 1014 | $1,299 | $1.28 | 4d | 1 | 1.42mi |
| 6431 Brown Fox Dr Florissant, MO | 3.0 | 2.0 | 1105 | $1,905 | $1.72 | 22d | 1 | 1.46mi |
HOA detail condo
- Monthly dues
- $224 · $2,688/yr
- Likely covers
- watersewertrashexterior maint.poolgym
- Assessments
- None detected in remarks — confirm with the listing agent.
Listing history 20 events
-
2026-06-18days on market $75,000 Active 64 DOM
-
2026-06-17days on market $75,000 Active 63 DOM
-
2026-06-16days on market $75,000 Active 62 DOM
-
2026-06-15days on market $75,000 Active 61 DOM
-
2026-06-13days on market $75,000 Active 59 DOM
-
2026-06-13days on market $75,000 Active 58 DOM
-
2026-06-09days on market $75,000 Active 55 DOM
-
2026-06-08days on market $75,000 Active 54 DOM
-
2026-06-07days on market $75,000 Active 53 DOM
-
2026-06-05days on market $75,000 Active 50 DOM
-
2026-06-03days on market $75,000 Active 49 DOM
-
2026-06-02days on market $75,000 Active 48 DOM
-
2026-06-01days on market $75,000 Active 47 DOM
-
2026-05-31days on market $75,000 Active 46 DOM
-
2026-04-16$75,000 Active 946-char remark
Show marketing remark (946 chars)
GROUND-LEVEL carefree condo, walking distance to shops and restaurants, with GARAGE, private laundry and storage. Gracious entry foyer opens to flexible GREAT ROOM with wall sconces and WONDERFUL NATURAL LIGHT. FRESH INTERIOR PAINT and some new window blinds. Eat-in kitchen features NEW smooth cooktop, vent hood, wall oven, double sink and tile backsplash. Breakfast area with wall sconce and sliding door access to COVERED DECK - ideal for entertaining. Bedrooms each feature WALK-IN CLOSET and share hall bath with tub/shower combo. Basement garage with PRIVATE LAUNDRY and secure STORAGE locker. Association provides exterior maintenance, water, sewer, trash and recycle. Stay active at the nearby North County Rec Complex (gym, track, pool, playground, golf); 48-acre Evangelista Park (playground, sports, trail); and 135-acre Florissant Golf Club. CONVENIENT LOCATION with most errands within a mile and easy access to Highways 367/270/67.
-
2026-04-14historical $75,000 946-char remark
Show marketing remark (946 chars)
GROUND-LEVEL carefree condo, walking distance to shops and restaurants, with GARAGE, private laundry and storage. Gracious entry foyer opens to flexible GREAT ROOM with wall sconces and WONDERFUL NATURAL LIGHT. FRESH INTERIOR PAINT and some new window blinds. Eat-in kitchen features NEW smooth cooktop, vent hood, wall oven, double sink and tile backsplash. Breakfast area with wall sconce and sliding door access to COVERED DECK - ideal for entertaining. Bedrooms each feature WALK-IN CLOSET and share hall bath with tub/shower combo. Basement garage with PRIVATE LAUNDRY and secure STORAGE locker. Association provides exterior maintenance, water, sewer, trash and recycle. Stay active at the nearby North County Rec Complex (gym, track, pool, playground, golf); 48-acre Evangelista Park (playground, sports, trail); and 135-acre Florissant Golf Club. CONVENIENT LOCATION with most errands within a mile and easy access to Highways 367/270/67.
-
2002-06-18soldstatus $65,000
-
1999-01-20soldstatus $38,500
-
1999-01-20soldstatus $38,500
-
1994-08-23soldstatus
ⓘ Source: listings_history table (triggers on properties + properties_extension) + one-shot
backfill from property_details.listing_events for pre-trigger history.
Tax reassessment forecast MO · Resets to sale price
- Current annual tax
- $764 · $64/mo
- Projected year-2 tax
- $764 · $64/mo
- Expected delta
- $0/yr ($0/mo · 0.0%)
ⓘ Screening estimate from a state-policy table — verify with the county assessor before closing.
Climate risk First Street
- Flood 1/10 Low FEMA zone X (unshaded) · 0% chance over 30 yrs
- Wildfire 1/10 Low
- Heat 5/10 Major 7 d/yr ≥106°F today · 21 d/yr by 30 yrs out
- Wind 2/10 Low 100% chance of damaging wind over 30 yrs
- Air quality 4/10 Moderate 4 unhealthy d/yr today · 5 by 30 yrs out
Nearby sold comps map
Loading sold comps map…
Walkable amenities ~0.75 mi
Loading nearby amenities…
Taxation est. · year 1
- Rental income
- $17,394
- − Mortgage interest
- −$4,201
- − Property taxes
- −$764
- − Insurance
- −$375
- − Repairs & maintenance
- −$1,392
- − Management
- −$1,392
- − HOA
- −$2,688
- − Depreciation
- −$2,182
- Taxable income
- $4,402
- Est. tax owed @ 24.0%
- −$1,056
- After-tax cash flow
- $4,139/yr
For passive investors: Depreciation is non-cash, so a rental often shows a tax loss while cash-flowing — sheltering income. Rental losses are passive: they offset passive income freely, and up to $25,000/yr can offset ordinary (W-2) income if you actively participate and your MAGI is under $100k (phasing out to $0 by $150k); unused losses carry forward. On sale, claimed depreciation is recaptured at up to 25%, and gains may owe capital-gains tax (a 1031 exchange can defer both). Figures are a year-1 estimate at your 24.0% rate — not tax advice; consult a CPA.
Schools (NCES district)
- District
- Hazelwood
- NCES district ID
- 2913830
- Math proficiency
- 11% ▼ -13.00%
- Reading proficiency
- 26% ▼ -6.00%
- Median HH income
- $51,621
- Composite
- 16.77/100
- National rank
- #9156
- State rank
- #306 of 324 in MO
Livability — Florissant
- Score
- 73/100
- State rank
- #82
- US rank
- #5406
Category grades
Schools grade is shown separately in the Schools card above.
Census & demographics
- County
- Saint Louis County · 888,823 people
- City population
- 69,104
- Metro
- St. Louis, MO-IL
- Population (ZIP)
- 43,056
- Household income
- $66,776
- Rent vs Own
- Severe rent burden
- 1429.0
Population outlook (St. Louis County) Hauer SSP2
- Today (2025)
- 1,025,227 people
- By 2030
- 1,028,023 · +0.3%
- By 2040
- 1,020,940 · -0.4%
- By 2050
- 1,007,280 · -1.8%
- By 2075
- 987,277 · -3.7%
- By 2100
- 921,984 · -10.1%
Race, ethnicity, and origin ACS 2023
- Neighborhood character
- Predominantly Black (71%)
- Race & ethnicity
- Black 71% White 23% Two or more races 4% Hispanic / Latino 1%
- Common ancestry
- Romanian 1% Lithuanian 1% Italian 1%
- Foreign-born
- 3% · Canada, Vietnam
- Languages at home
- 95% English-only · Spanish 1% French/Haitian/Cajun 1%
Political lean MEDSL · St. Louis
- 2024 margin
- Strong D (+23.4) · D 60.8% · R 37.4% · Other 1.7%
- 2008→2024 swing
- +3.5pp toward D · 2008: 19.9pp · 2024: 23.4pp
- All cycles
- 2024: D+23.4 2020: D+24.0 2016: D+16.2 2012: D+13.7 2008: D+19.9
Not yet ingested
- Civics
- —
Market trends
- HPI YoY
- ▲ 13.78%
- Current HPI
- 570.6
- Rent YoY
- ▲ 7.51%
- Metro
- St. Louis, MO-IL
- State GDP YoY
- ▲ 1.84%
- F500 in state
- 20
Industry mix (Fortune 500 HQ in MO)
| Industry | F500 HQs | Revenue |
|---|---|---|
| Healthcare | 1 | $163B |
|
||
| Insurance | 1 | $21B |
|
||
| Industrial Technology | 1 | $17B |
|
||
| Retail | 1 | $16B |
|
||
| Industrial Distribution | 1 | $10B |
|
||
| Utilities | 1 | $9B |
|
||
Price history
+94.8% since first listed6 events — show timeline
- 2026-04-16 Listed $75,000 MARIS as Distributed by MLS Grid
- 2026-04-14 Coming Soon $75,000 MARIS as Distributed by MLS Grid
- 2002-06-18 Sold (Public Records) $65,000 Public Records
- 1999-01-20 Sold (Public Records) $38,500 Public Records
- 1999-01-20 Sold (Public Records) $38,500 Public Records
- 1994-08-23 Sold (Public Records) — Public Records
Property tax history
-0.4%/yrLatest (2022): $764 · +5.5% YoY. Source: county tax records.
Cash-flow waterfall
monthlySold comps — $/sqft
last 12 mo · ≤1 miLoading sold comps…