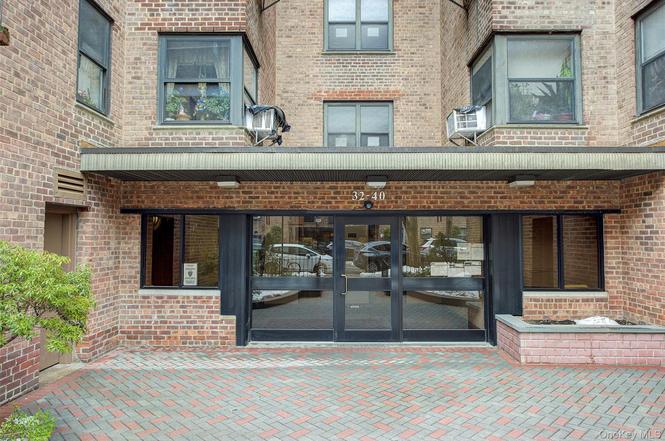
3240 91 St #309 · New York, NY
Flood risk 4/10 · Minor
- FEMA flood zone
- X (unshaded)
- Chance of flooding over 30 yrs
- 0.13%
- Est. flood insurance / yr
- $507 – $1,088
Fire risk 1/10 · Minimal
- Est. fire insurance / yr
- $691 – $1,283
Heat risk 6/10 · Moderate
- Hot days now (above 99°F)
- 7 days/yr
- Hot days in 30 yrs
- 15 days/yr
Wind risk 6/10 · Moderate
- Chance of severe wind over 30 yrs
- 27.0%
Air-quality risk 4/10 · Minor
- Unhealthy air days now
- 5 days/yr
- Unhealthy air days in 30 yrs
- 6 days/yr
Risk factors via First Street. Map © Google.
Why this score? — see what drove the D+ grade
The composite is a weighted blend of 9 inputs, each scored 0–100. Each bar is that input's sub-score; the figure is the points it added to the 100-point composite (weight × sub-score).
- Cash flow +18.0/30.0
- ARV discount +7.5/15.0
- DSCR +5.6/10.0
- Schools +5.0/10.0
- 1% rule +4.8/10.0
- Livability +3.8/5.0
- Rent growth +2.5/5.0
- Condition / age +2.5/5.0
- Appreciation +0.0/10.0
$315,000
🖨 Deal sheet 📄 Offer letter ✓ Due diligence
Listing remarks
Welcome to this spacious two-bedroom co-op in East Elmhurst / Jackson Heights, located on the third floor of a well-maintained cooperative. Offering over 930 sq. ft. , the apartment features a practical layout with well-sized rooms throughout. Hardwood floors run through the hallways and living room, adding warmth, while the living area offers ample space for both seating and dining. The windowed kitchen is efficient and functional, providing generous cabinet and counter space, along with a built-in corner breakfast nook for casual meals. A versatile foyer enhances the home’s flexibility, easily serving as a dining area, reading nook, or productive home office. The unit features a siz
Key facts
- Nearby bus lines
- Private courtyard
- Garage
Tags
Property features AI
Finance
- HOA & community: Association: Northridge II
Exterior
- Parking: Garage (parking fee applies)
- Utilities: Public sewer; Utilities: See remarks
- Home design: Stock cooperative; 6-story building; Unit entry level: 3
- Construction: Brick construction
- Exterior features: Brick exterior; Not waterfront
Interior
- Kitchen: Oven; Refrigerator
- Bedrooms: 3rd-floor entry (unit on entry level 3)
- Flooring: Hardwood floors
- Bathrooms: 1 full bathroom
- Heating & cooling: Natural gas heating
- Interior features: Eat-in kitchen; No central air conditioning
Neighborhood map
What this means for you Summary
Snapshot
- This is a 2-bed/1.0-bath condo listed at $315k.
Deal economics
- At list price, monthly cash flow is $269 ($3k/yr) — positive.
- The deal already cash-flows at list — no discount required.
- To meet the 1% rule (rent ≥ 1% of price), the offer needs to be $310k (1.7% below list).
- Recommended offer: $296k (6.0% below list) — sets the bar for market timing.
- Cap rate 7.3% vs local median 2.6% in New York — top-decile yield for the area; either an underpriced asset or a hidden risk that comps aren't pricing in. Stress-test before assuming the spread holds.
Location & tenants
- Location reads 75/100 on livability (#268 in NY, #4,188 nationally) — a middle-class / working-renter tenant base. Strengths: amenities A+, commute A+, health & safety A; Watch: crime F, cost of living F.
- Market conditions: 109 active listings in the ZIP; 19 comparable units currently listed for rent nearby; rentals at typical pace (median 22d on market — plan ~3-4 weeks tenant-placement turnaround); 5,302 units permitted in Queens County in 2024 (4,918 in 5+ unit buildings).
Forward outlook
- Local home prices are declining (-3.0%/yr); year-one equity from $2k of loan paydown is wiped out by about $9k of value loss. Plan a longer hold.
- Queens County population projected at +16% by 2050 — long-run rental-demand tailwind backs the buy-and-hold thesis.
Negotiation context
- It's been on market 76 days — a 6% lower offer ($296k) is reasonable based on typical stale-listing flexibility.
- 2 sale attempts with the ask held roughly flat each time — persistent listings suggest the price (not the market) is what's stuck; bring a comps-based counter.
Risks & watch-outs
- Watch-outs: built in 1953 — expect roof / HVAC / electrical / plumbing capex.
- Climate carrying-cost: major wind risk, 27% chance of damaging wind over 30y; extreme-heat days projected 7→15/yr by 2055 (HVAC capex compounding) — expect insurance premiums to compound above CPI over the hold.
Questions for the listing agent
- It's been on market 76 days. Have you received any prior offers? Is the seller open to a 6% concession, seller financing, or rate buy-down credit?
- Built in 1953 — when were the roof, HVAC, electrical panel, plumbing, and water heater last replaced?
- Any open or pending special assessments — roof, HVAC, plumbing, elevator, façade? What's the per-unit balance and payoff schedule, and is the seller paying it off at close or rolling it to the buyer?
- Why hasn't it sold? Are there any deal-killer items the seller is aware of (foundation, flood, title, zoning, code violations)?
- Is there a deadline driving the sale (1031 exchange, divorce, estate, relocation)? That informs how much negotiation room exists.
- Schools are B-rated — typically a magnet for longer-tenancy family renters. What's the average tenant stay here, and is there a school-zone premium baked into asking?
- Crime grade is F in this area — have there been break-ins, vandalism, or insurance claims at this property in the last 3 years? What carrier currently insures it and at what premium?
- The area grade is low — what's the realistic commute time and amenity access for the typical tenant pool here? Any planned neighborhood developments (good or bad) we should know about?
- What's the average days-on-market for RENTAL listings here right now (not sales)? A rising rental-DOM trend means longer vacancies and softer asking-rent achievability than the comps imply.
- What's the recent tenant-quality profile in this submarket — average credit score on applications, eviction rate, late-payment / NSF rate, and stable-employment percentage? A property-management company in the area should have these aggregated.
- How much new apartment / multifamily construction is in the pipeline within 1–3 miles? Heavy new supply (>2% of stock underway) typically softens rents 12–24 months out; light construction supports rent growth.
Investment metrics
- 1% rule
- 0.98% ✗
- Cap rate
- 7.32%
- Cash-on-cash
- 3.66%
- DSCR
- 1.16
- GRM
- 8.5
CMA / ARV
No comps found within radius.
Projected returns pro-forma
-3.0% appreciation · 3.0% rent growth · sell at horizon
- IRR
- -10.5%
- Equity multiple
- 0.62×
- Total profit
- $-33,864
- Equity at exit
- $46,968
- IRR
- -1.2%
- Equity multiple
- 0.92×
- Total profit
- $-7,238
- Equity at exit
- $27,235
Cash invested: $88,200 (down + closing). Projections, not guarantees.
Landlord ↔ Tenant lean methodology
- Overall (CITY)
- 0 Strongly Tenant-Friendly
- State New York
- 15 Strongly Tenant-Friendly · D+10
- County
- — inherits STATE
- City New York
- 0 Strongly Tenant-Friendly · D+34
ZIP-level market 11369
- Home prices YoY
- -26.6%
- Active inventory
- 109
- Price-to-rent
- 8.5×
Monthly cashflow live
- Estimated rent
- $3,096 high interval (Pro) →
- Mortgage (P&I)
- −$1,652
- Tax est. 1.5%
- −$394 /mo · $4,725/yr
- Insurance
- −$131
- HOA
- −$0
- Vacancy / Maint / Mgmt
- −$650
- Net cashflow
- $269
Break-even live
UW: 25.0% down · 7.5% · 30yr · 1.5% tax · 5.0% vac · 8.0% maint · 8.0% mgmt
Financing live
Cash to close
- Down payment
- $78,750
- Closing costs
- $9,450
- Reserves months
- —
- Total cash needed
- —
Loan-product check · same deal, 3 products live
Conventional
25% down · 7.5% · 30yr
- Down + closing
- —
- Monthly P&I
- —
- Monthly cashflow
- —
- DSCR
- —
- Eligible?
- —
Personal DTI + credit; lowest rate.
DSCR
20% down · 8.5% · 30yr
- Down + closing
- —
- Monthly P&I
- —
- Monthly cashflow
- —
- DSCR
- —
- Eligible?
- —
No personal income docs; deal must DSCR.
Hard money
10% down · 12.0% · 12mo
- Down + closing
- —
- Monthly P&I
- —
- Monthly cashflow
- —
- DSCR
- —
- Eligible?
- —
Short-term bridge; refi at stabilization.
Rent comps 19 comps
| Address | Beds | Baths | Sqft | Rent | $/sqft | DOM | Units | Dist |
|---|---|---|---|---|---|---|---|---|
| 8910 35th Ave Unit E1L Jackson Heights, NY | 2.0 | 1.0 | 850 | $3,050 | $3.59 | 24d | 1 | 0.33mi |
| 31-40 98th St Unit 2 Flushing, NY | 1.0 | 1.0 | 800 | $2,100 | $2.62 | 7d | 1 | 0.36mi |
| 30-13 85th St Unit 2 Flushing, NY | 3.0 | 1.0 | 1100 | $3,800 | $3.45 | 22d | 1 | 0.43mi |
| 98-07 37th Ave Flushing, NY | 3.0 | 1.0 | 750 | $3,350 | $4.47 | 24d | 1 | 0.54mi |
| 25-61 99th St Unit 2nd Fl Flushing, NY | 2.0 | 1.0 | 780 | $3,200 | $4.10 | 24d | 1 | 0.55mi |
| 31-47 102nd St Unit 2 fl Flushing, NY | 2.0 | 1.0 | 650 | $2,600 | $4.00 | 24d | 1 | 0.57mi |
| 3716 83rd St Jackson Heights, NY | 1.0 | 1.0 | 700 | $1,800 | $2.57 | 18d | 1 | 0.64mi |
| 4050 Case St Elmhurst, NY | 3.0 | 2.0 | 988 | $3,900 | $3.95 | 7d | 1 | 0.66mi |
| 40-85 Denman St Unit 2 Elmhurst, NY | 3.0 | 1.5 | 1100 | $3,200 | $2.91 | 20d | 1 | 0.69mi |
| 2724 Gillmore St Unit 2 East Elmhurst, NY | 1.0 | 1.0 | 576 | $2,300 | $3.99 | 24d | 1 | 0.70mi |
| 9707 24th Ave East Elmhurst, NY | 3.0 | 1.5 | 1100 | $4,500 | $4.09 | 24d | 1 | 0.70mi |
| 3260 106th St East Elmhurst, NY | 1.0 | 1.0 | 600 | $3,750 | $6.25 | 7d | 1 | 0.74mi |
| 3730 103rd St Corona, NY | 1.0 | 1.0 | 540 | $1,800 | $3.33 | 18d | 1 | 0.75mi |
| 9209 43rd Ave Unit 2 Elmhurst, NY | 3.0 | 1.5 | 1100 | $3,200 | $2.91 | 24d | 1 | 0.93mi |
| 8360 Vietor Ave Unit 6P Elmhurst, NY | 2.0 | 1.0 | 850 | $2,650 | $3.12 | 15d | 1 | 0.94mi |
| 91-04 43rd Ave Unit 2ND Elmhurst, NY | 3.0 | 1.0 | 1100 | $3,600 | $3.27 | 24d | 1 | 0.96mi |
| 10302 42nd Ave Unit 4D Corona, NY | 2.0 | 1.5 | 761 | $3,400 | $4.47 | 18d | 1 | 1.00mi |
| 4911 108th St Unit 4A Corona, NY | 3.0 | 2.0 | 1027 | $3,600 | $3.51 | 17d | 1 | 1.40mi |
| 10869 50th Ave Corona, NY | 3.0 | 1.0 | 912 | $3,300 | $3.62 | 24d | 1 | 1.48mi |
HOA detail condo
- Monthly dues
- $0 · $0/yr
- Assessments
- None detected in remarks — confirm with the listing agent.
Listing history 5 events
-
2026-05-12status Pending
-
2026-02-25$315,000 Active
-
2026-01-01historical
-
2025-09-08price $325,000
-
2025-06-25$337,000 Active
ⓘ Source: listings_history table (triggers on properties + properties_extension) + one-shot
backfill from property_details.listing_events for pre-trigger history.
Climate risk First Street
- Flood 4/10 Moderate FEMA zone X (unshaded) · 13% chance over 30 yrs
- Wildfire 1/10 Low
- Heat 6/10 Major 7 d/yr ≥99°F today · 15 d/yr by 30 yrs out
- Wind 6/10 Major 27% chance of damaging wind over 30 yrs
- Air quality 4/10 Moderate 5 unhealthy d/yr today · 6 by 30 yrs out
Nearby sold comps map
Loading sold comps map…
Walkable amenities ~0.75 mi
Loading nearby amenities…
Taxation est. · year 1
- Rental income
- $37,153
- − Mortgage interest
- −$17,645
- − Property taxes
- −$4,725
- − Insurance
- −$1,575
- − Repairs & maintenance
- −$2,972
- − Management
- −$2,972
- − Depreciation
- −$9,164
- Taxable loss
- −$1,900
- Est. tax savings @ 24.0%
- +$456
- After-tax cash flow
- $3,684/yr
For passive investors: Depreciation is non-cash, so a rental often shows a tax loss while cash-flowing — sheltering income. Rental losses are passive: they offset passive income freely, and up to $25,000/yr can offset ordinary (W-2) income if you actively participate and your MAGI is under $100k (phasing out to $0 by $150k); unused losses carry forward. On sale, claimed depreciation is recaptured at up to 25%, and gains may owe capital-gains tax (a 1031 exchange can defer both). Figures are a year-1 estimate at your 24.0% rate — not tax advice; consult a CPA.
Schools (NCES district)
No district data.
Livability — New York
- Score
- 75/100
- State rank
- #268
- US rank
- #4188
Category grades
Schools grade is shown separately in the Schools card above.
Census & demographics
- Census place
- New York, NY
- City population
- 7,731,280
- Population (ZIP)
- 33,354
Population outlook (Queens County) Hauer SSP2
- Today (2025)
- 2,546,320 people
- By 2030
- 2,643,059 · +3.8%
- By 2040
- 2,815,563 · +10.6%
- By 2050
- 2,944,423 · +15.6%
- By 2075
- 3,123,338 · +22.7%
- By 2100
- 3,098,688 · +21.7%
Race, ethnicity, and origin ACS 2023
- Neighborhood character
- Diverse neighborhood (Simpson 0.60)
- Race & ethnicity
- Hispanic / Latino 59% Black 17% Two or more races 14% Asian 14% White 7%
- Hispanic origin (detail)
- Mexican 11% Puerto Rican 4% Dominican 12%
- Common ancestry
- Hispanic 1% Lithuanian 1% Estonian 1%
- Foreign-born
- 53% · Canada, Jamaica, China
- Languages at home
- 28% English-only · Spanish 56% Other Indo-European 6% Chinese 4%
Political lean MEDSL · Queens
- 2024 margin
- Strong D (+24.6) · D 62.3% · R 37.7%
- 2008→2024 swing
- -26.2pp toward R · 2008: 50.8pp · 2024: 24.6pp
- All cycles
- 2024: D+24.6 2020: D+45.2 2016: D+53.4 2012: D+58.5 2008: D+50.8
Not yet ingested
- Civics
- —
Market trends
- HPI YoY
- ▼ -134.70%
- Current HPI
- 371.5179
- Rent YoY
- —
- Metro
- —
- State GDP YoY
- ▲ 2.60%
- F500 in state
- 92
Industry mix (Fortune 500 HQ in NY)
| Industry | F500 HQs | Revenue |
|---|---|---|
| Financial Services | 10 | $950B |
|
||
| Consumer Goods | 9 | $162B |
|
||
| Insurance | 4 | $225B |
|
||
| Telecommunications | 2 | $144B |
|
||
| Pharmaceuticals | 2 | $112B |
|
||
| Media / Entertainment | 2 | $69B |
|
||
Price history
-6.5% since first listed5 events — show timeline
- 2026-05-12 Pending — OneKey® MLS as Distributed by MLS Grid
- 2026-02-25 Listed $315,000 OneKey® MLS as Distributed by MLS Grid
- 2026-01-01 Listing Removed — OneKey® MLS as Distributed by MLS Grid
- 2025-09-08 Price Changed $325,000 OneKey® MLS as Distributed by MLS Grid
- 2025-06-25 Listed $337,000 OneKey® MLS as Distributed by MLS Grid
Cash-flow waterfall
monthlySold comps — $/sqft
last 12 mo · ≤1 miLoading sold comps…