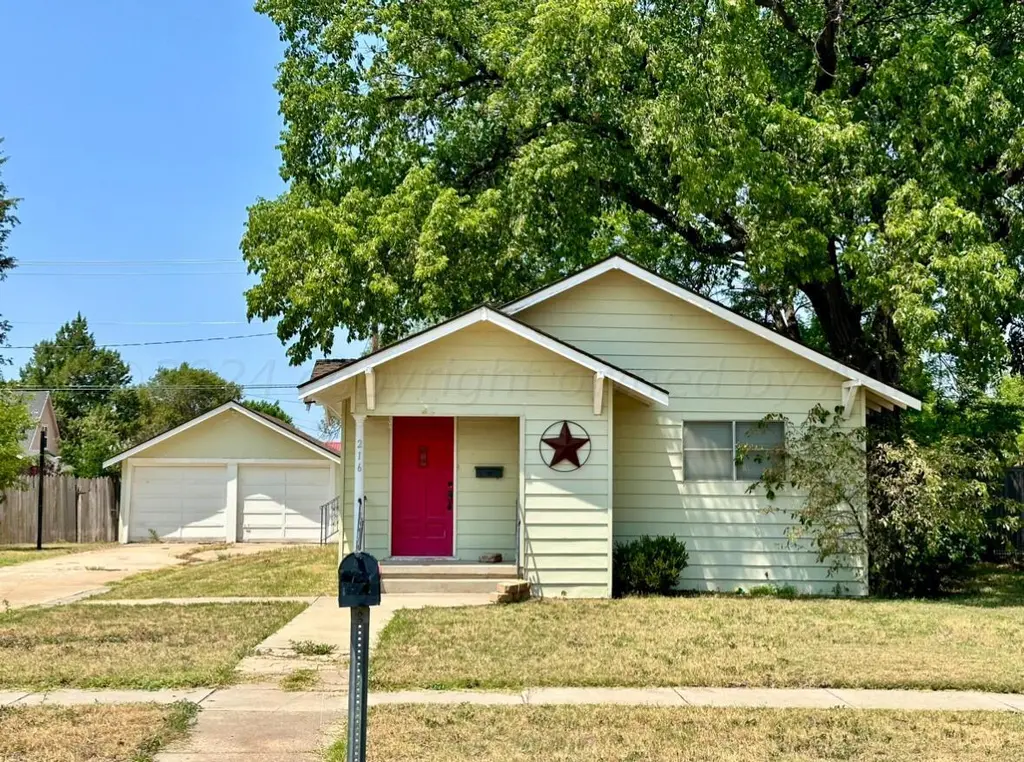
216 S Barkley St · Spearman, TX
Flood risk 1/10 · Minimal
- FEMA flood zone
- —
- Chance of flooding over 30 yrs
- 0.0%
- Est. flood insurance / yr
- —
Fire risk 7/10 · Major
- Est. fire insurance / yr
- $1,222 – $2,270
Heat risk 5/10 · Moderate
- Hot days now (above 102°F)
- 7 days/yr
- Hot days in 30 yrs
- 19 days/yr
Wind risk 2/10 · Minimal
- Chance of severe wind over 30 yrs
- —
Air-quality risk 2/10 · Minimal
- Unhealthy air days now
- 1 days/yr
- Unhealthy air days in 30 yrs
- 1 days/yr
Risk factors via First Street. Map © Google.
Why this score? — see what drove the B- grade
The composite is a weighted blend of 9 inputs, each scored 0–100. Each bar is that input's sub-score; the figure is the points it added to the 100-point composite (weight × sub-score).
- Cash flow +28.4/30.0
- DSCR +10.0/10.0
- 1% rule +8.9/10.0
- ARV discount +7.5/15.0
- Schools +5.0/10.0
- Livability +3.5/5.0
- Rent growth +2.5/5.0
- Condition / age +2.5/5.0
- Appreciation +0.0/10.0
$86,000
🖨 Deal sheet 📄 Offer letter ✓ Due diligence
Listing remarks MLS
Charming 3-bedroom, 1-bath home with great potential! Ideal for first-time buyers or investors, this house features central air and heat, an oversized storage closet, and a versatile layout where one bedroom can serve as a dining room. Enjoy the spacious fenced yard and a detached double-car garage, complete with a separate room for added flexibility. While the home could use some updating, it offers solid bones and endless possibilities for customization. Don't miss this opportunity to make it your own!
Key facts
- Versatile layout
- Spacious fenced yard
- Separate room
Tags
Neighborhood map
What this means for you Summary
Snapshot
- This is a 3-bed/2.0-bath single-family listed at $86k.
Deal economics
- At list price, monthly cash flow is $279 ($3k/yr) — positive.
- The deal already cash-flows at list — no discount required.
- Meets the 1% rule at list price ($1k rent vs $86k).
- Recommended offer: $76k (12.0% below list) — sets the bar for market timing.
Location & tenants
- Location reads 70/100 on livability (#335 in TX) — a middle-class / working-renter tenant base. Strengths: crime A+, cost of living A+, housing A+; Watch: schools C-, amenities F, commute F.
- Spearman ISD (town): math 62% / reading 57% proficiency, ranked #80 of 826 in TX (top 10%) — acceptable for families but not a draw, mixed tenant base, ~2y average lease.
- Market conditions: 20 active listings in the ZIP.
Forward outlook
- Local home prices are declining (-3.0%/yr); year-one equity from $595 of loan paydown is wiped out by about $3k of value loss. Plan a longer hold.
- Hansford County population projected at +4% by 2050 — modest demand growth; plan on rents tracking national, not racing it.
- At projected returns (-3.0% appreciation + 3.0% rent growth), your $24k cash investment doubles in ~9 years — after that, you're playing with house money.
Negotiation context
- It's been on market 330 days — a 12% lower offer ($76k) is reasonable based on typical stale-listing flexibility.
Risks & watch-outs
- Watch-outs: built in 1950 — expect roof / HVAC / electrical / plumbing capex.
- Climate carrying-cost: major wildfire risk; extreme-heat days projected 7→19/yr by 2055 (HVAC capex compounding) — expect insurance premiums to compound above CPI over the hold.
Questions for the listing agent
- It's been on market 330 days. Have you received any prior offers? Is the seller open to a 12% concession, seller financing, or rate buy-down credit?
- Built in 1950 — when were the roof, HVAC, electrical panel, plumbing, and water heater last replaced?
- Why hasn't it sold? Are there any deal-killer items the seller is aware of (foundation, flood, title, zoning, code violations)?
- Is there a deadline driving the sale (1031 exchange, divorce, estate, relocation)? That informs how much negotiation room exists.
- What's the average days-on-market for RENTAL listings here right now (not sales)? A rising rental-DOM trend means longer vacancies and softer asking-rent achievability than the comps imply.
- What's the recent tenant-quality profile in this submarket — average credit score on applications, eviction rate, late-payment / NSF rate, and stable-employment percentage? A property-management company in the area should have these aggregated.
- How much new for-sale + rental construction is in the pipeline within 1–3 miles? Heavy new supply typically softens prices + rents 12–24 months out; constrained supply supports both.
Investment metrics
- 1% rule
- 1.39% ✓
- Cap rate
- 10.18%
- Cash-on-cash
- 13.88%
- DSCR
- 1.62
- GRM
- 6.0
CMA / ARV
No comps found within radius.
Projected returns pro-forma
-3.0% appreciation · 3.0% rent growth · sell at horizon
- IRR
- 4.1%
- Equity multiple
- 1.16×
- Total profit
- $3,863
- Equity at exit
- $12,823
- IRR
- 13.7%
- Equity multiple
- 2.10×
- Total profit
- $26,450
- Equity at exit
- $7,436
Cash invested: $24,080 (down + closing). Projections, not guarantees.
Landlord ↔ Tenant lean methodology
- Overall (STATE)
- 87 Strongly Landlord-Friendly
- State Texas
- 87 Strongly Landlord-Friendly · R+5
- County
- — inherits STATE
- City
- — inherits STATE
ZIP-level market 79081
- Home prices YoY
- -31.7%
- Active inventory
- 20
- Price-to-rent
- 6.0×
Monthly cashflow live
- Estimated rent
- $1,192 medium interval (Pro) →
- Mortgage (P&I)
- −$451
- Tax from tax record
- −$176 /mo · $2,115/yr
- Insurance
- −$36
- HOA
- −$0
- Vacancy / Maint / Mgmt
- −$250
- Net cashflow
- $279
Break-even live
UW: 25.0% down · 7.5% · 30yr · 1.5% tax · 5.0% vac · 8.0% maint · 8.0% mgmt
Financing live
Cash to close
- Down payment
- $21,500
- Closing costs
- $2,580
- Reserves months
- —
- Total cash needed
- —
Loan-product check · same deal, 3 products live
Conventional
25% down · 7.5% · 30yr
- Down + closing
- —
- Monthly P&I
- —
- Monthly cashflow
- —
- DSCR
- —
- Eligible?
- —
Personal DTI + credit; lowest rate.
DSCR
20% down · 8.5% · 30yr
- Down + closing
- —
- Monthly P&I
- —
- Monthly cashflow
- —
- DSCR
- —
- Eligible?
- —
No personal income docs; deal must DSCR.
Hard money
10% down · 12.0% · 12mo
- Down + closing
- —
- Monthly P&I
- —
- Monthly cashflow
- —
- DSCR
- —
- Eligible?
- —
Short-term bridge; refi at stabilization.
Listing history 17 events
-
2026-06-18days on market $86,000 Active 330 DOM
-
2026-06-17days on market $86,000 Active 329 DOM
-
2026-06-16days on market $86,000 Active 328 DOM
-
2026-06-15days on market $86,000 Active 327 DOM
-
2026-06-15days on market $86,000 Active 326 DOM
-
2026-06-13days on market $86,000 Active 325 DOM
-
2026-06-12days on market $86,000 Active 324 DOM
-
2026-06-09days on market $86,000 Active 321 DOM
-
2026-06-08days on market $86,000 Active 320 DOM
-
2026-06-08days on market $86,000 Active 319 DOM
-
2026-06-07days on market $86,000 Active 318 DOM
-
2026-06-03days on market $86,000 Active 315 DOM
-
2026-06-02days on market $86,000 Active 314 DOM
-
2026-06-01days on market $86,000 Active 313 DOM
-
2026-05-31days on market $86,000 Active 312 DOM
-
2025-07-23$86,000 Active 509-char remark
Show marketing remark (509 chars)
Charming 3-bedroom, 1-bath home with great potential! Ideal for first-time buyers or investors, this house features central air and heat, an oversized storage closet, and a versatile layout where one bedroom can serve as a dining room. Enjoy the spacious fenced yard and a detached double-car garage, complete with a separate room for added flexibility. While the home could use some updating, it offers solid bones and endless possibilities for customization. Don't miss this opportunity to make it your own!
-
2024-09-23price $86,000
ⓘ Source: listings_history table (triggers on properties + properties_extension) + one-shot
backfill from property_details.listing_events for pre-trigger history.
Tax reassessment forecast TX · Resets to sale price
- Current annual tax
- $2,115 · $176/mo
- Projected year-2 tax
- $2,115 · $176/mo
- Expected delta
- $0/yr ($0/mo · 0.0%)
ⓘ Screening estimate from a state-policy table — verify with the county assessor before closing.
Climate risk First Street
- Flood 1/10 Low 0% chance over 30 yrs
- Wildfire 7/10 Severe
- Heat 5/10 Major 7 d/yr ≥102°F today · 19 d/yr by 30 yrs out
- Wind 2/10 Low
- Air quality 2/10 Low 1 unhealthy d/yr today · 1 by 30 yrs out
Nearby sold comps map
Loading sold comps map…
Walkable amenities ~0.75 mi
Loading nearby amenities…
Taxation est. · year 1
- Rental income
- $14,303
- − Mortgage interest
- −$4,817
- − Property taxes
- −$2,115
- − Insurance
- −$430
- − Repairs & maintenance
- −$1,144
- − Management
- −$1,144
- − Depreciation
- −$2,502
- Taxable income
- $2,150
- Est. tax owed @ 24.0%
- −$516
- After-tax cash flow
- $2,826/yr
For passive investors: Depreciation is non-cash, so a rental often shows a tax loss while cash-flowing — sheltering income. Rental losses are passive: they offset passive income freely, and up to $25,000/yr can offset ordinary (W-2) income if you actively participate and your MAGI is under $100k (phasing out to $0 by $150k); unused losses carry forward. On sale, claimed depreciation is recaptured at up to 25%, and gains may owe capital-gains tax (a 1031 exchange can defer both). Figures are a year-1 estimate at your 24.0% rate — not tax advice; consult a CPA.
Schools (NCES district)
- District
- Spearman ISD
- NCES district ID
- 4841010
- Math proficiency
- 62% ▼ -4.00%
- Reading proficiency
- 57% ▲ 4.00%
- Median HH income
- $42,850
- Composite
- 50.01/100
- National rank
- #1921
- State rank
- #80 of 826 in TX
Livability — Spearman
- Score
- 70/100
- State rank
- #335
- US rank
- #7322
Category grades
Schools grade is shown separately in the Schools card above.
Census & demographics
- Census place
- Spearman, TX
- Population (ZIP)
- 3,224
Population outlook (Hansford County) Hauer SSP2
- Today (2025)
- 5,722 people
- By 2030
- 5,762 · +0.7%
- By 2040
- 5,866 · +2.5%
- By 2050
- 5,931 · +3.7%
- By 2075
- 6,002 · +4.9%
- By 2100
- 5,509 · -3.7%
Race, ethnicity, and origin ACS 2023
- Neighborhood character
- Majority White (51%)
- Race & ethnicity
- White 51% Hispanic / Latino 48% Two or more races 21%
- Hispanic origin (detail)
- Mexican 45% Puerto Rican 2%
- Common ancestry
- Serbian 1% Portuguese 1%
- Foreign-born
- 16% · Canada
- Languages at home
- 70% English-only · Spanish 29%
Political lean MEDSL · Hansford
- 2024 margin
- Solid R (+84.8) · D 7.3% · R 92.2%
- 2008→2024 swing
- -8.4pp toward R · 2008: -76.5pp · 2024: -84.8pp
- All cycles
- 2024: R+84.8 2020: R+82.2 2016: R+80.1 2012: R+83.1 2008: R+76.5
Not yet ingested
- Civics
- —
Market trends
- HPI YoY
- ▼ -51.80%
- Current HPI
- 111.3876
- Rent YoY
- —
- Metro
- —
- State GDP YoY
- ▲ 3.95%
- F500 in state
- 110
Industry mix (Fortune 500 HQ in TX)
| Industry | F500 HQs | Revenue |
|---|---|---|
| Energy | 16 | $1,198B |
|
||
| Technology | 5 | $198B |
|
||
| Engineering / Construction | 4 | $72B |
|
||
| Energy Services | 3 | $60B |
|
||
| Utilities | 3 | $41B |
|
||
| Healthcare | 2 | $330B |
|
||
Price history
+0.0% since first listed2 events — show timeline
- 2025-07-23 Listed $86,000 AARMLS
- 2024-09-23 Price Changed $86,000 AARMLS
Property tax history
+7.7%/yrLatest (2025): $2,115 · +32.5% YoY. Source: county tax records.
Cash-flow waterfall
monthlySold comps — $/sqft
last 12 mo · ≤1 miLoading sold comps…