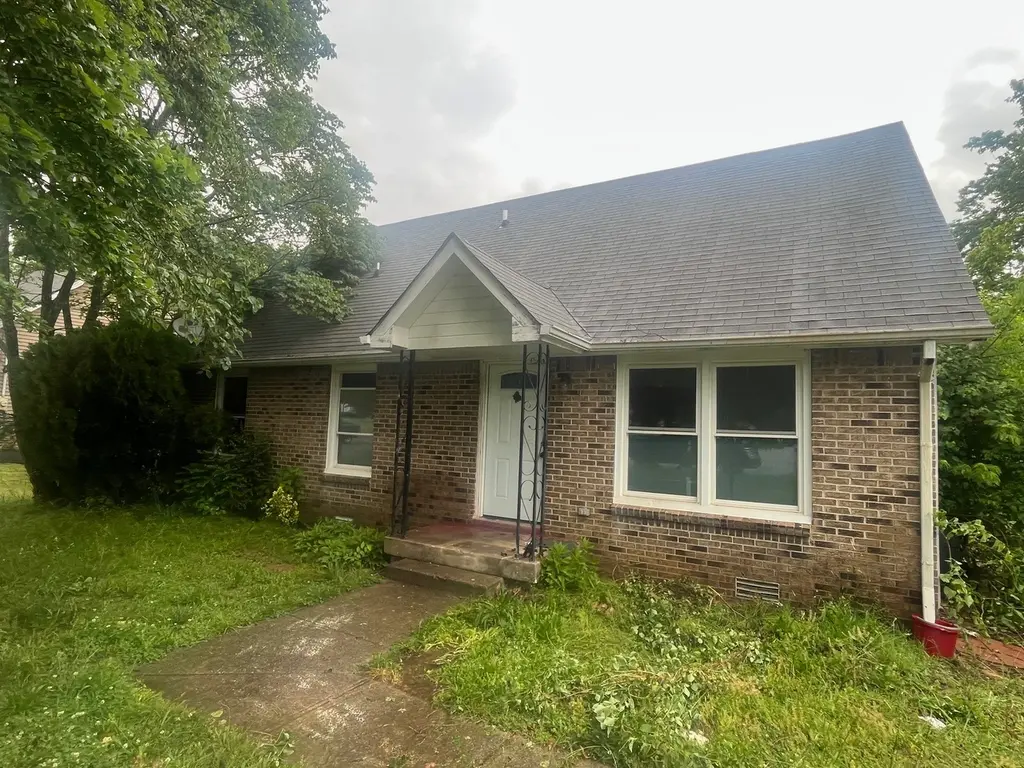
439 Cunningham Ln · Clarksville, TN
Flood risk 1/10 · Minimal
- FEMA flood zone
- X (unshaded)
- Chance of flooding over 30 yrs
- 0.0%
- Est. flood insurance / yr
- $507 – $1,088
Fire risk 3/10 · Minor
- Est. fire insurance / yr
- $949 – $1,763
Heat risk 5/10 · Moderate
- Hot days now (above 107°F)
- 7 days/yr
- Hot days in 30 yrs
- 21 days/yr
Wind risk 4/10 · Minor
- Chance of severe wind over 30 yrs
- 9.0%
Air-quality risk 2/10 · Minimal
- Unhealthy air days now
- 1 days/yr
- Unhealthy air days in 30 yrs
- 1 days/yr
Risk factors via First Street. Map © Google.
Why this score? — see what drove the C grade
The composite is a weighted blend of 9 inputs, each scored 0–100. Each bar is that input's sub-score; the figure is the points it added to the 100-point composite (weight × sub-score).
- Cash flow +19.3/30.0
- ARV discount +15.0/15.0
- DSCR +6.1/10.0
- 1% rule +4.5/10.0
- Livability +4.2/5.0
- Rent growth +2.8/5.0
- Schools +2.5/10.0
- Condition / age +2.5/5.0
- Appreciation +0.0/10.0
$165,000
🖨 Deal sheet 📄 Offer letter ✓ Due diligence
Listing remarks MLS
Great 4 BR/2 Bath home has been renovated/updated*New carpet*new paint*newer appliances*tile backsplash in kitchen*home & HVAC recently inspected and in good condition*looks great!
Key facts
- 0.27 acre lot
- Built 1985
- Listed 4 days
Tags
Property features AI
Finance
- Other: Living area reported as 1,549 square feet (agent measured); Lot size approximately 0.27 acres
Exterior
- Parking: No covered spaces listed; No parking total listed
- Utilities: Public water; Public sewer; Electricity available; Cable connected
- Home design: Single-family residence; Two levels; Residential property
- Construction: Brick and vinyl siding exterior; Shingle roof; Block foundation; Existing structure (year built not specified)
- Exterior features: Porch (covered); Patio; Back yard fencing; Level lot
Interior
- Kitchen: Kitchen (18x12) with electric oven, electric range, refrigerator
- Bedrooms: Four bedrooms total; Two main-level bedrooms; Bedroom sizes include 14x12, 14x10, 16x13, 16x13; one bedroom has an extra-large closet
- Flooring: Carpet, Laminate, Vinyl
- Bathrooms: Two full bathrooms
- Heating & cooling: Central heating with heat pump; Central air conditioning (electric)
- Interior features: Electric oven, Electric range, Refrigerator; Crawl space basement
- Laundry & utility: Washer hookup, Electric dryer hookup
Neighborhood map
What this means for you Summary
Snapshot
- This is a 4-bed/2.0-bath single-family listed at $165k.
Deal economics
- At list price, monthly cash flow is $180 ($2k/yr) — positive.
- The deal already cash-flows at list — no discount required.
- To meet the 1% rule (rent ≥ 1% of price), the offer needs to be $157k (4.6% below list).
- Recommended offer: $157k (4.6% below list) — sets the bar for 1% rule.
- Cap rate 7.6% vs local median 3.5% in Clarksville — top-decile yield for the area; either an underpriced asset or a hidden risk that comps aren't pricing in. Stress-test before assuming the spread holds.
Location & tenants
- Location reads 84/100 on livability (#1 in TN, #798 nationally) — a professional / high-income tenant draw. Strengths: amenities A+, commute A+, cost of living A+; Watch: employment C-, crime D+.
- Montgomery County (urban): math 25% / reading 31% proficiency, ranked #65 of 139 in TN (top 47%) — low school quality limits family demand, transient renter base, plan for 1-2y turnover.
- Zoned schools: Liberty Elementary (math 29% / reading 29%, grade F, #461 of 952 statewide, top 49%, 804 students, 0% FRL); Northwest High (math 6% / reading 34%, grade F, #178 of 332 statewide, top 55%, 1,456 students, 0% FRL) — zoned schools average 0% FRL vs 40% district-wide (40 pts lower); this property's tenant base skews higher-income than the district average.
- Market conditions: Rents rising (+1.3%/yr); 893 active listings in the ZIP; 40 comparable units currently listed for rent nearby; rentals at typical pace (median 22d on market — plan ~3-4 weeks tenant-placement turnaround); 2,583 units permitted in Montgomery County in 2024 (617 in 5+ unit buildings).
Forward outlook
- Local home prices are declining (-3.0%/yr); year-one equity from $1k of loan paydown is wiped out by about $5k of value loss. Plan a longer hold.
- Montgomery County population projected at +49% by 2050 — long-run rental-demand tailwind backs the buy-and-hold thesis.
Negotiation context
- Only 4 days on market — expect competitive offers; lowballing is unlikely to land.
- 4 sale attempts since 15y ago with the ask held roughly flat each time — persistent listings suggest the price (not the market) is what's stuck; bring a comps-based counter.
- Current owner paid $105k; list at $165k implies a 57% gain — meaningful room to come down on a strong offer.
Risks & watch-outs
- Climate carrying-cost: extreme-heat days projected 7→21/yr by 2055 (HVAC capex compounding) — expect insurance premiums to compound above CPI over the hold.
Questions for the listing agent
- Is there a deadline driving the sale (1031 exchange, divorce, estate, relocation)? That informs how much negotiation room exists.
- Crime grade is D in this area — have there been break-ins, vandalism, or insurance claims at this property in the last 3 years? What carrier currently insures it and at what premium?
- What's the average days-on-market for RENTAL listings here right now (not sales)? A rising rental-DOM trend means longer vacancies and softer asking-rent achievability than the comps imply.
- What's the recent tenant-quality profile in this submarket — average credit score on applications, eviction rate, late-payment / NSF rate, and stable-employment percentage? A property-management company in the area should have these aggregated.
- How much new for-sale + rental construction is in the pipeline within 1–3 miles? Heavy new supply typically softens prices + rents 12–24 months out; constrained supply supports both.
Investment metrics
- 1% rule
- 0.95% ✗
- Cap rate
- 7.60%
- Cash-on-cash
- 4.67%
- DSCR
- 1.21
- GRM
- 8.7
CMA / ARV
- ARV (on-the-fly)
- $265,200
- Comps found
- 12
Show comp detail 12 sales within ~0.75 mi
| Address | Dist | Beds/Ba | Sqft | Sold | Price | $/sf | Match |
|---|---|---|---|---|---|---|---|
| 734 Lafayette Rd | 0.23mi | 3/1.0 (-1) | 1,325 (-0%) | 1mo | $201,000 | $152 | 80 |
| 205 Hazelnut Ct | 0.54mi | 3/2.0 (-1) | 1,300 (-2%) | 3mo | $279,000 | $215 | 65 |
| 1503 Sunshine Dr | 0.21mi | 3/2.0 (-1) | 1,150 (-13%) | 0mo | $230,000 | $200 | 63 |
| 442 N Magnolia Dr | 0.70mi | 3/2.0 (-1) | 1,366 (+3%) | 0mo | $295,000 | $216 | 57 |
| 1502 Pinetree Rd | 0.47mi | 4/2.0 | 1,500 (+13%) | 1mo | $268,000 | $179 | 55 |
| 822 Garrettsburg Rd | 0.54mi | 4/2.5 | 1,472 (+11%) | 2mo | $230,000 | $156 | 53 |
| 123 Cunningham Pl | 0.62mi | 3/2.0 (-1) | 1,430 (+8%) | 1mo | $239,500 | $167 | 52 |
| 628 Woodhaven Dr | 0.56mi | 3/2.0 (-1) | 1,195 (-10%) | 0mo | $243,000 | $203 | 52 |
| 1504 Glennon Dr | 0.59mi | 3/1.0 (-1) | 1,175 (-11%) | 1mo | $248,400 | $211 | 44 |
| 900 Garrettsburg Rd | 0.64mi | 3/1.0 (-1) | 1,150 (-13%) | 1mo | $171,000 | $149 | 38 |
| 608 Woodhaven Dr | 0.67mi | 3/2.0 (-1) | 1,131 (-15%) | 2mo | $222,000 | $196 | 38 |
| 517 Sourwood Dr | 0.71mi | 3/2.5 (-1) | 1,505 (+14%) | 0mo | $305,000 | $203 | 37 |
Match score weights: distance 35% · size 25% · config 20% · recency 20%. Top-matched comps best support the ARV.
Projected returns pro-forma
-3.0% appreciation · 1.27% rent growth · sell at horizon
- IRR
- -10.9%
- Equity multiple
- 0.61×
- Total profit
- $-18,009
- Equity at exit
- $24,602
- IRR
- -4.1%
- Equity multiple
- 0.75×
- Total profit
- $-11,714
- Equity at exit
- $14,266
Cash invested: $46,200 (down + closing). Projections, not guarantees.
Landlord ↔ Tenant lean methodology
- Overall (STATE)
- 87 Strongly Landlord-Friendly
- State Tennessee
- 87 Strongly Landlord-Friendly · R+13
- County
- — inherits STATE
- City
- — inherits STATE
ZIP-level market 37042
- Home prices YoY
- -18.2%
- Rents YoY
- 1.3%
- Active inventory
- 893
- Price-to-rent
- 8.7×
Monthly cashflow live
- Estimated rent
- $1,574 high interval (Pro) →
- Mortgage (P&I)
- −$865
- Tax from tax record
- −$130 /mo · $1,555/yr
- Insurance
- −$69
- HOA
- −$0
- Vacancy / Maint / Mgmt
- −$330
- Net cashflow
- $180
Break-even live
UW: 25.0% down · 7.5% · 30yr · 1.5% tax · 5.0% vac · 8.0% maint · 8.0% mgmt
Financing live
Cash to close
- Down payment
- $41,250
- Closing costs
- $4,950
- Reserves months
- —
- Total cash needed
- —
Loan-product check · same deal, 3 products live
Conventional
25% down · 7.5% · 30yr
- Down + closing
- —
- Monthly P&I
- —
- Monthly cashflow
- —
- DSCR
- —
- Eligible?
- —
Personal DTI + credit; lowest rate.
DSCR
20% down · 8.5% · 30yr
- Down + closing
- —
- Monthly P&I
- —
- Monthly cashflow
- —
- DSCR
- —
- Eligible?
- —
No personal income docs; deal must DSCR.
Hard money
10% down · 12.0% · 12mo
- Down + closing
- —
- Monthly P&I
- —
- Monthly cashflow
- —
- DSCR
- —
- Eligible?
- —
Short-term bridge; refi at stabilization.
Rent comps 40 comps
| Address | Beds | Baths | Sqft | Rent | $/sqft | DOM | Units | Dist |
|---|---|---|---|---|---|---|---|---|
| 410 Appleton Dr Clarksville, TN | 4.0 | 2.0 | 1593 | $1,475 | $0.93 | 21d | 1 | 0.10mi |
| 688 Debbie Dr Clarksville, TN | 3.0 | 1.5 | 1036 | $1,395 | $1.35 | 14d | 1 | 0.26mi |
| 686 Debbie Dr Clarksville, TN | 3.0 | 1.0 | 1050 | $1,275 | $1.21 | 21d | 1 | 0.28mi |
| 442 Appleton Dr Clarksville, TN | 3.0 | 1.0 | 1500 | $1,325 | $0.88 | 21d | 1 | 0.33mi |
| 1558 Cherry Tree Dr Clarksville, TN | 3.0 | 1.0 | 1144 | $1,295 | $1.13 | 21d | 1 | 0.44mi |
| 512 Mallory Dr Clarksville, TN | 4.0 | 2.0 | 1300 | $1,575 | $1.21 | 14d | 1 | 0.49mi |
| 816 Garrettsburg Rd Clarksville, TN | 3.0 | 2.0 | 1275 | $1,350 | $1.06 | 14d | 1 | 0.50mi |
| 816 Garrettsburg Rd Clarksville, TN | 3.0 | 2.0 | 1275 | $1,350 | $1.06 | 21d | 1 | 0.50mi |
| 375 S Lancaster Rd Clarksville, TN | 1.0–3.0 | 1.0–2.0 | 1085 | $1,399 | $1.29 | 14d | 16 | 0.55mi |
| 603 Chestnut Ridge Dr Clarksville, TN | 3.0 | 2.0 | 1350 | $1,450 | $1.07 | 21d | 1 | 0.61mi |
| 1718 Thistlewood Dr Clarksville, TN | 3.0 | 2.0 | 1170 | $1,230 | $1.05 | 21d | 1 | 0.65mi |
| 1728 Thistlewood Dr Unit A Clarksville, TN | 3.0 | 2.0 | 1105 | $1,350 | $1.22 | 21d | 1 | 0.68mi |
| 995 S Ash Ridge Dr Unit A Clarksville, TN | 3.0 | 2.0 | 1105 | $1,500 | $1.36 | 21d | 1 | 0.69mi |
| 329 Northridge Dr Clarksville, TN | 3.0 | 2.0 | 1258 | $1,630 | $1.30 | 21d | 1 | 0.71mi |
| 1731 Thistlewood Dr Unit A Clarksville, TN | 3.0 | 2.0 | 1110 | $1,250 | $1.13 | 14d | 1 | 0.71mi |
| 1723 Thistlewood Dr Unit A Clarksville, TN | 3.0 | 2.0 | 1210 | $1,375 | $1.14 | 21d | 1 | 0.72mi |
| 505 Sourwood Dr Clarksville, TN | 4.0 | 2.5 | 1700 | $2,299 | $1.35 | 21d | 1 | 0.74mi |
| 219 Kirby Dr Clarksville, TN | 3.0 | 1.5 | 1425 | $1,495 | $1.05 | 21d | 1 | 0.80mi |
| 731 Inver Ln Clarksville, TN | 3.0 | 1.5 | 1008 | $1,381 | $1.37 | 21d | 1 | 0.84mi |
| 535 Lafayette Rd Unit I2 Clarksville, TN | 3.0 | 1.5 | 1200 | $1,200 | $1.00 | 21d | 1 | 0.87mi |
| 567 Cynthia Dr Clarksville, TN | 3.0 | 1.0 | 1075 | $1,500 | $1.40 | 21d | 1 | 0.90mi |
| 1487 Coronado Dr Clarksville, TN | 3.0 | 2.5 | 1632 | $1,666 | $1.02 | 14d | 1 | 0.92mi |
| 512 Kellia Dr Clarksville, TN | 3.0 | 1.5 | 1196 | $1,350 | $1.13 | 21d | 1 | 0.93mi |
| 512 Kellia Dr Clarksville, TN | 3.0 | 1.5 | 1196 | $1,350 | $1.13 | 14d | 1 | 0.93mi |
| 397 Elaine Dr Clarksville, TN | 4.0 | 2.0 | 1700 | $1,395 | $0.82 | 14d | 1 | 0.94mi |
| 248 Drayton Dr Clarksville, TN | 2.0–3.0 | 1.5–2.5 | 1060 | $1,545 | $1.46 | 14d | 21 | 1.06mi |
| 194 Bob White Dr Clarksville, TN | 3.0 | 1.5 | 1700 | $1,495 | $0.88 | 21d | 1 | 1.07mi |
| 1843 Evans Rd Clarksville, TN | 3.0 | 2.0 | 1216 | $1,195 | $0.98 | 14d | 1 | 1.12mi |
| 621 Dover Rd Clarksville, TN | 3.0 | 1.0 | 1075 | $1,275 | $1.19 | 21d | 1 | 1.12mi |
| 534 Somerset Ln Clarksville, TN | 3.0 | 2.0 | 1500 | $1,770 | $1.18 | 21d | 1 | 1.16mi |
| 125 Mossland Dr Clarksville, TN | 3.0 | 2.5 | 1718 | $1,950 | $1.14 | 14d | 1 | 1.20mi |
| 134 Monarch Ln Clarksville, TN | 3.0 | 1.5 | 940 | $1,300 | $1.38 | 14d | 1 | 1.21mi |
| 629 Wolfchase Dr Clarksville, TN | 3.0 | 2.5 | 1446 | $1,689 | $1.17 | 14d | 1 | 1.23mi |
| 129 Monarch Ln Clarksville, TN | 3.0 | 2.0 | 1120 | $1,381 | $1.23 | 21d | 1 | 1.23mi |
| 153 Monarch Ln Clarksville, TN | 3.0 | 2.0 | 1033 | $1,350 | $1.31 | 21d | 1 | 1.27mi |
| 325 Mills Dr Clarksville, TN | 3.0 | 2.0 | 1100 | $1,800 | $1.64 | 14d | 1 | 1.28mi |
| 476 Woodtrace Dr Clarksville, TN | 3.0 | 2.0 | 1759 | $1,979 | $1.13 | 21d | 1 | 1.29mi |
| 1126 Garrettsburg Rd Clarksville, TN | 3.0 | 2.0 | 1600 | $1,900 | $1.19 | 14d | 1 | 1.33mi |
| 221 Mills Dr Clarksville, TN | 3.0 | 1.5 | 1100 | $1,150 | $1.05 | 14d | 1 | 1.34mi |
| 420 Lafayette Rd Unit A Clarksville, TN | 3.0 | 1.0 | 1100 | $850 | $0.77 | 21d | 1 | 1.36mi |
Listing history 13 events
-
2026-05-22$165,000 Active
-
2015-03-03soldstatus $105,275
-
2015-03-02soldstatus $105,275 Closed 184-char remark
Show marketing remark (184 chars)
Great 4 BR/2 Bath home has been renovated/updated*New carpet*new paint*newer appliances*tile backsplash in kitchen*home & HVAC recently inspected and in good condition*looks great!
-
2015-02-17status Pending 184-char remark
Show marketing remark (184 chars)
Great 4 BR/2 Bath home has been renovated/updated*New carpet*new paint*newer appliances*tile backsplash in kitchen*home & HVAC recently inspected and in good condition*looks great!
-
2015-01-21historical Contingent - Financing 184-char remark
Show marketing remark (184 chars)
Great 4 BR/2 Bath home has been renovated/updated*New carpet*new paint*newer appliances*tile backsplash in kitchen*home & HVAC recently inspected and in good condition*looks great!
-
2015-01-18historical 184-char remark
Show marketing remark (184 chars)
Great 4 BR/2 Bath home has been renovated/updated*New carpet*new paint*newer appliances*tile backsplash in kitchen*home & HVAC recently inspected and in good condition*looks great!
-
2015-01-08price $103,500 184-char remark
Show marketing remark (184 chars)
Great 4 BR/2 Bath home has been renovated/updated*New carpet*new paint*newer appliances*tile backsplash in kitchen*home & HVAC recently inspected and in good condition*looks great!
-
2015-01-06$107,900 Active 184-char remark
Show marketing remark (184 chars)
Great 4 BR/2 Bath home has been renovated/updated*New carpet*new paint*newer appliances*tile backsplash in kitchen*home & HVAC recently inspected and in good condition*looks great!
-
2014-09-29$107,900 258-char remark
Show marketing remark (258 chars)
Great 4 BR/2 Bath home has been renovated/updated*New carpet*new paint*newer appliances*tile backsplash in kitchen*home & HVAC recently inspected and in good condition*looks great! SLR will put up 6'wood privacy fence on back to give privacy behind home
-
2014-09-03soldstatus $73,500
-
2012-04-03soldstatus $68,000
-
2012-03-01historical
-
2011-11-04$66,900
ⓘ Source: listings_history table (triggers on properties + properties_extension) + one-shot
backfill from property_details.listing_events for pre-trigger history.
Tax reassessment forecast TN · Resets to sale price
- Current annual tax
- $1,555 · $130/mo
- Projected year-2 tax
- $1,555 · $130/mo
- Expected delta
- $0/yr ($0/mo · -0.0%)
ⓘ Screening estimate from a state-policy table — verify with the county assessor before closing.
Climate risk First Street
- Flood 1/10 Low FEMA zone X (unshaded) · 0% chance over 30 yrs
- Wildfire 3/10 Moderate
- Heat 5/10 Major 7 d/yr ≥107°F today · 21 d/yr by 30 yrs out
- Wind 4/10 Moderate 9% chance of damaging wind over 30 yrs
- Air quality 2/10 Low 1 unhealthy d/yr today · 1 by 30 yrs out
Nearby sold comps map
Loading sold comps map…
Walkable amenities ~0.75 mi
Loading nearby amenities…
Taxation est. · year 1
- Rental income
- $18,886
- − Mortgage interest
- −$9,243
- − Property taxes
- −$1,555
- − Insurance
- −$825
- − Repairs & maintenance
- −$1,511
- − Management
- −$1,511
- − Depreciation
- −$4,800
- Taxable loss
- −$559
- Est. tax savings @ 24.0%
- +$134
- After-tax cash flow
- $2,290/yr
For passive investors: Depreciation is non-cash, so a rental often shows a tax loss while cash-flowing — sheltering income. Rental losses are passive: they offset passive income freely, and up to $25,000/yr can offset ordinary (W-2) income if you actively participate and your MAGI is under $100k (phasing out to $0 by $150k); unused losses carry forward. On sale, claimed depreciation is recaptured at up to 25%, and gains may owe capital-gains tax (a 1031 exchange can defer both). Figures are a year-1 estimate at your 24.0% rate — not tax advice; consult a CPA.
Schools (NCES district)
- District
- Montgomery County
- NCES district ID
- 4703030
- Math proficiency
- 25% ▼ -20.00%
- Reading proficiency
- 31% ▼ -10.00%
- Median HH income
- $50,423
- Composite
- 24.56/100
- National rank
- #7641
- State rank
- #65 of 139 in TN
Livability — Clarksville
- Score
- 84/100
- State rank
- #1
- US rank
- #798
Category grades
Schools grade is shown separately in the Schools card above.
Census & demographics
- Census place
- Clarksville, TN
- County
- Montgomery County · 211,371 people
- City population
- 211,371
- Metro
- Clarksville, TN-KY
- Population (ZIP)
- 87,652
- Household income
- $70,393
- Rent vs Own
- Severe rent burden
- 2093.0
Population outlook (Montgomery County) Hauer SSP2
- Today (2025)
- 236,633 people
- By 2030
- 258,978 · +9.4%
- By 2040
- 305,456 · +29.1%
- By 2050
- 353,147 · +49.2%
- By 2075
- 471,289 · +99.2%
- By 2100
- 564,122 · +138.4%
Race, ethnicity, and origin ACS 2023
- Neighborhood character
- Diverse neighborhood (Simpson 0.68)
- Race & ethnicity
- White 48% Black 26% Hispanic / Latino 15% Two or more races 13% Asian 3%
- Hispanic origin (detail)
- Mexican 6% Puerto Rican 4%
- Common ancestry
- Italian 4% Slovak 1% Lithuanian 1%
- Foreign-born
- 8% · Canada, South Korea, China
- Languages at home
- 88% English-only · Spanish 8% German/W. Germanic 1% Other Indo-European 1%
Political lean MEDSL · Montgomery
- 2024 margin
- R (+18.4) · D 40.0% · R 58.5% · Other 1.5%
- 2008→2024 swing
- -10.5pp toward R · 2008: -7.9pp · 2024: -18.4pp
- All cycles
- 2024: R+18.4 2020: R+12.7 2016: R+18.6 2012: R+10.5 2008: R+7.9
Not yet ingested
- Civics
- —
Market trends
- HPI YoY
- ▼ -58.81%
- Current HPI
- 264.4911
- Rent YoY
- ▲ 1.27%
- Metro
- Clarksville, TN-KY
- State GDP YoY
- ▲ 2.78%
- F500 in state
- 22
Industry mix (Fortune 500 HQ in TN)
| Industry | F500 HQs | Revenue |
|---|---|---|
| Healthcare | 3 | $91B |
|
||
| Retail | 3 | $72B |
|
||
| Transportation / Logistics | 1 | $88B |
|
||
| Paper / Packaging | 1 | $19B |
|
||
| Insurance | 1 | $13B |
|
||
| Energy | 1 | $12B |
|
||
Price history
+146.6% since first listed13 events — show timeline
- 2026-05-22 Listed $165,000 REALTRACS as Distributed by MLS Grid
- 2015-03-03 Sold (Public Records) $105,275 Public Records
- 2015-03-02 Sold (MLS) $105,275 REALTRACS as Distributed by MLS Grid
- 2015-02-17 Pending — REALTRACS as Distributed by MLS Grid
- 2015-01-21 Contingent — REALTRACS as Distributed by MLS Grid
- 2015-01-18 Listing Removed — REALTRACS as Distributed by MLS Grid
- 2015-01-08 Price Changed $103,500 REALTRACS as Distributed by MLS Grid
- 2015-01-06 Listed $107,900 REALTRACS as Distributed by MLS Grid
- 2014-09-29 Listed $107,900 REALTRACS as Distributed by MLS Grid
- 2014-09-03 Sold (Public Records) $73,500 Public Records
- 2012-04-03 Sold (MLS) $68,000 REALTRACS as Distributed by MLS Grid
- 2012-03-01 Listing Removed — REALTRACS as Distributed by MLS Grid
- 2011-11-04 Listed $66,900 REALTRACS as Distributed by MLS Grid
Property tax history
+6.7%/yrLatest (2025): $1,555 · +1.4% YoY. Source: county tax records.
Cash-flow waterfall
monthlySold comps — $/sqft
last 12 mo · ≤1 miLoading sold comps…