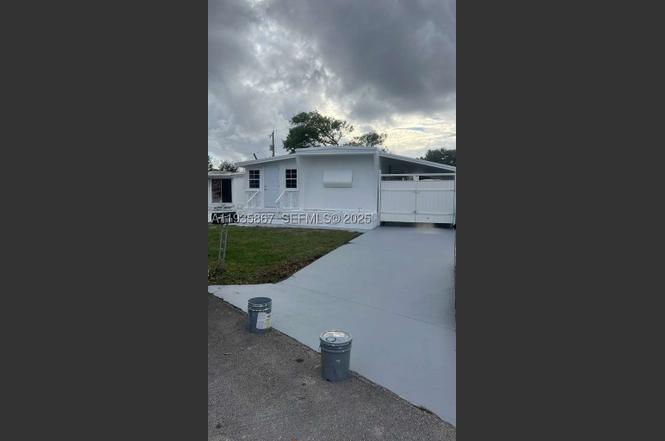
1911 SW 87th Ave · Davie, FL
Flood risk 1/10 · Minimal
- FEMA flood zone
- X (shaded)
- Chance of flooding over 30 yrs
- 0.0%
- Est. flood insurance / yr
- $507 – $1,088
Fire risk 1/10 · Minimal
- Est. fire insurance / yr
- $947 – $1,759
Heat risk 10/10 · Severe
- Hot days now (above 105°F)
- 7 days/yr
- Hot days in 30 yrs
- 26 days/yr
Wind risk 10/10 · Severe
- Chance of severe wind over 30 yrs
- 99.0%
Air-quality risk 3/10 · Minor
- Unhealthy air days now
- 2 days/yr
- Unhealthy air days in 30 yrs
- 3 days/yr
Risk factors via First Street. Map © Google.
Why this score? — see what drove the D+ grade
The composite is a weighted blend of 9 inputs, each scored 0–100. Each bar is that input's sub-score; the figure is the points it added to the 100-point composite (weight × sub-score).
- Cash flow +22.2/30.0
- DSCR +7.1/10.0
- 1% rule +6.5/10.0
- Schools +4.1/10.0
- Livability +4.1/5.0
- Rent growth +2.8/5.0
- Condition / age +2.5/5.0
- ARV discount +0.0/15.0
- Appreciation +0.0/10.0
$189,900
🖨 Deal sheet (PDF) 📄 Offer letter ✓ Due diligence
Listing remarks
Price Reduced!! Discover a well-maintained, fully furnished residence in the desirable 55+ Park City Estates, offering the rare advantage of fee-simple land ownership. This turnkey, 2-bedroom, 2.5-bath home could be easily turned to a 3 bedrooms, it has been tastefully updated with new bathrooms and elegant porcelain flooring, making it ideal for immediate use or investment. The home features a spacious tiled Florida room, perfect for year-round enjoyment, along with a covered carport, in-unit washer and dryer, and private storage shed. Low-maintenance living is enhanced by close proximity to the clubhouse and community pool. Centrally located near beaches, major highways, shopping, medical
Key facts
- Covered carport
- Private storage shed
- Tiled florida room
Tags
Property features AI
Finance
- Other: Pets allowed with restrictions
- HOA & community: Monthly association fee of $119; Senior community; Community pool
Exterior
- Parking: Covered parking; 2-car garage
- Utilities: Public sewer
- Home design: Single-story; Faces northeast; Updated/remodeled; Manufactured home
- Construction: Block construction; Manufactured construction; Bahama roof; Resale
- Exterior features: Awning(s); Barbecue; Community pool
Interior
- Kitchen: Microwave
- Flooring: Ceramic tile; Laminate
- Bathrooms: 2 full bathrooms; 1 half bathroom
- Heating & cooling: Central heating; Central air conditioning; Ceiling fans
- Interior features: Furnished; First floor entry; Den
Neighborhood map
What this means for you Summary
Snapshot
- This is a 2-bed/2.0-bath manufactured listed at $190k.
Deal economics
- At list price, monthly cash flow is $310 ($4k/yr) — positive.
- The deal already cash-flows at list — no discount required.
- Meets the 1% rule at list price ($2k rent vs $190k).
- Recommended offer: $167k (12.0% below list) — sets the bar for market timing.
- Cap rate 8.2% vs local median 3.4% in Davie — top-decile yield for the area; either an underpriced asset or a hidden risk that comps aren't pricing in. Stress-test before assuming the spread holds.
Location & tenants
- Location reads 82/100 on livability (#68 in FL, #1,159 nationally) — a professional / high-income tenant draw. Strengths: schools A+, crime A+, housing A+; Watch: cost of living D, amenities D-.
- Broward (suburban): math 42% / reading 53% proficiency, ranked #46 of 73 in FL (top 63%) — families likely to look elsewhere, expect single-tenant / working-renter base with shorter leases.
- Market conditions: Rents rising (+1.2%/yr); 408 active listings in the ZIP; 40 comparable units currently listed for rent nearby; rentals at typical pace (median 16d on market — plan ~3-4 weeks tenant-placement turnaround); solid renter incomes; 2,111 units permitted in Broward County in 2024 (1,265 in 5+ unit buildings).
- This rent runs 31% of the median local income ($85k/yr) — at the standard rent-burdened threshold; future hikes will face affordability resistance.
Forward outlook
- Local home prices are declining (-3.0%/yr); year-one equity from $1k of loan paydown is wiped out by about $6k of value loss. Plan a longer hold.
- Broward County population projected at +34% by 2050 — long-run rental-demand tailwind backs the buy-and-hold thesis.
Negotiation context
- It's been on market 175 days — a 12% lower offer ($167k) is reasonable based on typical stale-listing flexibility.
- 2 sale attempts since 8y ago; this cycle's ask has dropped $50k (21%) from the opening price — seller is motivated, your offer sets the floor, not the list.
- Current owner paid $135k; 41% above their basis — modest negotiation headroom, anchor on the comps not their cost.
Risks & watch-outs
- Climate carrying-cost: severe wind risk, 99% chance of damaging wind over 30y; extreme-heat days projected 7→26/yr by 2055 (HVAC capex compounding) — expect insurance premiums to compound above CPI over the hold.
Questions for the listing agent
- It's been on market 175 days. Have you received any prior offers? Is the seller open to a 12% concession, seller financing, or rate buy-down credit?
- Built in 1964 — when were the roof, HVAC, electrical panel, plumbing, and water heater last replaced?
- What does the HOA fee cover, when was the last increase, and are there any pending special assessments or reserve-fund shortfalls?
- Why hasn't it sold? Are there any deal-killer items the seller is aware of (foundation, flood, title, zoning, code violations)?
- Is there a deadline driving the sale (1031 exchange, divorce, estate, relocation)? That informs how much negotiation room exists.
- Schools are A-rated — typically a magnet for longer-tenancy family renters. What's the average tenant stay here, and is there a school-zone premium baked into asking?
- The area grade is low — what's the realistic commute time and amenity access for the typical tenant pool here? Any planned neighborhood developments (good or bad) we should know about?
- What's the average days-on-market for RENTAL listings here right now (not sales)? A rising rental-DOM trend means longer vacancies and softer asking-rent achievability than the comps imply.
- What's the recent tenant-quality profile in this submarket — average credit score on applications, eviction rate, late-payment / NSF rate, and stable-employment percentage? A property-management company in the area should have these aggregated.
- How much new for-sale + rental construction is in the pipeline within 1–3 miles? Heavy new supply typically softens prices + rents 12–24 months out; constrained supply supports both.
Investment metrics
- 1% rule
- 1.15% ✓
- Cap rate
- 8.25%
- Cash-on-cash
- 6.99%
- DSCR
- 1.31
- GRM
- 7.3
CMA / ARV
- ARV (on-the-fly)
- $145,524
- Comps found
- 4
Show comp detail 4 sales within ~0.75 mi
| Address | Dist | Beds/Ba | Sqft | Sold | Price | $/sf | Match |
|---|---|---|---|---|---|---|---|
| 8500 SW 21st St | 0.25mi | 2/1.5 | 799 (-1%) | 3mo | $165,000 | $207 | 83 |
| 2041 SW 83rd Ave | 0.32mi | 2/2.0 | 885 (+10%) | 3mo | $160,000 | $181 | 66 |
| 1860 SW 83rd Ter | 0.28mi | 2/1.0 | 698 (-13%) | 2mo | $90,000 | $129 | 59 |
| 8620 SW 22nd St | 0.26mi | 3/2.0 (+1) | 922 (+15%) | 1mo | $130,000 | $141 | 58 |
Match score weights: distance 35% · size 25% · config 20% · recency 20%. Top-matched comps best support the ARV.
Projected returns pro-forma
-3.0% appreciation · 1.23% rent growth · sell at horizon
- IRR
- -7.7%
- Equity multiple
- 0.72×
- Total profit
- $-14,771
- Equity at exit
- $28,315
- IRR
- -0.7%
- Equity multiple
- 0.96×
- Total profit
- $-2,195
- Equity at exit
- $16,419
Cash invested: $53,172 (down + closing). Projections, not guarantees.
Landlord ↔ Tenant lean methodology
- Overall (STATE)
- 87 Strongly Landlord-Friendly
- State Florida
- 87 Strongly Landlord-Friendly · R+3
- County
- — inherits STATE
- City
- — inherits STATE
ZIP-level market 33324
- Home prices YoY
- -33.5%
- Rents YoY
- 1.2%
- Active inventory
- 408
- Price-to-rent
- 7.3×
Monthly cashflow live
- Estimated rent
- $2,181 high interval (Pro) →
- Mortgage (P&I)
- −$996
- Tax from tax record
- −$219 /mo · $2,632/yr
- Insurance
- −$79
- HOA
- −$119
- Vacancy / Maint / Mgmt
- −$458
- Net cashflow
- $310
Break-even live
Sensitivity live
| Price | -10% $417 | -5% $363 | +0% $310 | +5% $256 | +10% $202 |
|---|---|---|---|---|---|
| Rent | -10% $137 | -5% $224 | +0% $310 | +5% $396 | +10% $482 |
| Rate | -1.0pp $405 | -0.5pp $358 | base $310 | +0.5pp $260 | +1.0pp $210 |
UW: 25.0% down · 7.5% · 30yr · 1.5% tax · 5.0% vac · 8.0% maint · 8.0% mgmt
Financing live
Cash to close
- Down payment
- $47,475
- Closing costs
- $5,697
- Reserves months
- —
- Total cash needed
- —
Loan-product check · same deal, 3 products live
Conventional
25% down · 7.5% · 30yr
- Down + closing
- —
- Monthly P&I
- —
- Monthly cashflow
- —
- DSCR
- —
- Eligible?
- —
Personal DTI + credit; lowest rate.
DSCR
20% down · 8.5% · 30yr
- Down + closing
- —
- Monthly P&I
- —
- Monthly cashflow
- —
- DSCR
- —
- Eligible?
- —
No personal income docs; deal must DSCR.
Hard money
10% down · 12.0% · 12mo
- Down + closing
- —
- Monthly P&I
- —
- Monthly cashflow
- —
- DSCR
- —
- Eligible?
- —
Short-term bridge; refi at stabilization.
Rent comps 40 comps
| Address | Beds | Baths | Sqft | Rent | $/sqft | DOM | Units | Dist |
|---|---|---|---|---|---|---|---|---|
| 8717 SW 16th Pl Davie, FL | 1.0 | 1.0 | 600 | $1,300 | $2.17 | 4d | 1 | 0.30mi |
| 8717 SW 16th Pl Davie, FL | 1.0 | 1.0 | 600 | $1,500 | $2.50 | 23d | 1 | 0.30mi |
| 8508 SW 16th Ct Davie, FL | 3.0 | 2.0 | 613 | $1,700 | $2.77 | 14d | 1 | 0.31mi |
| 1680 SW 84th Ave Davie, FL | 2.0 | 2.0 | 798 | $2,100 | $2.63 | 5d | 1 | 0.34mi |
| 8709 SW 15th St Unit na Davie, FL | 2.0 | 2.0 | 998 | $2,050 | $2.05 | 16d | 1 | 0.36mi |
| 8709 SW 15th St Unit na Davie, FL | 2.0 | 2.0 | 998 | $2,050 | $2.05 | 0d | 1 | 0.36mi |
| 9230 Lagoon Pl #411 Davie, FL | 2.0 | 2.0 | 970 | $1,950 | $2.01 | 8d | 1 | 0.43mi |
| 9230 Lagoon Pl #411 Davie, FL | 2.0 | 2.0 | 970 | $1,950 | $2.01 | 25d | 1 | 0.43mi |
| 9235 Lagoon Pl #402 Davie, FL | 2.0 | 2.0 | 1100 | $2,050 | $1.86 | 6d | 1 | 0.43mi |
| 9235 Lagoon Pl #402 Davie, FL | 2.0 | 2.0 | 1100 | $2,050 | $1.86 | 17d | 1 | 0.43mi |
| 9420 Poinciana Pl #409 Davie, FL | 2.0 | 2.0 | 970 | $1,890 | $1.95 | 3d | 1 | 0.45mi |
| 2075 SW 82nd Ave #2075 Davie, FL | 2.0 | 2.0 | 907 | $3,200 | $3.53 | 5d | 1 | 0.50mi |
| 9410 Poinciana Pl #206 Davie, FL | 2.0 | 2.0 | 1100 | $2,100 | $1.91 | 25d | 1 | 0.51mi |
| 9340 Lagoon Pl Davie, FL | 1.0–2.0 | 1.5–2.0 | 955 | $2,200 | $2.30 | 8d | 2 | 0.53mi |
| 9480 Poinciana Pl #407 Davie, FL | 2.0 | 2.0 | 1100 | $2,100 | $1.91 | 4d | 1 | 0.53mi |
| 9480 Poinciana Pl #407 Davie, FL | 2.0 | 2.0 | 1100 | $2,100 | $1.91 | 25d | 1 | 0.53mi |
| 9440 Poinciana Pl Davie, FL | 1.0–2.0 | 1.0–2.0 | 985 | $2,220 | $2.25 | 25d | 2 | 0.56mi |
| 9440 Poinciana Pl #404 Davie, FL | 2.0 | 2.0 | 1100 | $2,220 | $2.02 | 15d | 1 | 0.57mi |
| 9460 Tangerine Pl Davie, FL | 3.0 | 2.0 | 1100 | $3,000 | $2.73 | 25d | 1 | 0.58mi |
| 9460 Tangerine Pl Davie, FL | 2.0–3.0 | 2.0 | 935 | $2,080 | $2.22 | 4d | 2 | 0.58mi |
| 9460 Tangerine Pl Davie, FL | 2.0–3.0 | 2.0 | 935 | $2,100 | $2.25 | 23d | 2 | 0.58mi |
| 9460 Tangerine Pl Davie, FL | 1.0–3.0 | 1.0–2.0 | 865 | $2,400 | $2.77 | 4d | 3 | 0.58mi |
| 1920 Sabal Palm Dr #104 Davie, FL | 2.0 | 2.0 | 976 | $2,149 | $2.20 | 19d | 1 | 0.58mi |
| 9480 Tangerine Pl #404 Davie, FL | 2.0 | 2.0 | 1000 | $2,390 | $2.39 | 0d | 1 | 0.60mi |
| 9480 Tangerine Pl #404 Davie, FL | 2.0 | 2.0 | 1000 | $2,390 | $2.39 | 19d | 1 | 0.60mi |
| 9470 Poinciana Pl #303 Davie, FL | 2.0 | 2.0 | 970 | $2,050 | $2.11 | 25d | 1 | 0.61mi |
| 1244 S Pine Island Rd Plantation, FL | 1.0–3.0 | 1.0–2.0 | 1057 | $2,598 | $2.46 | 0d | 37 | 0.63mi |
| 9440 Tangerine Pl Davie, FL | 1.0 | 1.0 | 850 | $1,900 | $2.24 | 6d | 2 | 0.63mi |
| 9440 Tangerine Pl Davie, FL | 1.0 | 1.0 | 850 | $1,925 | $2.26 | 25d | 2 | 0.63mi |
| 1811 Sabal Palm Dr Davie, FL | 2.0–3.0 | 2.0 | 1073 | $2,200 | $2.05 | 5d | 1 | 0.64mi |
| 8210 Peters Rd Plantation, FL | 1.0 | 1.0 | 870 | $1,970 | $2.26 | 19d | 1 | 0.65mi |
| 8141 SW 24th Ct #106 Davie, FL | 2.0 | 2.0 | 949 | $1,900 | $2.00 | 16d | 1 | 0.66mi |
| 8141 SW 24th Ct #106 Davie, FL | 2.0 | 2.0 | 949 | $1,900 | $2.00 | 15d | 1 | 0.66mi |
| 1831 Sabal Palm Dr Davie, FL | 2.0–3.0 | 2.0 | 1139 | $2,150 | $1.89 | 19d | 2 | 0.66mi |
| 2461 SW 82nd Ave #103 Davie, FL | 2.0 | 2.0 | 871 | $1,900 | $2.18 | 25d | 1 | 0.66mi |
| 9420 Tangerine Pl Davie, FL | 2.0 | 2.0 | 1100 | $2,700 | $2.45 | 4d | 2 | 0.69mi |
| 9420 Tangerine Pl Davie, FL | 2.0 | 2.0 | 1100 | $2,700 | $2.45 | 15d | 2 | 0.69mi |
| 8101 SW 24th Ct Davie, FL | 2.0 | 2.0 | 985 | $2,250 | $2.28 | 19d | 3 | 0.69mi |
| 8101 SW 24th Ct Davie, FL | 1.0–2.0 | 1.5–2.0 | 881 | $2,300 | $2.61 | 16d | 4 | 0.69mi |
| 8210 SW 12th St Plantation, FL | 1.0–3.0 | 1.0–2.0 | 1071 | $2,434 | $2.27 | 3d | 18 | 0.70mi |
HOA detail
- Monthly dues
- $119 · $1,428/yr
- Likely covers
- pool
Listing history 21 events
-
2026-06-21days on market $189,900 Active 175 DOM
-
2026-06-18days on market $189,900 Active 172 DOM
-
2026-06-17days on market $189,900 Active 171 DOM
-
2026-06-16days on market $189,900 Active 170 DOM
-
2026-06-15days on market $189,900 Active 169 DOM
-
2026-06-13days on market $189,900 Active 167 DOM
-
2026-06-09days on market $189,900 Active 163 DOM
-
2026-06-07days on market $189,900 Active 161 DOM
-
2026-06-04days on market $189,900 Active 158 DOM
-
2026-06-03days on market $189,900 Active 157 DOM
-
2026-06-02days on market $189,900 Active 156 DOM
-
2026-06-01days on market $189,900 Active 155 DOM
-
2026-05-31days on market $189,900 Active 154 DOM
-
2026-04-20price $220,900
-
2026-01-13price $224,900
-
2025-12-28$239,900 Active
-
2025-07-17soldstatus $135,000
-
2019-12-10historical Hold
-
2018-12-17$99,000 Active
-
2013-04-01soldstatus $45,000
-
1993-04-09soldstatus $40,000
ⓘ Source: listings_history table (triggers on properties + properties_extension) + one-shot
backfill from property_details.listing_events for pre-trigger history.
Tax reassessment forecast FL · Resets to sale price
- Current annual tax
- $2,632 · $219/mo
- Projected year-2 tax
- $2,632 · $219/mo
- Expected delta
- $0/yr ($0/mo · 0.0%)
ⓘ Screening estimate from a state-policy table — verify with the county assessor before closing.
Climate risk First Street
- Flood 1/10 Low FEMA zone X (shaded) · 0% chance over 30 yrs
- Wildfire 1/10 Low
- Heat 10/10 Extreme 7 d/yr ≥105°F today · 26 d/yr by 30 yrs out
- Wind 10/10 Extreme 99% chance of damaging wind over 30 yrs
- Air quality 3/10 Moderate 2 unhealthy d/yr today · 3 by 30 yrs out
Nearby sold comps map
Loading sold comps map…
Walkable amenities ~0.75 mi
Loading nearby amenities…
Taxation est. · year 1
- Rental income
- $26,171
- − Mortgage interest
- −$10,637
- − Property taxes
- −$2,632
- − Insurance
- −$950
- − Repairs & maintenance
- −$2,094
- − Management
- −$2,094
- − HOA
- −$1,428
- − Depreciation
- −$5,524
- Taxable income
- $813
- Est. tax owed @ 24.0%
- −$195
- After-tax cash flow
- $3,521/yr
For passive investors: Depreciation is non-cash, so a rental often shows a tax loss while cash-flowing — sheltering income. Rental losses are passive: they offset passive income freely, and up to $25,000/yr can offset ordinary (W-2) income if you actively participate and your MAGI is under $100k (phasing out to $0 by $150k); unused losses carry forward. On sale, claimed depreciation is recaptured at up to 25%, and gains may owe capital-gains tax (a 1031 exchange can defer both). Figures are a year-1 estimate at your 24.0% rate — not tax advice; consult a CPA.
Schools (NCES district)
- District
- Broward
- NCES district ID
- 1200180
- Math proficiency
- 42% ▼ -18.00%
- Reading proficiency
- 53% ▼ -5.00%
- Median HH income
- $52,139
- Composite
- 40.88/100
- National rank
- #3621
- State rank
- #46 of 73 in FL
Livability — Davie
- Score
- 82/100
- State rank
- #68
- US rank
- #1159
Category grades
Schools grade is shown separately in the Schools card above.
Census & demographics
- Census place
- Davie, FL
- County
- Broward County · 1,963,430 people
- City population
- 92,317
- Metro
- Miami-Fort Lauderdale-Pompano Beach, FL
- Population (ZIP)
- 50,151
- Household income
- $85,000
- Rent vs Own
- Severe rent burden
- 2923.0
Population outlook (Broward County) Hauer SSP2
- Today (2025)
- 2,207,033 people
- By 2030
- 2,360,704 · +7.0%
- By 2040
- 2,661,208 · +20.6%
- By 2050
- 2,946,698 · +33.5%
- By 2075
- 3,602,273 · +63.2%
- By 2100
- 3,970,984 · +79.9%
Race, ethnicity, and origin ACS 2023
- Neighborhood character
- Diverse neighborhood (Simpson 0.69)
- Race & ethnicity
- White 42% Hispanic / Latino 31% Two or more races 20% Black 16% Asian 6%
- Hispanic origin (detail)
- Mexican 2% Puerto Rican 5% Cuban 4% Dominican 2%
- Common ancestry
- Romanian 3% Italian 3% Hispanic 3%
- Foreign-born
- 31% · Canada, Jamaica, China
- Languages at home
- 60% English-only · Spanish 26% Other Indo-European 4% French/Haitian/Cajun 3%
Political lean MEDSL · Broward
- 2024 margin
- D (+17.0) · D 58.0% · R 41.0%
- 2008→2024 swing
- -17.8pp toward R · 2008: 34.7pp · 2024: 17.0pp
- All cycles
- 2024: D+17.0 2020: D+29.8 2016: D+35.0 2012: D+34.9 2008: D+34.7
Not yet ingested
- Civics
- —
Market trends
- HPI YoY
- ▼ -160.16%
- Current HPI
- 317.8685
- Rent YoY
- ▲ 1.23%
- Metro
- Miami-Fort Lauderdale-Pompano Beach, FL
- State GDP YoY
- ▲ 3.28%
- F500 in state
- 36
Industry mix (Fortune 500 HQ in FL)
| Industry | F500 HQs | Revenue |
|---|---|---|
| Industrial Technology | 2 | $29B |
|
||
| Insurance | 2 | $17B |
|
||
| Retail | 1 | $60B |
|
||
| Technology Distribution | 1 | $58B |
|
||
| Homebuilding | 1 | $35B |
|
||
| Technology Manufacturing | 1 | $35B |
|
||
Price history
+452.2% since first listed8 events — show timeline
- 2026-04-20 Price Changed $220,900 MARMLS
- 2026-01-13 Price Changed $224,900 MARMLS
- 2025-12-28 Listed $239,900 MARMLS
- 2025-07-17 Sold (Public Records) $135,000 Public Records
- 2019-12-10 Delisted — MARMLS
- 2018-12-17 Listed $99,000 MARMLS
- 2013-04-01 Sold (Public Records) $45,000 Public Records
- 1993-04-09 Sold (Public Records) $40,000 Public Records
Property tax history
+16.6%/yrLatest (2025): $2,632 · +10.3% YoY. Source: county tax records.
Cash-flow waterfall
monthlySold comps — $/sqft
last 12 mo · ≤1 miLoading sold comps…