 Fourplex
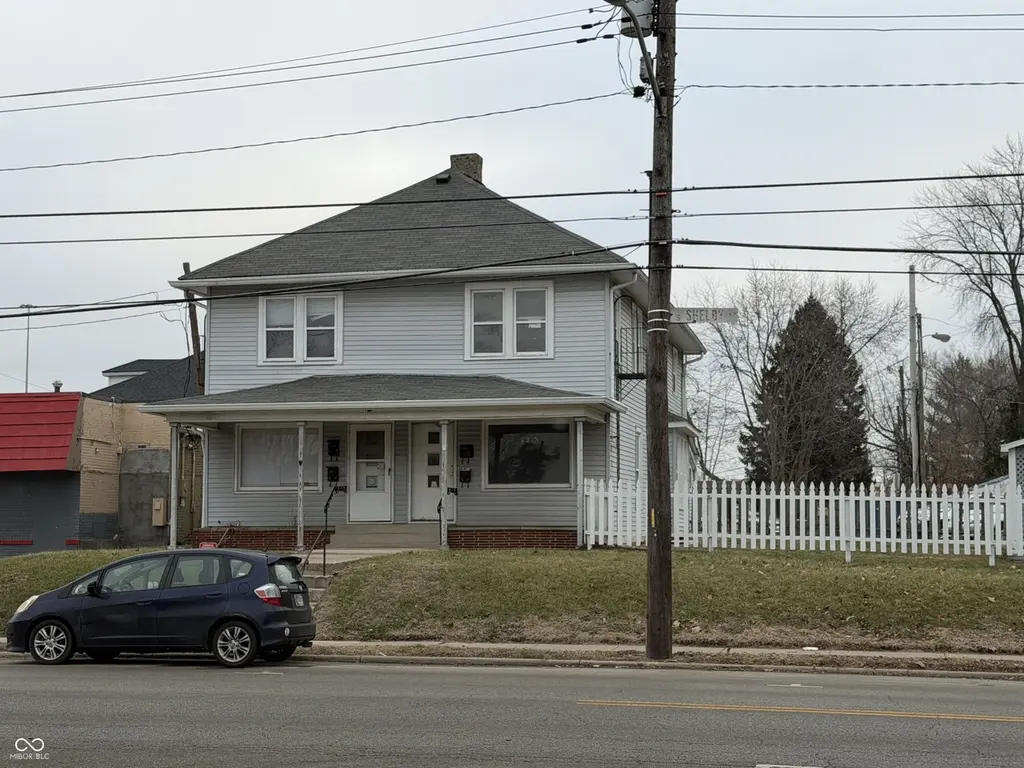
2311 Shelby St · Indianapolis city (balance), IN
Flood risk No data
- FEMA flood zone
- —
- Chance of flooding over 30 yrs
- —
- Est. flood insurance / yr
- —
Fire risk No data
- Est. fire insurance / yr
- —
Heat risk No data
- Hot days now (above threshold)
- —
- Hot days in 30 yrs
- —
Wind risk No data
- Chance of severe wind over 30 yrs
- —
Air-quality risk No data
- Unhealthy air days now
- —
- Unhealthy air days in 30 yrs
- —
Risk factors via First Street. Map © Google.
Why this score? — see what drove the B- grade
The composite is a weighted blend of 9 inputs, each scored 0–100. Each bar is that input's sub-score; the figure is the points it added to the 100-point composite (weight × sub-score).
- Cash flow +30.0/30.0
- DSCR +10.0/10.0
- 1% rule +9.5/10.0
- ARV discount +7.5/15.0
- Rent growth +3.2/5.0
- Livability +2.5/5.0
- Condition / age +2.5/5.0
- Schools +1.4/10.0
- Appreciation +0.0/10.0
$375,000
🖨 Deal sheet (PDF) 📄 Offer letter ✓ Due diligence
Multi-family units
County records classify this as Multi-Family (2-4 Unit). Listing-text estimate: 4 units. confirmed
Listing remarks MLS
This quadruplex has 2 units on each floor and is conveniently located near Fountain Square and just minutes from downtown Indy. The building has 4 paved parking spots (rear of building) with additional street parking (front of building). Tenants currently have month to month leases and rent includes water/heat. Owner is selling 2 parcels together and does not want to separate. Please see MIBOR website for listing ID's #22078961 & #22078931.
Key facts
- 5,250 sq ft lot
- Built 1920
- Listed 164 days
Tags
Neighborhood map
What this means for you Summary
Snapshot
- This is a 4 × 3-bed/4.0-bath units multifamily listed at $375k.
Deal economics
- At list price, monthly cash flow is $2k ($20k/yr) — positive. Per door: $424/mo.
- The deal already cash-flows at list — no discount required.
- Meets the 1% rule at list price ($5k rent vs $375k).
- Recommended offer: $330k (12.0% below list) — sets the bar for market timing.
- Cap rate 11.7% vs local median 4.4% in Indianapolis city (balance) — top-decile yield for the area; either an underpriced asset or a hidden risk that comps aren't pricing in. Stress-test before assuming the spread holds.
Location & tenants
- Location reads: area grade B — affects rentability + tenant quality, not the cash-flow math above.
- Indianapolis Public Schools (urban): math 14% / reading 20% proficiency, ranked #286 of 301 in IN (top 95%) — low school quality limits family demand, transient renter base, plan for 1-2y turnover; 77% free/reduced lunch — lower-income household profile, screen leases tightly.
- Zoned schools: Frederick Douglass School 19 (math 9% / reading 13%, grade F, #909 of 994 statewide, top 92%, 444 students, 81% FRL); H L Harshman Middle School (math 3% / reading 16%, grade F, #316 of 330 statewide, top 96%, 549 students, 84% FRL).
- Market conditions: Rents rising (+2.9%/yr); 500 active listings in the ZIP; 1,906 units permitted in Marion County in 2024 (621 in 5+ unit buildings).
- At $5,428/mo this rent would consume 113% of the median local household income ($57k/yr) (locally 1499% of renters already pay >50% of income on rent) — very limited rent-growth headroom before tenants either downsize or default.
Forward outlook
- Local home prices are declining (-3.0%/yr); year-one equity from $3k of loan paydown is wiped out by about $11k of value loss. Plan a longer hold.
- Marion County population projected at +18% by 2050 — long-run rental-demand tailwind backs the buy-and-hold thesis.
- At projected returns (-3.0% appreciation + 2.9% rent growth), your $105k cash investment doubles in ~7 years — after that, you're playing with house money.
Negotiation context
- It's been on market 165 days — a 12% lower offer ($330k) is reasonable based on typical stale-listing flexibility.
- 3 sale attempts since 6y ago with the ask held roughly flat each time — persistent listings suggest the price (not the market) is what's stuck; bring a comps-based counter.
Risks & watch-outs
- Watch-outs: built in 1920 — expect roof / HVAC / electrical / plumbing capex.
Questions for the listing agent
- It's been on market 165 days. Have you received any prior offers? Is the seller open to a 12% concession, seller financing, or rate buy-down credit?
- Can we see the unit-by-unit rent roll, current vacancy, and any below-market leases? What's the average tenancy length?
- What capital expenditures (roof, boiler, parking lot, exteriors) have been made in the last 5 years, and what's planned in the next 2?
- Built in 1920 — when were the roof, HVAC, electrical panel, plumbing, and water heater last replaced?
- Why hasn't it sold? Are there any deal-killer items the seller is aware of (foundation, flood, title, zoning, code violations)?
- Is there a deadline driving the sale (1031 exchange, divorce, estate, relocation)? That informs how much negotiation room exists.
- What's the average days-on-market for RENTAL listings here right now (not sales)? A rising rental-DOM trend means longer vacancies and softer asking-rent achievability than the comps imply.
- What's the recent tenant-quality profile in this submarket — average credit score on applications, eviction rate, late-payment / NSF rate, and stable-employment percentage? A property-management company in the area should have these aggregated.
- How much new apartment / multifamily construction is in the pipeline within 1–3 miles? Heavy new supply (>2% of stock underway) typically softens rents 12–24 months out; light construction supports rent growth.
Investment metrics
- 1% rule
- 1.45% ✓
- Cap rate
- 11.72%
- Cash-on-cash
- 19.39%
- DSCR
- 1.86
- GRM
- 5.8
CMA / ARV
- ARV (median comp)
- $176,087
- List price
- $375,000
- Delta
- 112.96%
- Verdict
- OVERPRICED
- Comps
- 20 within 1.0 mi
Projected returns pro-forma
-3.0% appreciation · 2.88% rent growth · sell at horizon
- IRR
- 11.2%
- Equity multiple
- 1.44×
- Total profit
- $46,717
- Equity at exit
- $55,914
- IRR
- 20.2%
- Equity multiple
- 2.69×
- Total profit
- $177,473
- Equity at exit
- $32,423
Cash invested: $105,000 (down + closing). Projections, not guarantees.
Landlord ↔ Tenant lean methodology
- Overall (STATE)
- 90 Strongly Landlord-Friendly
- State Indiana
- 90 Strongly Landlord-Friendly · R+11
- County
- — inherits STATE
- City
- — inherits STATE
ZIP-level market 46203
- Home prices YoY
- -26.7%
- Rents YoY
- 2.9%
- Active inventory
- 500
- Price-to-rent
- 23.0×
Monthly cashflow live
- Estimated rent
- $5,428 high interval (Pro) →
- Mortgage (P&I)
- −$1,967
- Tax est. 1.5%
- −$469 /mo · $5,625/yr
- Insurance
- −$156
- HOA
- −$0
- Vacancy / Maint / Mgmt
- −$1,140
- Net cashflow
- $1,697
Break-even live
Sensitivity live
| Price | -10% $1,956 | -5% $1,826 | +0% $1,697 | +5% $1,567 | +10% $1,437 |
|---|---|---|---|---|---|
| Rent | -10% $1,268 | -5% $1,482 | +0% $1,697 | +5% $1,911 | +10% $2,125 |
| Rate | -1.0pp $1,885 | -0.5pp $1,792 | base $1,697 | +0.5pp $1,599 | +1.0pp $1,501 |
4-unit breakdown (identical units grouped — click to expand)
| Units | Beds | Baths | Est. rent |
|---|---|---|---|
| 4× units | 3 | 4 | $5,428 |
| #1 | 3 | 4 | $1,357 |
| #2 | 3 | 4 | $1,357 |
| #3 | 3 | 4 | $1,357 |
| #4 | 3 | 4 | $1,357 |
| Total (4 units) | $5,428 | ||
UW: 25.0% down · 7.5% · 30yr · 1.5% tax · 5.0% vac · 8.0% maint · 8.0% mgmt
Financing live
Cash to close
- Down payment
- $93,750
- Closing costs
- $11,250
- Reserves months
- —
- Total cash needed
- —
Loan-product check · same deal, 3 products live
Conventional
25% down · 7.5% · 30yr
- Down + closing
- —
- Monthly P&I
- —
- Monthly cashflow
- —
- DSCR
- —
- Eligible?
- —
Personal DTI + credit; lowest rate.
DSCR
20% down · 8.5% · 30yr
- Down + closing
- —
- Monthly P&I
- —
- Monthly cashflow
- —
- DSCR
- —
- Eligible?
- —
No personal income docs; deal must DSCR.
Hard money
10% down · 12.0% · 12mo
- Down + closing
- —
- Monthly P&I
- —
- Monthly cashflow
- —
- DSCR
- —
- Eligible?
- —
Short-term bridge; refi at stabilization.
Listing history 20 events
-
2026-06-21days on market $375,000 Active 165 DOM
-
2026-06-18days on market $375,000 Active 162 DOM
-
2026-06-17days on market $375,000 Active 161 DOM
-
2026-06-16days on market $375,000 Active 160 DOM
-
2026-06-15days on market $375,000 Active 159 DOM
-
2026-06-13days on market $375,000 Active 157 DOM
-
2026-06-13days on market $375,000 Active 156 DOM
-
2026-06-09days on market $375,000 Active 153 DOM
-
2026-06-08days on market $375,000 Active 152 DOM
-
2026-06-07days on market $375,000 Active 151 DOM
-
2026-06-03days on market $375,000 Active 147 DOM
-
2026-06-02days on market $375,000 Active 146 DOM
-
2026-06-01days on market $375,000 Active 145 DOM
-
2026-05-31days on market $375,000 Active 144 DOM
-
2026-01-07$375,000 Active 448-char remark
Show marketing remark (448 chars)
This quadruplex has 2 units on each floor and is conveniently located near Fountain Square and just minutes from downtown Indy. The building has 4 paved parking spots (rear of building) with additional street parking (front of building). Tenants currently have month to month leases and rent includes water/heat. Owner is selling 2 parcels together and does not want to separate. Please see MIBOR website for listing ID's #22078961 & #22078931.
-
2020-06-13historical
-
2020-02-20status Active
-
2020-01-19status Pending
-
2020-01-19price $199,900
-
2020-01-17$164,900 Active
ⓘ Source: listings_history table (triggers on properties + properties_extension) + one-shot
backfill from property_details.listing_events for pre-trigger history.
Nearby sold comps map
Loading sold comps map…
Walkable amenities ~0.75 mi
Loading nearby amenities…
Taxation est. · year 1
- Rental income
- $65,136
- − Mortgage interest
- −$21,006
- − Property taxes
- −$5,625
- − Insurance
- −$1,875
- − Repairs & maintenance
- −$5,211
- − Management
- −$5,211
- − Depreciation
- −$10,909
- Taxable income
- $15,299
- Est. tax owed @ 24.0%
- −$3,672
- After-tax cash flow
- $16,687/yr
For passive investors: Depreciation is non-cash, so a rental often shows a tax loss while cash-flowing — sheltering income. Rental losses are passive: they offset passive income freely, and up to $25,000/yr can offset ordinary (W-2) income if you actively participate and your MAGI is under $100k (phasing out to $0 by $150k); unused losses carry forward. On sale, claimed depreciation is recaptured at up to 25%, and gains may owe capital-gains tax (a 1031 exchange can defer both). Figures are a year-1 estimate at your 24.0% rate — not tax advice; consult a CPA.
Schools (NCES district)
- District
- Indianapolis Public Schools
- NCES district ID
- 1804770
- Math proficiency
- 14% ▼ -7.00%
- Reading proficiency
- 20% ▼ -3.00%
- Median HH income
- $32,034
- Composite
- 13.69/100
- National rank
- #9499
- State rank
- #286 of 301 in IN
Livability — Indianapolis city (balance)
No livability data for this city. (Only ~50 U.S. cities are tracked.)
Census & demographics
- Census place
- Indianapolis city (balance), IN
- County
- Marion County · 998,460 people
- City population
- 881,119
- Metro
- Indianapolis-Carmel-Anderson, IN
- Population (ZIP)
- 37,758
- Household income
- $57,393
- Rent vs Own
- Severe rent burden
- 1499.0
Population outlook (Marion County) Hauer SSP2
- Today (2025)
- 1,025,572 people
- By 2030
- 1,065,727 · +3.9%
- By 2040
- 1,141,577 · +11.3%
- By 2050
- 1,208,920 · +17.9%
- By 2075
- 1,367,288 · +33.3%
- By 2100
- 1,438,201 · +40.2%
Race, ethnicity, and origin ACS 2023
- Neighborhood character
- Predominantly White (69%)
- Race & ethnicity
- White 69% Hispanic / Latino 14% Black 12% Two or more races 8% Asian 2% Native American 1%
- Hispanic origin (detail)
- Mexican 12% Puerto Rican 1%
- Common ancestry
- Slovak 2% Lithuanian 2% Italian 1%
- Foreign-born
- 8% · Canada
- Languages at home
- 88% English-only · Spanish 10% Other Indo-European 1%
Political lean MEDSL · Marion
- 2024 margin
- Strong D (+27.7) · D 63.0% · R 35.3% · Other 1.7%
- 2008→2024 swing
- -0.7pp no change · 2008: 28.4pp · 2024: 27.7pp
- All cycles
- 2024: D+27.7 2020: D+29.1 2016: D+22.8 2012: D+22.2 2008: D+28.4
Not yet ingested
- Civics
- —
Market trends
- HPI YoY
- ▼ -127.37%
- Current HPI
- 349.579
- Rent YoY
- ▲ 2.88%
- Metro
- Indianapolis-Carmel-Anderson, IN
- State GDP YoY
- ▲ 2.90%
- F500 in state
- 18
Industry mix (Fortune 500 HQ in IN)
| Industry | F500 HQs | Revenue |
|---|---|---|
| Industrial Machinery | 2 | $37B |
|
||
| Healthcare | 1 | $177B |
|
||
| Pharmaceuticals | 1 | $45B |
|
||
| Metals / Steel | 1 | $18B |
|
||
| Agriculture | 1 | $17B |
|
||
| Packaging | 1 | $12B |
|
||
Price history
+127.4% since first listed6 events — show timeline
- 2026-01-07 Listed $375,000 MIBOR as Distributed by MLS Grid
- 2020-06-13 Listing Removed — MIBOR as Distributed by MLS Grid
- 2020-02-20 Relisted — MIBOR as Distributed by MLS Grid
- 2020-01-19 Pending — MIBOR as Distributed by MLS Grid
- 2020-01-19 Price Changed $199,900 MIBOR as Distributed by MLS Grid
- 2020-01-17 Listed $164,900 MIBOR as Distributed by MLS Grid
Cash-flow waterfall
monthlySold comps — $/sqft
last 12 mo · ≤1 miLoading sold comps…