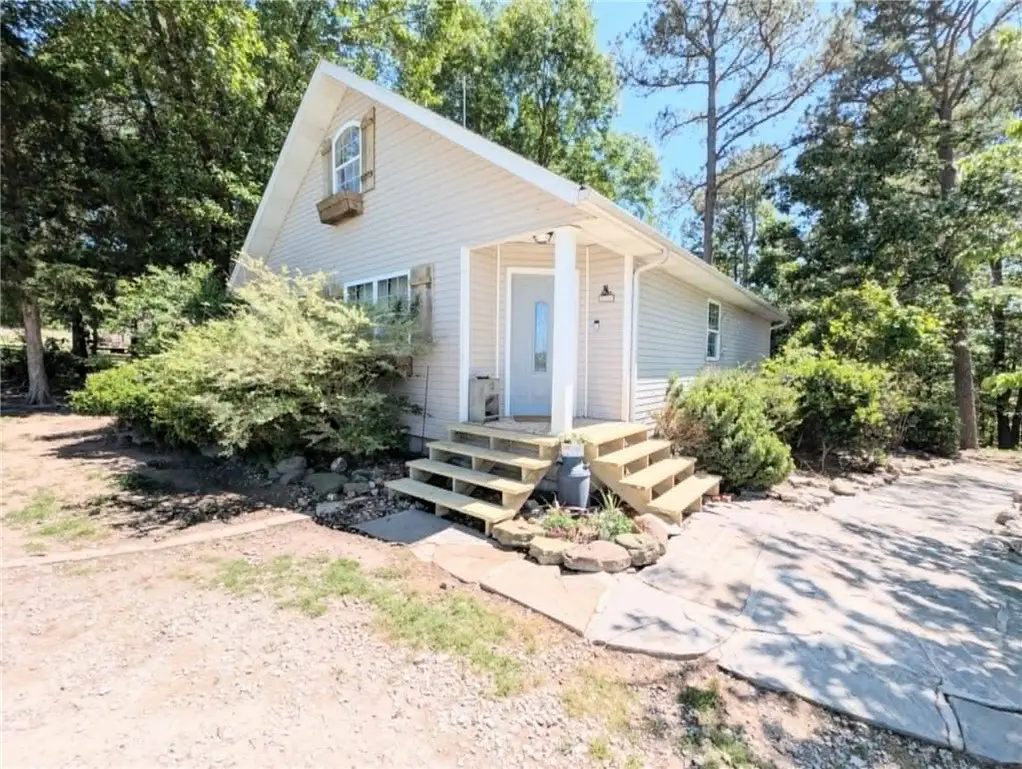
12085 Bridge Mtn · Omaha, AR
Flood risk 1/10 · Minimal
- FEMA flood zone
- X (unshaded)
- Chance of flooding over 30 yrs
- 0.0%
- Est. flood insurance / yr
- $507 – $1,088
Fire risk 5/10 · Moderate
- Est. fire insurance / yr
- $1,499 – $2,785
Heat risk 4/10 · Minor
- Hot days now (above 104°F)
- 7 days/yr
- Hot days in 30 yrs
- 21 days/yr
Wind risk 2/10 · Minimal
- Chance of severe wind over 30 yrs
- 1.0%
Air-quality risk 1/10 · Minimal
- Unhealthy air days now
- 0 days/yr
- Unhealthy air days in 30 yrs
- 0 days/yr
Risk factors via First Street. Map © Google.
Why this score? — see what drove the D grade
The composite is a weighted blend of 9 inputs, each scored 0–100. Each bar is that input's sub-score; the figure is the points it added to the 100-point composite (weight × sub-score).
- ARV discount +15.0/15.0
- Appreciation +10.0/10.0
- Cash flow +4.7/30.0
- Schools +3.1/10.0
- Livability +3.0/5.0
- Rent growth +2.5/5.0
- Condition / age +2.5/5.0
- 1% rule +0.0/10.0
- DSCR +0.0/10.0
$286,000
🖨 Deal sheet (PDF) 📄 Offer letter ✓ Due diligence
Listing remarks
Nestled on 1.37 scenic acres, this inviting 3-bedroom, 2-bath country home offers the perfect balance of privacy, space, and convenience. Located just 15 minutes from both Branson and Harrison, enjoy peaceful country living with easy access to shopping, dining, and entertainment. From the moment you arrive, you'll love the secluded setting and breathtaking valley views. The well-designed split-bedroom floor plan gives privacy to the spacious primary suite while keeping the other bedrooms on the opposite side. The 25' x 14' bonus room features a private upstairs office that can serve as a home office or a flexible fourth bedroom—perfect for a family room, playroom, or guest suite. A 40
Key facts
- 1.37 acre lot
- Built 2009
- Listed 48 days
Property features AI
Finance
- Financial info: Annual tax information available
- HOA & community: Association fees charged monthly
Exterior
- Parking: Gravel driveway (on-site parking)
- Security: Security system
- Utilities: Septic available; Septic tank
- Home design: Two-story home; 25 years or older
- Construction: Vinyl siding; Architectural shingle roof; Tie-down foundation
- Exterior features: Gravel driveway; Outbuilding; Outside city limits; Rolling slope; Dirt road access
Interior
- Kitchen: Dishwasher; Electric oven; Microwave; Refrigerator; Electric water heater
- Bedrooms: Two main-level bedrooms (each about 12' x 11')
- Flooring: Carpet; Luxury vinyl plank
- Bathrooms: Two full bathrooms (one main-level bath ~10'4" x 5'6")
- Heating & cooling: Central heating; Central air conditioning
- Interior features: Blinds; Window treatments; No other interior features listed
- Laundry & utility: Washer
Neighborhood map
What this means for you Summary
Snapshot
- This is a 3-bed/2.0-bath single-family listed at $286k.
Deal economics
- At list price, monthly cash flow is $-714 ($-9k/yr) — negative.
- To cash-flow at today's rent, offer at most $160k (44.1% below list).
- To meet the 1% rule (rent ≥ 1% of price), the offer needs to be $122k (57.4% below list).
- Recommended offer: $122k (57.4% below list) — sets the bar for 1% rule.
- Cap rate 3.3% vs local median 2.1% in Omaha — top-decile yield for the area; either an underpriced asset or a hidden risk that comps aren't pricing in. Stress-test before assuming the spread holds.
Location & tenants
- Location reads 59/100 on livability (#277 in AR) — a working-class tenant base; expect higher turnover. Strengths: cost of living A+, housing A+; Watch: health & safety C-, crime F, amenities F.
- Omaha School District (rural): math 34% / reading 39% proficiency, ranked #108 of 238 in AR (top 45%) — families likely to look elsewhere, expect single-tenant / working-renter base with shorter leases; 64% free/reduced lunch — lower-income household profile, screen leases tightly.
- Zoned schools: Omaha Elementary School (math 47% / reading 42%, grade F, #143 of 454 statewide, top 36%, 226 students, 76% FRL); Omaha High School (math 22% / reading 37%, grade F, #142 of 292 statewide, top 53%, 174 students, 68% FRL).
- Market conditions: 83 active listings in the ZIP; 92 units permitted in Boone County in 2024 (72 in 5+ unit buildings).
Forward outlook
- In year one you build about $31k of equity ($2k loan paydown + $29k appreciation (10.0% local appreciation)).
- Boone County population projected to shrink 8% by 2050 — rents likely to lag national; underwrite the cash flow, not the appreciation.
- By year 2, paydown + projected appreciation supports a ~$49k cash-out refi (75% LTV) — recoverable capital for the next deal without selling this one.
Negotiation context
- It's been on market 48 days — a 3% lower offer ($277k) is reasonable based on typical stale-listing flexibility.
Risks & watch-outs
- Climate carrying-cost: moderate wildfire risk — expect insurance premiums to compound above CPI over the hold.
Questions for the listing agent
- What do current leases actually rent for vs. the listed asking? Can we see a recent rent roll and the last 12 months of T-12 income?
- It's been on market 48 days. Have you received any prior offers? Is the seller open to a 57% concession, seller financing, or rate buy-down credit?
- Is there a deadline driving the sale (1031 exchange, divorce, estate, relocation)? That informs how much negotiation room exists.
- Schools are D-rated, which usually means shorter tenancies and higher turnover. Who's the typical renter profile here, and what's been the actual vacancy rate?
- Crime grade is F in this area — have there been break-ins, vandalism, or insurance claims at this property in the last 3 years? What carrier currently insures it and at what premium?
- The area grade is low — what's the realistic commute time and amenity access for the typical tenant pool here? Any planned neighborhood developments (good or bad) we should know about?
- What's the average days-on-market for RENTAL listings here right now (not sales)? A rising rental-DOM trend means longer vacancies and softer asking-rent achievability than the comps imply.
- What's the recent tenant-quality profile in this submarket — average credit score on applications, eviction rate, late-payment / NSF rate, and stable-employment percentage? A property-management company in the area should have these aggregated.
- How much new for-sale + rental construction is in the pipeline within 1–3 miles? Heavy new supply typically softens prices + rents 12–24 months out; constrained supply supports both.
Investment metrics
- 1% rule
- 0.43% ✗
- Cap rate
- 3.30%
- Cash-on-cash
- -10.69%
- DSCR
- 0.52
- GRM
- 19.6
CMA / ARV
- ARV (median comp)
- $347,560
- List price
- $286,000
- Delta
- -17.71%
- Verdict
- UNDERPRICED
- Comps
- 10 within 2.0 mi
Projected returns pro-forma
10.0% appreciation · 3.0% rent growth · sell at horizon
- IRR
- 16.8%
- Equity multiple
- 2.38×
- Total profit
- $110,149
- Equity at exit
- $257,651
- IRR
- 15.9%
- Equity multiple
- 5.49×
- Total profit
- $359,780
- Equity at exit
- $555,635
Cash invested: $80,080 (down + closing). Projections, not guarantees.
Landlord ↔ Tenant lean methodology
- Overall (STATE)
- 92 Strongly Landlord-Friendly
- State Arkansas
- 92 Strongly Landlord-Friendly · R+14
- County
- — inherits STATE
- City
- — inherits STATE
ZIP-level market 72662
- Home prices YoY
- 15.1%
- Active inventory
- 83
- Price-to-rent
- 19.6×
Monthly cashflow live
- Estimated rent
- $1,218 medium interval (Pro) →
- Mortgage (P&I)
- −$1,500
- Tax from tax record
- −$57 /mo · $679/yr
- Insurance
- −$119
- HOA
- −$0
- Vacancy / Maint / Mgmt
- −$256
- Net cashflow
- $-714
Break-even live
Sensitivity live
| Price | -10% $-552 | -5% $-633 | +0% $-714 | +5% $-795 | +10% $-875 |
|---|---|---|---|---|---|
| Rent | -10% $-810 | -5% $-762 | +0% $-714 | +5% $-665 | +10% $-617 |
| Rate | -1.0pp $-570 | -0.5pp $-641 | base $-714 | +0.5pp $-788 | +1.0pp $-863 |
UW: 25.0% down · 7.5% · 30yr · 1.5% tax · 5.0% vac · 8.0% maint · 8.0% mgmt
Financing live
Cash to close
- Down payment
- $71,500
- Closing costs
- $8,580
- Reserves months
- —
- Total cash needed
- —
Loan-product check · same deal, 3 products live
Conventional
25% down · 7.5% · 30yr
- Down + closing
- —
- Monthly P&I
- —
- Monthly cashflow
- —
- DSCR
- —
- Eligible?
- —
Personal DTI + credit; lowest rate.
DSCR
20% down · 8.5% · 30yr
- Down + closing
- —
- Monthly P&I
- —
- Monthly cashflow
- —
- DSCR
- —
- Eligible?
- —
No personal income docs; deal must DSCR.
Hard money
10% down · 12.0% · 12mo
- Down + closing
- —
- Monthly P&I
- —
- Monthly cashflow
- —
- DSCR
- —
- Eligible?
- —
Short-term bridge; refi at stabilization.
Listing history 18 events
-
2026-06-21days on market $286,000 Active 48 DOM
-
2026-06-19days on market $286,000 Active 46 DOM
-
2026-06-18days on market $286,000 Active 45 DOM
-
2026-06-17days on market $286,000 Active 44 DOM
-
2026-06-16days on market $286,000 Active 43 DOM
-
2026-06-15days on market $286,000 Active 42 DOM
-
2026-06-14days on market $286,000 Active 40 DOM
-
2026-06-12days on market $286,000 Active 39 DOM
-
2026-06-09days on market $286,000 Active 36 DOM
-
2026-06-08days on market $286,000 Active 35 DOM
-
2026-06-07days on market $286,000 Active 34 DOM
-
2026-06-07pricedays on market $286,000 Active 33 DOM
-
2026-06-04days on market $295,000 Active 30 DOM
-
2026-06-02days on market $295,000 Active 29 DOM
-
2026-06-01days on market $295,000 Active 28 DOM
-
2026-05-31days on market $295,000 Active 27 DOM
-
2026-05-31days on market $295,000 Active 26 DOM
-
2026-05-04$295,000 Active 895-char remark
ⓘ Source: listings_history table (triggers on properties + properties_extension) + one-shot
backfill from property_details.listing_events for pre-trigger history.
Tax reassessment forecast AR · Resets to sale price
- Current annual tax
- $679 · $57/mo
- Projected year-2 tax
- $1,830 · $153/mo
- Expected delta
- +$1,151/yr (+$96/mo · 169.5%)
ⓘ Screening estimate from a state-policy table — verify with the county assessor before closing.
Climate risk First Street
- Flood 1/10 Low FEMA zone X (unshaded) · 0% chance over 30 yrs
- Wildfire 5/10 Major
- Heat 4/10 Moderate 7 d/yr ≥104°F today · 21 d/yr by 30 yrs out
- Wind 2/10 Low 100% chance of damaging wind over 30 yrs
- Air quality 1/10 Low 0 unhealthy d/yr today · 0 by 30 yrs out
Nearby sold comps map
Loading sold comps map…
Walkable amenities ~0.75 mi
Loading nearby amenities…
Taxation est. · year 1
- Rental income
- $14,613
- − Mortgage interest
- −$16,020
- − Property taxes
- −$679
- − Insurance
- −$1,430
- − Repairs & maintenance
- −$1,169
- − Management
- −$1,169
- − Depreciation
- −$8,320
- Taxable loss
- −$14,175
- Est. tax savings @ 24.0%
- +$3,402
- After-tax cash flow
- $-5,161/yr
For passive investors: Depreciation is non-cash, so a rental often shows a tax loss while cash-flowing — sheltering income. Rental losses are passive: they offset passive income freely, and up to $25,000/yr can offset ordinary (W-2) income if you actively participate and your MAGI is under $100k (phasing out to $0 by $150k); unused losses carry forward. On sale, claimed depreciation is recaptured at up to 25%, and gains may owe capital-gains tax (a 1031 exchange can defer both). Figures are a year-1 estimate at your 24.0% rate — not tax advice; consult a CPA.
Schools (NCES district)
- District
- Omaha School District
- NCES district ID
- 0510920
- Math proficiency
- 34% ▼ -13.00%
- Reading proficiency
- 39% ▼ -13.00%
- Median HH income
- $39,672
- Composite
- 30.59/100
- National rank
- #6198
- State rank
- #108 of 238 in AR
Livability — Omaha
- Score
- 59/100
- State rank
- #277
- US rank
- #19624
Category grades
Schools grade is shown separately in the Schools card above.
Census & demographics
- Population (ZIP)
- 2,935
Population outlook (Boone County) Hauer SSP2
- Today (2025)
- 37,238 people
- By 2030
- 36,808 · -1.2%
- By 2040
- 35,597 · -4.4%
- By 2050
- 34,197 · -8.2%
- By 2075
- 30,503 · -18.1%
- By 2100
- 25,797 · -30.7%
Race, ethnicity, and origin ACS 2023
- Neighborhood character
- Predominantly White (95%)
- Race & ethnicity
- White 95% Two or more races 4%
- Common ancestry
- Slovak 7% Lithuanian 4% Serbian 3%
Political lean MEDSL · Boone
- 2024 margin
- Solid R (+65.0) · D 16.7% · R 81.6% · Other 1.7%
- 2008→2024 swing
- -25.3pp toward R · 2008: -39.7pp · 2024: -65.0pp
- All cycles
- 2024: R+65.0 2020: R+61.9 2016: R+58.5 2012: R+48.0 2008: R+39.7
Not yet ingested
- Civics
- —
Market trends
- HPI YoY
- ▲ 39.20%
- Current HPI
- 298.4054
- Rent YoY
- —
- Metro
- —
- State GDP YoY
- ▲ 3.80%
- F500 in state
- 10
Industry mix (Fortune 500 HQ in AR)
| Industry | F500 HQs | Revenue |
|---|---|---|
| Retail | 1 | $681B |
|
||
| Food / Agriculture | 1 | $53B |
|
||
| Retail / Energy | 1 | $22B |
|
||
| Transportation / Logistics | 1 | $12B |
|
||
| Energy | 1 | $4B |
|
||
Price history
-3.1% since first listed2 events — show timeline
- 2026-06-04 Price Changed $286,000 NWARMLS
- 2026-05-04 Listed $295,000 NWARMLS
Property tax history
-2.0%/yrLatest (2025): $679 · -12.8% YoY. Source: county tax records.
Cash-flow waterfall
monthlySold comps — $/sqft
last 12 mo · ≤1 miLoading sold comps…