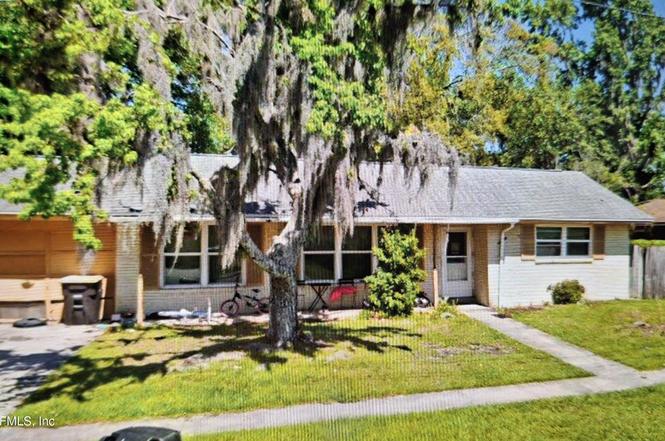
6104 Golden Grove Rd W · Jacksonville, FL
Flood risk 1/10 · Minimal
- FEMA flood zone
- X (unshaded)
- Chance of flooding over 30 yrs
- 0.0%
- Est. flood insurance / yr
- $507 – $1,088
Fire risk 3/10 · Minor
- Est. fire insurance / yr
- $947 – $1,759
Heat risk 8/10 · Major
- Hot days now (above 108°F)
- 7 days/yr
- Hot days in 30 yrs
- 20 days/yr
Wind risk 10/10 · Severe
- Chance of severe wind over 30 yrs
- 99.0%
Air-quality risk 3/10 · Minor
- Unhealthy air days now
- 3 days/yr
- Unhealthy air days in 30 yrs
- 4 days/yr
Risk factors via First Street. Map © Google.
Why this score? — see what drove the C grade
The composite is a weighted blend of 9 inputs, each scored 0–100. Each bar is that input's sub-score; the figure is the points it added to the 100-point composite (weight × sub-score).
- Cash flow +19.9/30.0
- ARV discount +15.0/15.0
- DSCR +6.3/10.0
- Livability +4.2/5.0
- 1% rule +4.1/10.0
- Schools +3.9/10.0
- Rent growth +3.1/5.0
- Condition / age +2.5/5.0
- Appreciation +0.0/10.0
$190,000
🖨 Deal sheet 📄 Offer letter ✓ Due diligence
Listing remarks
Discover the perfect canvas for your dream home in this spacious 3-bedroom, 2-bathroom residence. This home offers a formal living room for entertaining and a kitchen awaiting your gourmet vision. While the interior seeks a stylish, modern flare, the heavy lifting has been done for you: a new roof and windows (2017) and professionally repaired plumbing (2023) provide peace of mind and a head start on your renovations.
Key facts
- 7,840 sq ft lot
- Garage
- Built 1972
Neighborhood map
What this means for you Summary
Snapshot
- This is a 3-bed/2.0-bath single-family listed at $190k.
Deal economics
- At list price, monthly cash flow is $229 ($3k/yr) — positive.
- The deal already cash-flows at list — no discount required.
- To meet the 1% rule (rent ≥ 1% of price), the offer needs to be $174k (8.6% below list).
- Recommended offer: $174k (8.6% below list) — sets the bar for 1% rule.
- Cap rate 7.7% vs local median 4.0% in Jacksonville — top-decile yield for the area; either an underpriced asset or a hidden risk that comps aren't pricing in. Stress-test before assuming the spread holds.
Location & tenants
- Location reads 83/100 on livability (#50 in FL, #911 nationally) — a professional / high-income tenant draw. Strengths: amenities A+, commute A+, housing A+.
- Duval (urban): math 46% / reading 45% proficiency, ranked #48 of 73 in FL (top 66%) — families likely to look elsewhere, expect single-tenant / working-renter base with shorter leases.
- Market conditions: Rents rising (+2.2%/yr); 349 active listings in the ZIP; 40 comparable units currently listed for rent nearby; rentals at typical pace (median 16d on market — plan ~3-4 weeks tenant-placement turnaround); 6,503 units permitted in Duval County in 2024 (1,131 in 5+ unit buildings).
- This rent runs 34% of the median local income ($62k/yr) — at the standard rent-burdened threshold; future hikes will face affordability resistance.
Forward outlook
- Local home prices are declining (-3.0%/yr); year-one equity from $1k of loan paydown is wiped out by about $6k of value loss. Plan a longer hold.
- Duval County population projected at +19% by 2050 — long-run rental-demand tailwind backs the buy-and-hold thesis.
Negotiation context
- Only 1 days on market — expect competitive offers; lowballing is unlikely to land.
- Current owner paid $64k; list at $190k implies a 197% gain — meaningful room to come down on a strong offer.
Risks & watch-outs
- Climate carrying-cost: severe wind risk, 99% chance of damaging wind over 30y; extreme-heat days projected 7→20/yr by 2055 (HVAC capex compounding) — expect insurance premiums to compound above CPI over the hold.
Questions for the listing agent
- Built in 1972 — when were the roof, HVAC, electrical panel, plumbing, and water heater last replaced?
- Is there a deadline driving the sale (1031 exchange, divorce, estate, relocation)? That informs how much negotiation room exists.
- Schools are B-rated — typically a magnet for longer-tenancy family renters. What's the average tenant stay here, and is there a school-zone premium baked into asking?
- What's the average days-on-market for RENTAL listings here right now (not sales)? A rising rental-DOM trend means longer vacancies and softer asking-rent achievability than the comps imply.
- What's the recent tenant-quality profile in this submarket — average credit score on applications, eviction rate, late-payment / NSF rate, and stable-employment percentage? A property-management company in the area should have these aggregated.
- How much new for-sale + rental construction is in the pipeline within 1–3 miles? Heavy new supply typically softens prices + rents 12–24 months out; constrained supply supports both.
Investment metrics
- 1% rule
- 0.91% ✗
- Cap rate
- 7.74%
- Cash-on-cash
- 5.17%
- DSCR
- 1.23
- GRM
- 9.1
CMA / ARV
- ARV (on-the-fly)
- $233,120
- Comps found
- 12
Show comp detail 12 sales within ~0.75 mi
| Address | Dist | Beds/Ba | Sqft | Sold | Price | $/sf | Match |
|---|---|---|---|---|---|---|---|
| 6104 Golden Grove Rd W | 0.00mi | 3/2.0 | 1,504 (0%) | 0mo | $166,500 | $111 | 100 |
| 7466 Deepwood Dr N | 0.04mi | 3/2.0 | 1,530 (+2%) | 3mo | $255,000 | $167 | 93 |
| 7474 Deepwood Dr N | 0.03mi | 3/2.0 | 1,553 (+3%) | 2mo | $175,000 | $113 | 92 |
| 5959 Buckley Dr | 0.31mi | 3/2.0 | 1,351 (-10%) | 1mo | $179,000 | $132 | 68 |
| 7988 Renault Dr S | 0.61mi | 4/2.0 (+1) | 1,509 (+0%) | 2mo | $232,000 | $154 | 65 |
| 8025 Triumph Ln S | 0.67mi | 3/2.0 | 1,572 (+4%) | 3mo | $224,000 | $142 | 59 |
| 6126 Sage Willow Way | 0.74mi | 4/2.0 (+1) | 1,470 (-2%) | 4mo | $244,900 | $167 | 54 |
| 6090 Sage Willow Way | 0.73mi | 3/2.0 | 1,394 (-7%) | 3mo | $234,900 | $169 | 51 |
| 7843 Lancia St N | 0.61mi | 4/2.0 (+1) | 1,640 (+9%) | 1mo | $274,000 | $167 | 50 |
| 7860 Falcon St | 0.65mi | 3/2.0 | 1,682 (+12%) | 2mo | $260,000 | $155 | 48 |
| 8079 Violet Willow Ln | 0.69mi | 4/2.0 (+1) | 1,640 (+9%) | 2mo | $254,000 | $155 | 46 |
| 7959 Lancia St N | 0.72mi | 4/1.0 (+1) | 1,680 (+12%) | 1mo | $250,000 | $149 | 38 |
Match score weights: distance 35% · size 25% · config 20% · recency 20%. Top-matched comps best support the ARV.
Projected returns pro-forma
-3.0% appreciation · 2.25% rent growth · sell at horizon
- IRR
- -9.1%
- Equity multiple
- 0.67×
- Total profit
- $-17,559
- Equity at exit
- $28,330
- IRR
- -0.6%
- Equity multiple
- 0.96×
- Total profit
- $-2,057
- Equity at exit
- $16,428
Cash invested: $53,200 (down + closing). Projections, not guarantees.
Landlord ↔ Tenant lean methodology
- Overall (STATE)
- 87 Strongly Landlord-Friendly
- State Florida
- 87 Strongly Landlord-Friendly · R+3
- County
- — inherits STATE
- City
- — inherits STATE
ZIP-level market 32244
- Home prices YoY
- -17.8%
- Rents YoY
- 2.2%
- Active inventory
- 349
- Price-to-rent
- 9.1×
Monthly cashflow live
- Estimated rent
- $1,737 high interval (Pro) →
- Mortgage (P&I)
- −$996
- Tax from tax record
- −$67 /mo · $806/yr
- Insurance
- −$79
- HOA
- −$0
- Vacancy / Maint / Mgmt
- −$365
- Net cashflow
- $229
Break-even live
UW: 25.0% down · 7.5% · 30yr · 1.5% tax · 5.0% vac · 8.0% maint · 8.0% mgmt
Financing live
Cash to close
- Down payment
- $47,500
- Closing costs
- $5,700
- Reserves months
- —
- Total cash needed
- —
Loan-product check · same deal, 3 products live
Conventional
25% down · 7.5% · 30yr
- Down + closing
- —
- Monthly P&I
- —
- Monthly cashflow
- —
- DSCR
- —
- Eligible?
- —
Personal DTI + credit; lowest rate.
DSCR
20% down · 8.5% · 30yr
- Down + closing
- —
- Monthly P&I
- —
- Monthly cashflow
- —
- DSCR
- —
- Eligible?
- —
No personal income docs; deal must DSCR.
Hard money
10% down · 12.0% · 12mo
- Down + closing
- —
- Monthly P&I
- —
- Monthly cashflow
- —
- DSCR
- —
- Eligible?
- —
Short-term bridge; refi at stabilization.
Rent comps 40 comps
| Address | Beds | Baths | Sqft | Rent | $/sqft | DOM | Units | Dist |
|---|---|---|---|---|---|---|---|---|
| 6241 Cranberry Ln E Jacksonville, FL | 4.0 | 2.0 | 2112 | $1,350 | $0.64 | 23d | 1 | 0.26mi |
| 5928 Firestone Rd Jacksonville, FL | 1.0–3.0 | 1.0–2.0 | 944 | $1,600 | $1.69 | 2d | 13 | 0.37mi |
| 6019 Blank Dr Jacksonville, FL | 3.0 | 2.0 | 1520 | $1,500 | $0.99 | 23d | 1 | 0.41mi |
| 5524 Enchanted Dr Jacksonville, FL | 3.0 | 1.5 | 1237 | $1,580 | $1.28 | 3d | 1 | 0.55mi |
| 7707 Falcon St Jacksonville, FL | 4.0 | 2.0 | 1300 | $2,000 | $1.54 | 17d | 1 | 0.55mi |
| 7901 Austin Rd Jacksonville, FL | 3.0 | 2.0 | 1268 | $1,815 | $1.43 | 23d | 1 | 0.62mi |
| 7947 Renault Dr Jacksonville, FL | 3.0 | 2.0 | 1285 | $1,500 | $1.17 | 17d | 1 | 0.65mi |
| 7948 Austin Rd Jacksonville, FL | 3.0 | 2.0 | 1335 | $1,775 | $1.33 | 4d | 1 | 0.66mi |
| 7978 Renault Dr Jacksonville, FL | 3.0 | 2.0 | 1080 | $1,850 | $1.71 | 23d | 1 | 0.67mi |
| 6019 Verdes Rd Jacksonville, FL | 3.0 | 1.0 | 1209 | $1,335 | $1.10 | 23d | 1 | 0.69mi |
| 7952 118th St Jacksonville, FL | 4.0 | 2.5 | 1407 | $1,895 | $1.35 | 10d | 1 | 0.71mi |
| 7952 118th St Jacksonville, FL | 4.0 | 2.5 | 1407 | $1,895 | $1.35 | 7d | 1 | 0.71mi |
| 6109 Sage Willow Way Jacksonville, FL | 4.0 | 2.0 | 1760 | $1,921 | $1.09 | 21d | 1 | 0.72mi |
| 5905 Renault Dr W Jacksonville, FL | 4.0 | 2.0 | 1524 | $1,850 | $1.21 | 23d | 1 | 0.77mi |
| 8121 Cheryl Ann Ln Unit Le Sabre Townhouse Jacksonville, FL | 3.0 | 2.5 | 1601 | $1,950 | $1.22 | 4d | 1 | 0.87mi |
| 6263 Toyota Dr Jacksonville, FL | 3.0 | 2.0 | 1663 | $1,835 | $1.10 | 7d | 1 | 0.87mi |
| 8050 103rd St Jacksonville, FL | 1.0–3.0 | 1.0–2.0 | 1025 | $1,575 | $1.54 | 1d | 11 | 0.87mi |
| 5150 Playpen Dr #4 Jacksonville, FL | 2.0 | 2.0 | 1118 | $1,200 | $1.07 | 21d | 1 | 0.89mi |
| 6945 Morse Ave Jacksonville, FL | 2.0–4.0 | 2.0 | 1169 | $1,333 | $1.14 | 14d | 1 | 0.90mi |
| 5150 Playpen Dr Unit 2-1 Jacksonville, FL | 3.0 | 2.0 | 1157 | $1,225 | $1.06 | 4d | 1 | 0.90mi |
| 5913 Tampico Rd Jacksonville, FL | 3.0 | 1.0 | 1110 | $1,348 | $1.21 | 14d | 1 | 0.90mi |
| 7364 Strato Rd Jacksonville, FL | 3.0 | 2.0 | 1412 | $1,750 | $1.24 | 23d | 1 | 0.91mi |
| 7318 Strato Rd Jacksonville, FL | 3.0 | 2.0 | 1204 | $1,550 | $1.29 | 3d | 1 | 0.93mi |
| 6869 Southern Oaks Dr W Jacksonville, FL | 3.0 | 2.0 | 1660 | $1,861 | $1.12 | 14d | 1 | 0.93mi |
| 8144 Colonnade Ct W Jacksonville, FL | 3.0 | 2.5 | 1307 | $1,745 | $1.34 | 23d | 1 | 0.94mi |
| 6649 Georgia Jack Dr Jacksonville, FL | 4.0 | 2.0 | 1664 | $2,100 | $1.26 | 23d | 1 | 0.96mi |
| 4781 Playschool Dr Jacksonville, FL | 3.0 | 2.5 | 1548 | $1,495 | $0.97 | 7d | 1 | 0.96mi |
| 8148 Metto Rd Jacksonville, FL | 3.0 | 2.0 | 1209 | $1,576 | $1.30 | 3d | 1 | 0.97mi |
| 6850 Rhapsody Rd Jacksonville, FL | 3.0 | 2.5 | 1970 | $1,995 | $1.01 | 23d | 1 | 0.98mi |
| 8180 Metto Rd Jacksonville, FL | 4.0 | 2.5 | 1665 | $1,859 | $1.12 | 16d | 1 | 0.99mi |
| 7796 Playschool Ln Jacksonville, FL | 3.0 | 2.5 | 1339 | $1,375 | $1.03 | 23d | 1 | 0.99mi |
| 7800 Playschool Ln Jacksonville, FL | 3.0 | 2.5 | 1339 | $1,361 | $1.02 | 14d | 1 | 0.99mi |
| 6553 Big Stone Dr Jacksonville, FL | 4.0 | 2.0 | 1900 | $2,300 | $1.21 | 23d | 1 | 1.00mi |
| 7840 Playschool Ln Jacksonville, FL | 3.0 | 2.5 | 1339 | $1,398 | $1.04 | 14d | 1 | 1.00mi |
| 7880 Playschool Ln Jacksonville, FL | 3.0 | 2.5 | 1339 | $1,495 | $1.12 | 16d | 1 | 1.02mi |
| 4807 Playpen Dr Jacksonville, FL | 2.0 | 2.5 | 1204 | $1,322 | $1.10 | 3d | 1 | 1.02mi |
| 6478 Silk Leaf Ln Jacksonville, FL | 3.0 | 2.0 | 1682 | $1,985 | $1.18 | 23d | 1 | 1.03mi |
| 7851 Playschool Ln Jacksonville, FL | 3.0 | 3.0 | 1508 | $1,600 | $1.06 | 23d | 1 | 1.04mi |
| 7765 Highchair Ln Jacksonville, FL | 2.0 | 2.5 | 1204 | $1,375 | $1.14 | 14d | 1 | 1.06mi |
| 8325 Homeport Ct Jacksonville, FL | 3.0 | 2.0 | 1518 | $1,575 | $1.04 | 17d | 1 | 1.07mi |
Listing history 3 events
-
2026-03-02status Pending
-
2026-02-25$190,000 Active
-
1990-11-01soldstatus $63,900
ⓘ Source: listings_history table (triggers on properties + properties_extension) + one-shot
backfill from property_details.listing_events for pre-trigger history.
Tax reassessment forecast FL · Resets to sale price
- Current annual tax
- $806 · $67/mo
- Projected year-2 tax
- $1,577 · $131/mo
- Expected delta
- +$771/yr (+$64/mo · 95.6%)
ⓘ Screening estimate from a state-policy table — verify with the county assessor before closing.
Climate risk First Street
- Flood 1/10 Low FEMA zone X (unshaded) · 0% chance over 30 yrs
- Wildfire 3/10 Moderate
- Heat 8/10 Severe 7 d/yr ≥108°F today · 20 d/yr by 30 yrs out
- Wind 10/10 Extreme 99% chance of damaging wind over 30 yrs
- Air quality 3/10 Moderate 3 unhealthy d/yr today · 4 by 30 yrs out
Nearby sold comps map
Loading sold comps map…
Walkable amenities ~0.75 mi
Loading nearby amenities…
Taxation est. · year 1
- Rental income
- $20,842
- − Mortgage interest
- −$10,643
- − Property taxes
- −$806
- − Insurance
- −$950
- − Repairs & maintenance
- −$1,667
- − Management
- −$1,667
- − Depreciation
- −$5,527
- Taxable loss
- −$419
- Est. tax savings @ 24.0%
- +$101
- After-tax cash flow
- $2,853/yr
For passive investors: Depreciation is non-cash, so a rental often shows a tax loss while cash-flowing — sheltering income. Rental losses are passive: they offset passive income freely, and up to $25,000/yr can offset ordinary (W-2) income if you actively participate and your MAGI is under $100k (phasing out to $0 by $150k); unused losses carry forward. On sale, claimed depreciation is recaptured at up to 25%, and gains may owe capital-gains tax (a 1031 exchange can defer both). Figures are a year-1 estimate at your 24.0% rate — not tax advice; consult a CPA.
Schools (NCES district)
- District
- Duval
- NCES district ID
- 1200480
- Math proficiency
- 46% ▼ -11.00%
- Reading proficiency
- 45% ▼ -4.00%
- Median HH income
- $48,987
- Composite
- 38.97/100
- National rank
- #4076
- State rank
- #48 of 73 in FL
Livability — Jacksonville
- Score
- 83/100
- State rank
- #50
- US rank
- #911
Category grades
Schools grade is shown separately in the Schools card above.
Census & demographics
- Census place
- Jacksonville, FL
- County
- Duval County · 1,015,274 people
- City population
- 979,034
- Metro
- Jacksonville, FL
- Population (ZIP)
- 63,592
- Household income
- $62,204
- Rent vs Own
- Severe rent burden
- 2799.0
Population outlook (Duval County) Hauer SSP2
- Today (2025)
- 1,013,010 people
- By 2030
- 1,059,228 · +4.6%
- By 2040
- 1,141,439 · +12.7%
- By 2050
- 1,205,258 · +19.0%
- By 2075
- 1,324,282 · +30.7%
- By 2100
- 1,319,620 · +30.3%
Race, ethnicity, and origin ACS 2023
- Neighborhood character
- Highly diverse neighborhood (Simpson 0.70)
- Race & ethnicity
- White 39% Black 35% Hispanic / Latino 15% Two or more races 10% Asian 6%
- Hispanic origin (detail)
- Mexican 3% Puerto Rican 6% Cuban 3%
- Common ancestry
- Hispanic 1% Lithuanian 1% Romanian 1%
- Foreign-born
- 12% · Canada, Vietnam, China
- Languages at home
- 83% English-only · Spanish 9% Tagalog/Filipino 3% French/Haitian/Cajun 2%
Political lean MEDSL · Duval
- 2024 margin
- Toss-up / Even · D 48.7% · R 50.1% · Other 1.2%
- 2008→2024 swing
- +0.4pp no change · 2008: -1.9pp · 2024: -1.5pp
- All cycles
- 2024: R+1.5 2020: D+3.8 2016: R+1.5 2012: R+3.6 2008: R+1.9
Not yet ingested
- Civics
- —
Market trends
- HPI YoY
- ▼ -64.22%
- Current HPI
- 296.5375
- Rent YoY
- ▲ 2.25%
- Metro
- Jacksonville, FL
- State GDP YoY
- ▲ 3.28%
- F500 in state
- 36
Industry mix (Fortune 500 HQ in FL)
| Industry | F500 HQs | Revenue |
|---|---|---|
| Industrial Technology | 2 | $29B |
|
||
| Insurance | 2 | $17B |
|
||
| Retail | 1 | $60B |
|
||
| Technology Distribution | 1 | $58B |
|
||
| Homebuilding | 1 | $35B |
|
||
| Technology Manufacturing | 1 | $35B |
|
||
Price history
+197.3% since first listed3 events — show timeline
- 2026-03-02 Pending — realMLS
- 2026-02-25 Listed $190,000 realMLS
- 1990-11-01 Sold (Public Records) $63,900 Public Records
Property tax history
+1.9%/yrLatest (2025): $806 · +28.9% YoY. Source: county tax records.
Cash-flow waterfall
monthlySold comps — $/sqft
last 12 mo · ≤1 miLoading sold comps…