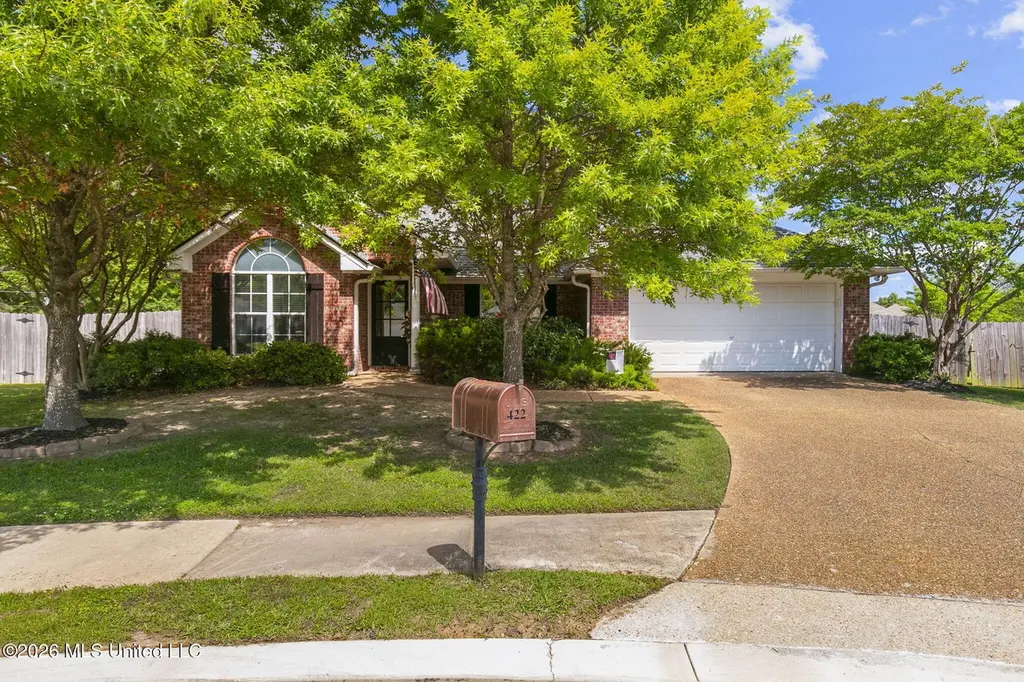
422 Fenway Dr · Flowood, MS
Flood risk 1/10 · Minimal
- FEMA flood zone
- X (unshaded)
- Chance of flooding over 30 yrs
- 0.0%
- Est. flood insurance / yr
- $507 – $1,088
Fire risk 3/10 · Minor
- Est. fire insurance / yr
- $1,241 – $2,305
Heat risk 8/10 · Major
- Hot days now (above 108°F)
- 7 days/yr
- Hot days in 30 yrs
- 20 days/yr
Wind risk 8/10 · Major
- Chance of severe wind over 30 yrs
- 80.0%
Air-quality risk 2/10 · Minimal
- Unhealthy air days now
- 1 days/yr
- Unhealthy air days in 30 yrs
- 1 days/yr
Risk factors via First Street. Map © Google.
Why this score? — see what drove the C- grade
The composite is a weighted blend of 9 inputs, each scored 0–100. Each bar is that input's sub-score; the figure is the points it added to the 100-point composite (weight × sub-score).
- Cash flow +18.4/30.0
- ARV discount +11.0/15.0
- DSCR +5.8/10.0
- Schools +4.6/10.0
- Livability +3.9/5.0
- 1% rule +3.7/10.0
- Rent growth +3.2/5.0
- Condition / age +2.5/5.0
- Appreciation +0.0/10.0
$242,000
🖨 Deal sheet 📄 Offer letter ✓ Due diligence
Listing remarks MLS
Very pretty 3 bedroom 2 bath home with nice living area w/ gas fireplace nice wood floors big kitchen with lots of counter and cabinet space master is big and master bath is GREAT with double vanity jetted tub and sep stand up shower secondary bedrooms are a good sixe with good closets covered back porch and big nice backyard.. Home is located in a culdesac.. A must see.. Please call your realtor today!!
Key facts
- Large fenced yard
- Freshly painted
- Covered patio
Tags
Property features AI
Finance
- HOA & community: Homeowners association with annual fee of $150 (includes grounds maintenance); Community amenities include boating, fishing, restaurant access, and sports fields
Exterior
- Parking: Attached 2-car garage with garage door opener; Driveway parking; Concrete surfaces; Garage storage
- Security: Smoke detector(s)
- Utilities: Public water; Public sewer; Electricity available; Natural gas connected; Cable available; Sewer connected
- Home design: Single family residence; One story; Move-in ready
- Construction: Brick/brick veneer exterior; Composition roof; Slab foundation; Built (year per public records)
- Exterior features: Private yard; Fire pit; Patio (slab); Back yard fencing; Few trees; Sloped, irregular pie-shaped lot
Interior
- Kitchen: Built-in electric range; Electric cooktop; Range hood; Microwave; Dishwasher; Disposal
- Flooring: Carpet; Ceramic tile; Wood
- Bathrooms: 2 full bathrooms
- Heating & cooling: Central heating (natural gas) and fireplace heating; Central air; Ceiling fans
- Interior features: Crown molding; High ceilings; Storage; Walk-in closet(s); Double vanity; Blinds; Insulated windows; Deadbolt locks; Has fireplace (located in great room and bath)
- Laundry & utility: Laundry room with washer and electric dryer hookups; Inside laundry
Neighborhood map
What this means for you Summary
Snapshot
- This is a 3-bed/2.0-bath single-family listed at $242k.
Deal economics
- At list price, monthly cash flow is $226 ($3k/yr) — positive.
- The deal already cash-flows at list — no discount required.
- To meet the 1% rule (rent ≥ 1% of price), the offer needs to be $211k (12.9% below list).
- Recommended offer: $211k (12.9% below list) — sets the bar for 1% rule.
- Cap rate 7.4% vs local median 4.3% in Flowood — top-decile yield for the area; either an underpriced asset or a hidden risk that comps aren't pricing in. Stress-test before assuming the spread holds.
Location & tenants
- Location reads 77/100 on livability (#10 in MS, #3,075 nationally) — a middle-class / working-renter tenant base. Strengths: crime A+, cost of living A+, housing A+; Watch: amenities F, commute F.
- Rankin County School District (rural): math 56% / reading 48% proficiency, ranked #6 of 130 in MS (top 5%) — acceptable for families but not a draw, mixed tenant base, ~2y average lease.
- Zoned schools: Flowood Elementary School (math 48% / reading 51%, grade D, #65 of 375 statewide, top 20%, 489 students, 99% FRL); Northwest Rankin Middle School (math 63% / reading 51%, grade B, #13 of 179 statewide, top 7%, 1,374 students, 100% FRL); Northwest Rankin High School (math 48% / reading 42%, grade D-, #34 of 197 statewide, top 17%, 1,898 students, 100% FRL) — zoned schools average 100% FRL vs 35% district-wide (65 pts higher); higher-poverty schools than district average — tighter screening recommended.
- Market conditions: Rents rising (+2.9%/yr); 433 active listings in the ZIP; 13 comparable units currently listed for rent nearby; rentals at typical pace (median 23d on market — plan ~3-4 weeks tenant-placement turnaround); 46% of comp listings sitting > 30 days — soft ceiling on asking rent; solid renter incomes; 343 units permitted in Rankin County in 2024 (0 in 5+ unit buildings).
Forward outlook
- Local home prices are declining (-3.0%/yr); year-one equity from $2k of loan paydown is wiped out by about $7k of value loss. Plan a longer hold.
- Rankin County population projected at +17% by 2050 — long-run rental-demand tailwind backs the buy-and-hold thesis.
Negotiation context
- Only 2 days on market — expect competitive offers; lowballing is unlikely to land.
- 2 sale attempts since 13y ago with the ask held roughly flat each time — persistent listings suggest the price (not the market) is what's stuck; bring a comps-based counter.
Risks & watch-outs
- Climate carrying-cost: severe wind risk, 80% chance of damaging wind over 30y; extreme-heat days projected 7→20/yr by 2055 (HVAC capex compounding) — expect insurance premiums to compound above CPI over the hold.
Questions for the listing agent
- What does the HOA fee cover, when was the last increase, and are there any pending special assessments or reserve-fund shortfalls?
- Is there a deadline driving the sale (1031 exchange, divorce, estate, relocation)? That informs how much negotiation room exists.
- Schools are B-rated — typically a magnet for longer-tenancy family renters. What's the average tenant stay here, and is there a school-zone premium baked into asking?
- What's the average days-on-market for RENTAL listings here right now (not sales)? A rising rental-DOM trend means longer vacancies and softer asking-rent achievability than the comps imply.
- What's the recent tenant-quality profile in this submarket — average credit score on applications, eviction rate, late-payment / NSF rate, and stable-employment percentage? A property-management company in the area should have these aggregated.
- How much new for-sale + rental construction is in the pipeline within 1–3 miles? Heavy new supply typically softens prices + rents 12–24 months out; constrained supply supports both.
Investment metrics
- 1% rule
- 0.87% ✗
- Cap rate
- 7.42%
- Cash-on-cash
- 4.01%
- DSCR
- 1.18
- GRM
- 9.6
CMA / ARV
- ARV (median comp)
- $262,694
- List price
- $242,000
- Delta
- -7.88%
- Verdict
- FAIR
- Comps
- 20 within 1.0 mi
Show comp detail 12 sales within ~0.75 mi
| Address | Dist | Beds/Ba | Sqft | Sold | Price | $/sf | Match |
|---|---|---|---|---|---|---|---|
| 422 Fenway Dr | 0.00mi | 3/2.0 | 1,308 (+2%) | 0mo | $242,000 | $185 | 97 |
| 309 Greensboro Dr | 0.07mi | 3/2.0 | 1,333 (+4%) | 6mo | $255,000 | $191 | 86 |
| 213 Ashton Way | 0.13mi | 3/2.0 | 1,403 (+9%) | 0mo | $273,500 | $195 | 79 |
| 425 Fenway Dr | 0.03mi | 3/2.0 | 1,423 (+10%) | 6mo | $245,000 | $172 | 76 |
| 212 Bedford Dr | 0.07mi | 3/2.0 | 1,413 (+10%) | 6mo | $249,900 | $177 | 75 |
| 509 Suffolk Cv | 0.21mi | 3/2.0 | 1,410 (+10%) | 1mo | $275,000 | $195 | 74 |
| 100 Summerdale Pl | 0.25mi | 3/2.0 | 1,440 (+12%) | 0mo | $287,000 | $199 | 68 |
| 318 Austin Cir | 0.30mi | 3/2.0 | 1,441 (+12%) | 5mo | $264,500 | $184 | 63 |
| 449 Spring Hill Pt | 0.31mi | 3/2.0 | 1,455 (+13%) | 8mo | $274,900 | $189 | 57 |
| 1401 Barnett Bend Cir | 0.62mi | 3/2.0 | 1,438 (+12%) | 3mo | $239,900 | $167 | 49 |
| 1441 Barnett Bend Cir | 0.67mi | 2/2.0 (-1) | 1,161 (-10%) | 2mo | $209,900 | $181 | 45 |
| 810 Windlass Cv | 0.67mi | 3/2.0 | 1,473 (+14%) | 6mo | $249,995 | $170 | 40 |
Match score weights: distance 35% · size 25% · config 20% · recency 20%. Top-matched comps best support the ARV.
Projected returns pro-forma
-3.0% appreciation · 2.9% rent growth · sell at horizon
- IRR
- -10.2%
- Equity multiple
- 0.63×
- Total profit
- $-25,122
- Equity at exit
- $36,083
- IRR
- -1.0%
- Equity multiple
- 0.93×
- Total profit
- $-4,634
- Equity at exit
- $20,924
Cash invested: $67,760 (down + closing). Projections, not guarantees.
Landlord ↔ Tenant lean methodology
- Overall (STATE)
- 90 Strongly Landlord-Friendly
- State Mississippi
- 90 Strongly Landlord-Friendly · R+11
- County
- — inherits STATE
- City
- — inherits STATE
ZIP-level market 39047
- Home prices YoY
- -32.6%
- Rents YoY
- 2.9%
- Active inventory
- 433
- Price-to-rent
- 9.6×
Monthly cashflow live
- Estimated rent
- $2,108 high interval (Pro) →
- Mortgage (P&I)
- −$1,269
- Tax from tax record
- −$56 /mo · $675/yr
- Insurance
- −$101
- HOA
- −$13
- Vacancy / Maint / Mgmt
- −$443
- Net cashflow
- $226
Break-even live
UW: 25.0% down · 7.5% · 30yr · 1.5% tax · 5.0% vac · 8.0% maint · 8.0% mgmt
Financing live
Cash to close
- Down payment
- $60,500
- Closing costs
- $7,260
- Reserves months
- —
- Total cash needed
- —
Loan-product check · same deal, 3 products live
Conventional
25% down · 7.5% · 30yr
- Down + closing
- —
- Monthly P&I
- —
- Monthly cashflow
- —
- DSCR
- —
- Eligible?
- —
Personal DTI + credit; lowest rate.
DSCR
20% down · 8.5% · 30yr
- Down + closing
- —
- Monthly P&I
- —
- Monthly cashflow
- —
- DSCR
- —
- Eligible?
- —
No personal income docs; deal must DSCR.
Hard money
10% down · 12.0% · 12mo
- Down + closing
- —
- Monthly P&I
- —
- Monthly cashflow
- —
- DSCR
- —
- Eligible?
- —
Short-term bridge; refi at stabilization.
Rent comps 13 comps
| Address | Beds | Baths | Sqft | Rent | $/sqft | DOM | Units | Dist |
|---|---|---|---|---|---|---|---|---|
| 301 Jasmine Ct Brandon, MS | 3.0 | 2.0 | 1805 | $2,200 | $1.22 | 43d | 1 | 0.03mi |
| 1204 Barnett Bend Cir Brandon, MS | 2.0 | 2.0 | 1127 | $1,625 | $1.44 | 21d | 1 | 0.58mi |
| 500 Avalon Way Brandon, MS | 2.0–3.0 | 2.0 | 1287 | $2,052 | $1.59 | 13d | 6 | 0.63mi |
| 154 Plum Tree Rd Brandon, MS | 3.0 | 2.0 | 1289 | $1,931 | $1.50 | 23d | 1 | 1.04mi |
| 508 Stockton Cv Flowood, MS | 3.0 | 2.0 | 1271 | $1,806 | $1.42 | 43d | 1 | 1.25mi |
| 352 Brendalwood Cv Brandon, MS | 2.0 | 1.5 | 1248 | $1,157 | $0.93 | 43d | 1 | 1.27mi |
| 199 Dogwood Cir Brandon, MS | 3.0 | 2.0 | 1550 | $1,900 | $1.23 | 44d | 1 | 1.29mi |
| 224 Jacks Pl Brandon, MS | 3.0 | 2.0 | 1512 | $2,100 | $1.39 | 43d | 1 | 1.37mi |
| 183 Cumberland Rd Brandon, MS | 3.0 | 2.0 | 1097 | $1,750 | $1.60 | 21d | 1 | 1.38mi |
| 218 Shenandoah Rd N Brandon, MS | 3.0 | 2.0 | 1625 | $2,006 | $1.23 | 43d | 1 | 1.40mi |
| 5201 Lakeland Blvd Flowood, MS | 1.0–3.0 | 1.0–2.0 | 1148 | $2,227 | $1.94 | 13d | 7 | 1.43mi |
| 111 Lakeshore Dr Brandon, MS | 1.0–3.0 | 1.0–2.0 | 974 | $2,218 | $2.28 | 13d | 8 | 1.45mi |
| 133 Cumberland Rd Brandon, MS | 4.0 | 3.0 | 1846 | $2,225 | $1.21 | 23d | 1 | 1.46mi |
HOA detail
- Monthly dues
- $13 · $156/yr
- Likely covers
- gas
Listing history 4 events
-
2026-05-09status Pending 734-char remark
-
2026-05-06$242,000 Active 734-char remark
-
2013-06-28soldstatus 407-char remark
Show marketing remark (407 chars)
Very pretty 3 bedroom 2 bath home with nice living area w/ gas fireplace nice wood floors big kitchen with lots of counter and cabinet space master is big and master bath is GREAT with double vanity jetted tub and sep stand up shower secondary bedrooms are a good sixe with good closets covered back porch and big nice backyard.. Home is located in a culdesac.. A must see.. Please call your realtor today!!
-
2013-05-20$154,000 407-char remark
Show marketing remark (407 chars)
Very pretty 3 bedroom 2 bath home with nice living area w/ gas fireplace nice wood floors big kitchen with lots of counter and cabinet space master is big and master bath is GREAT with double vanity jetted tub and sep stand up shower secondary bedrooms are a good sixe with good closets covered back porch and big nice backyard.. Home is located in a culdesac.. A must see.. Please call your realtor today!!
ⓘ Source: listings_history table (triggers on properties + properties_extension) + one-shot
backfill from property_details.listing_events for pre-trigger history.
Tax reassessment forecast MS · Resets to sale price
- Current annual tax
- $675 · $56/mo
- Projected year-2 tax
- $1,912 · $159/mo
- Expected delta
- +$1,236/yr (+$103/mo · 183.1%)
ⓘ Screening estimate from a state-policy table — verify with the county assessor before closing.
Climate risk First Street
- Flood 1/10 Low FEMA zone X (unshaded) · 0% chance over 30 yrs
- Wildfire 3/10 Moderate
- Heat 8/10 Severe 7 d/yr ≥108°F today · 20 d/yr by 30 yrs out
- Wind 8/10 Severe 80% chance of damaging wind over 30 yrs
- Air quality 2/10 Low 1 unhealthy d/yr today · 1 by 30 yrs out
Nearby sold comps map
Loading sold comps map…
Walkable amenities ~0.75 mi
Loading nearby amenities…
Taxation est. · year 1
- Rental income
- $25,299
- − Mortgage interest
- −$13,556
- − Property taxes
- −$675
- − Insurance
- −$1,210
- − Repairs & maintenance
- −$2,024
- − Management
- −$2,024
- − HOA
- −$156
- − Depreciation
- −$7,040
- Taxable loss
- −$1,386
- Est. tax savings @ 24.0%
- +$333
- After-tax cash flow
- $3,049/yr
For passive investors: Depreciation is non-cash, so a rental often shows a tax loss while cash-flowing — sheltering income. Rental losses are passive: they offset passive income freely, and up to $25,000/yr can offset ordinary (W-2) income if you actively participate and your MAGI is under $100k (phasing out to $0 by $150k); unused losses carry forward. On sale, claimed depreciation is recaptured at up to 25%, and gains may owe capital-gains tax (a 1031 exchange can defer both). Figures are a year-1 estimate at your 24.0% rate — not tax advice; consult a CPA.
Schools (NCES district)
- District
- Rankin County School District
- NCES district ID
- 2803830
- Math proficiency
- 56% ▼ -4.00%
- Reading proficiency
- 48% ▼ -6.00%
- Median HH income
- $61,867
- Composite
- 45.62/100
- National rank
- #2587
- State rank
- #6 of 130 in MS
Livability — Flowood
- Score
- 77/100
- State rank
- #10
- US rank
- #3075
Category grades
Schools grade is shown separately in the Schools card above.
Census & demographics
- County
- Rankin County · 123,614 people
- City population
- 9,222
- Metro
- Jackson, MS
- Population (ZIP)
- 40,808
- Household income
- $100,347
- Rent vs Own
- Severe rent burden
- 551.0
Population outlook (Rankin County) Hauer SSP2
- Today (2025)
- 164,317 people
- By 2030
- 171,013 · +4.1%
- By 2040
- 182,723 · +11.2%
- By 2050
- 192,376 · +17.1%
- By 2075
- 209,535 · +27.5%
- By 2100
- 209,534 · +27.5%
Race, ethnicity, and origin ACS 2023
- Neighborhood character
- Predominantly White (77%)
- Race & ethnicity
- White 77% Black 16% Two or more races 4% Hispanic / Latino 2% Asian 1%
- Common ancestry
- Italian 4% Slovak 3% Serbian 3%
- Foreign-born
- 3% · Canada
- Languages at home
- 95% English-only · Spanish 3% Other Indo-European 1% Other Asian/Pacific 1%
Political lean MEDSL · Rankin
- 2024 margin
- Solid R (+47.1) · D 25.9% · R 73.0% · Other 1.0%
- 2008→2024 swing
- +6.4pp toward D · 2008: -53.5pp · 2024: -47.1pp
- All cycles
- 2024: R+47.1 2020: R+45.4 2016: R+52.9 2012: R+51.9 2008: R+53.5
Not yet ingested
- Civics
- —
Market trends
- HPI YoY
- ▼ -79.01%
- Current HPI
- 162.9709
- Rent YoY
- ▲ 2.90%
- Metro
- Jackson, MS
- State GDP YoY
- —
- F500 in state
- 0
Price history
+57.1% since first listed5 events — show timeline
- 2026-06-15 Sold (MLS) — MLSU
- 2026-05-09 Pending — MLSU
- 2026-05-06 Listed $242,000 MLSU
- 2013-06-28 Sold (MLS) — MLSU
- 2013-05-20 Listed $154,000 MLSU
Property tax history
+1.4%/yrLatest (2025): $675 · +5.4% YoY. Source: county tax records.
Cash-flow waterfall
monthlySold comps — $/sqft
last 12 mo · ≤1 miLoading sold comps…