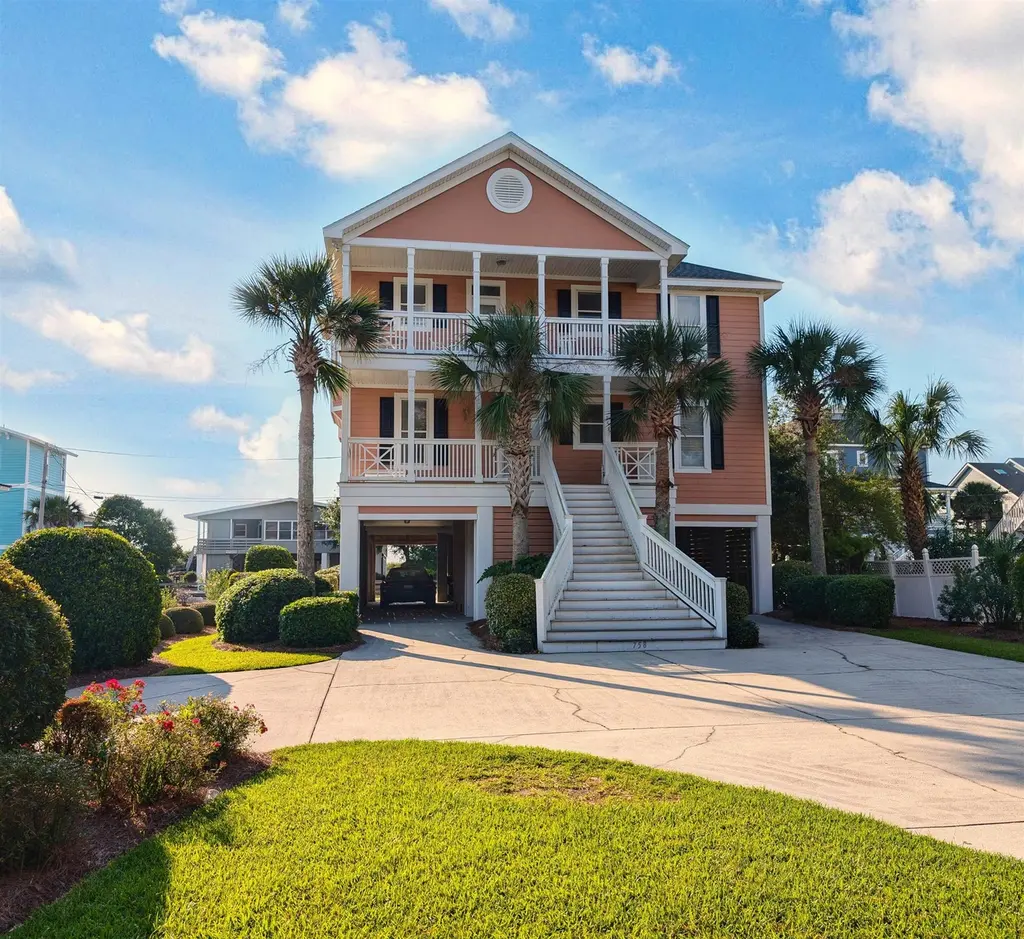
758 Interval Xiii (13) Parker Dr · Litchfield Beach, SC
Flood risk 9/10 · Severe
- FEMA flood zone
- AE
- Chance of flooding over 30 yrs
- 0.99%
- Est. flood insurance / yr
- $1,737 – $8,500
Fire risk 3/10 · Minor
- Est. fire insurance / yr
- $783 – $1,453
Heat risk 9/10 · Severe
- Hot days now (above 106°F)
- 7 days/yr
- Hot days in 30 yrs
- 17 days/yr
Wind risk 9/10 · Severe
- Chance of severe wind over 30 yrs
- 99.0%
Air-quality risk 2/10 · Minimal
- Unhealthy air days now
- 0 days/yr
- Unhealthy air days in 30 yrs
- 1 days/yr
Risk factors via First Street. Map © Google.
Why this score? — see what drove the B- grade
The composite is a weighted blend of 9 inputs, each scored 0–100. Each bar is that input's sub-score; the figure is the points it added to the 100-point composite (weight × sub-score).
- Cash flow +30.0/30.0
- 1% rule +10.0/10.0
- DSCR +10.0/10.0
- ARV discount +7.5/15.0
- Condition / age +3.8/5.0
- Schools +2.7/10.0
- Rent growth +2.5/5.0
- Livability +2.5/5.0
- Appreciation +0.0/10.0
$145,000
🖨 Deal sheet (PDF) 📄 Offer letter ✓ Due diligence
Listing remarks
Interval Ownership opportunity. Welcome to 758 Parker Drive in beautiful and highly coveted North Litchfield Beach. Experience coastal living at its finest with this exceptional 4-week interval ownership opportunity. Situated on the 2nd row just steps from the beach, enjoy the spacious and luxurious 6-bed, 6.5 bath home for a week in each season. The inverted floorplan offers plenty of space for relaxing and entertaining with ocean breezes from wide porches. Each private bedroom contains an en-suite bathroom, ensuring comfort for all guests. Enjoy beach days year-round with cozy nights by the fire in the cooler months all without the hassle of full-time ownership. The home owns its own golf
Key facts
- Parking
- Built 2000
- Listed 56 days
Property features AI
Finance
- Other: For sale
- HOA & community: Homeowners association with a $500 monthly fee; Elevator in the building
Exterior
- Parking: Covered parking
- Utilities: Cable available; Electricity available; Phone available; Sewer available; Public water
- Home design: Resale property
- Construction: HardiPlank-type siding; Raised foundation
- Exterior features: Located in a flood zone
Interior
- Kitchen: Dishwasher; Disposal; Microwave; Range; Range hood; Refrigerator; Breakfast bar; Stainless steel appliances; Kitchen exhaust fan
- Flooring: Carpet; Tile; Wood
- Bathrooms: 6 full bathrooms; 1 half bathroom
- Heating & cooling: Central air conditioning; Electric heating
- Interior features: Furnished; Tray ceilings; Ceiling fans; Fireplace; Breakfast bar; Stainless steel appliances
- Laundry & utility: Washer; Dryer
Neighborhood map
What this means for you Summary
Snapshot
- This is a 6-bed/6.5-bath single-family listed at $145k. Condition is rated good.
Deal economics
- At list price, monthly cash flow is $697 ($8k/yr) — positive.
- The deal already cash-flows at list — no discount required.
- Meets the 1% rule at list price ($3k rent vs $145k).
- Recommended offer: $141k (3.0% below list) — sets the bar for market timing.
- Cap rate 15.6% vs local median 1.8% in Litchfield Beach — top-decile yield for the area; either an underpriced asset or a hidden risk that comps aren't pricing in. Stress-test before assuming the spread holds.
Location & tenants
- Location reads: area grade B — affects rentability + tenant quality, not the cash-flow math above.
- Georgetown 01 (town): math 26% / reading 38% proficiency, ranked #51 of 80 in SC (top 64%) — families likely to look elsewhere, expect single-tenant / working-renter base with shorter leases.
- Zoned schools: Waccamaw Elementary (math 67% / reading 62%, grade B, #56 of 597 statewide, top 10%, 519 students, 100% FRL); Waccamaw Intermediate (math 53% / reading 56%, grade B-, #24 of 229 statewide, top 11%, 420 students, 43% FRL); Waccamaw High (math 42% / reading 93%, grade B, #72 of 196 statewide, top 36%, 858 students, 35% FRL) — zoned schools at 59% FRL track the district average.
- Zoned-school proficiency averages 62% at this address vs 32% district-wide (+30 pts) — the actual schools serving this property are materially stronger than the Georgetown 01 average implies; a family-tenant draw the district grade alone would hide.
- Market conditions: 398 active listings in the ZIP; 323 units permitted in Georgetown County in 2024 (0 in 5+ unit buildings).
Forward outlook
- Local home prices are declining (-3.0%/yr); year-one equity from $1k of loan paydown is wiped out by about $4k of value loss. Plan a longer hold.
- At projected returns (-3.0% appreciation + 3.0% rent growth), your $41k cash investment doubles in ~6 years — after that, you're playing with house money.
Negotiation context
- It's been on market 56 days — a 3% lower offer ($141k) is reasonable based on typical stale-listing flexibility.
Risks & watch-outs
- Watch-outs: flood insurance adds $427/mo.
- Climate carrying-cost: in FEMA flood zone AE (mandatory federal flood insurance); severe wind risk, 99% chance of damaging wind over 30y; extreme-heat days projected 7→17/yr by 2055 (HVAC capex compounding) — expect insurance premiums to compound above CPI over the hold.
Questions for the listing agent
- It's been on market 56 days. Have you received any prior offers? Is the seller open to a 3% concession, seller financing, or rate buy-down credit?
- What's the actual annual flood-insurance premium (NFIP or private), and is the property in a SFHA with mandatory coverage?
- What does the HOA fee cover, when was the last increase, and are there any pending special assessments or reserve-fund shortfalls?
- Is there a deadline driving the sale (1031 exchange, divorce, estate, relocation)? That informs how much negotiation room exists.
- What's the average days-on-market for RENTAL listings here right now (not sales)? A rising rental-DOM trend means longer vacancies and softer asking-rent achievability than the comps imply.
- What's the recent tenant-quality profile in this submarket — average credit score on applications, eviction rate, late-payment / NSF rate, and stable-employment percentage? A property-management company in the area should have these aggregated.
- How much new for-sale + rental construction is in the pipeline within 1–3 miles? Heavy new supply typically softens prices + rents 12–24 months out; constrained supply supports both.
Investment metrics
- 1% rule
- 2.29% ✓
- Cap rate
- 15.59%
- Cash-on-cash
- 33.21%
- DSCR
- 2.48
- GRM
- 3.6
CMA / ARV
- ARV (on-the-fly)
- $980,400
- Comps found
- 5
Show comp detail 5 sales within ~0.75 mi
| Address | Dist | Beds/Ba | Sqft | Sold | Price | $/sf | Match |
|---|---|---|---|---|---|---|---|
| 758 Parker Dr | 0.74mi | 6/6.5 | 3,268 (0%) | 11mo | $145,000 | $44 | 57 |
| 69 Belvedere Ln | 0.67mi | 6/6.5 | 3,558 (+9%) | 2mo | $1,850,000 | $520 | 53 |
| 166 Cayman Loop | 0.43mi | 5/3.5 (-1) | 3,502 (+7%) | 4mo | $1,050,000 | $300 | 48 |
| 308 Lot 2 Heron Marsh Dr | 0.50mi | 5/4.5 (-1) | 3,066 (-6%) | 10mo | $2,500,000 | $815 | 46 |
| 60 Sea View Loop | 0.70mi | 5/5.0 (-1) | 3,514 (+8%) | 18mo | $165,000 | $47 | 29 |
Match score weights: distance 35% · size 25% · config 20% · recency 20%. Top-matched comps best support the ARV.
Projected returns pro-forma
-3.0% appreciation · 3.0% rent growth · sell at horizon
- IRR
- 13.2%
- Equity multiple
- 1.53×
- Total profit
- $21,510
- Equity at exit
- $21,620
- IRR
- 22.3%
- Equity multiple
- 2.93×
- Total profit
- $78,402
- Equity at exit
- $12,537
Cash invested: $40,600 (down + closing). Projections, not guarantees.
Landlord ↔ Tenant lean methodology
- Overall (STATE)
- 90 Strongly Landlord-Friendly
- State South Carolina
- 90 Strongly Landlord-Friendly · R+6
- County
- — inherits STATE
- City
- — inherits STATE
ZIP-level market 29585
- Home prices YoY
- -29.0%
- Active inventory
- 398
- Price-to-rent
- 3.6×
Monthly cashflow live
- Estimated rent
- $3,323 medium interval (Pro) →
- Mortgage (P&I)
- −$760
- Tax est. 1.5%
- −$181 /mo · $2,175/yr
- Insurance
- −$60
- Flood insurance flood zone
- −$427 /mo · $5,118/yr
- HOA
- −$500
- Vacancy / Maint / Mgmt
- −$698
- Net cashflow
- $697
Break-even live
Sensitivity live
| Price | -10% $797 | -5% $747 | +0% $697 | +5% $647 | +10% $597 |
|---|---|---|---|---|---|
| Rent | -10% $434 | -5% $566 | +0% $697 | +5% $828 | +10% $959 |
| Rate | -1.0pp $770 | -0.5pp $734 | base $697 | +0.5pp $659 | +1.0pp $621 |
UW: 25.0% down · 7.5% · 30yr · 1.5% tax · 5.0% vac · 8.0% maint · 8.0% mgmt
Financing live
Cash to close
- Down payment
- $36,250
- Closing costs
- $4,350
- Reserves months
- —
- Total cash needed
- —
Loan-product check · same deal, 3 products live
Conventional
25% down · 7.5% · 30yr
- Down + closing
- —
- Monthly P&I
- —
- Monthly cashflow
- —
- DSCR
- —
- Eligible?
- —
Personal DTI + credit; lowest rate.
DSCR
20% down · 8.5% · 30yr
- Down + closing
- —
- Monthly P&I
- —
- Monthly cashflow
- —
- DSCR
- —
- Eligible?
- —
No personal income docs; deal must DSCR.
Hard money
10% down · 12.0% · 12mo
- Down + closing
- —
- Monthly P&I
- —
- Monthly cashflow
- —
- DSCR
- —
- Eligible?
- —
Short-term bridge; refi at stabilization.
HOA detail
- Monthly dues
- $500 · $6,000/yr
Listing history 8 events
-
2026-06-07statusdays on market $145,000 Pending 56 DOM
-
2026-06-03days on market $145,000 Active Under Contract 54 DOM
-
2026-06-02days on market $145,000 Active Under Contract 53 DOM
-
2026-06-01days on market $145,000 Active Under Contract 52 DOM
-
2026-05-31days on market $145,000 Active Under Contract 51 DOM
-
2026-05-30days on market $145,000 Active Under Contract 50 DOM
-
2026-04-27historical Active Under Contract
-
2026-04-10$145,000 Active
ⓘ Source: listings_history table (triggers on properties + properties_extension) + one-shot
backfill from property_details.listing_events for pre-trigger history.
Climate risk First Street
- Flood 9/10 Extreme FEMA zone AE · 99% chance over 30 yrs
- Wildfire 3/10 Moderate
- Heat 9/10 Extreme 7 d/yr ≥106°F today · 17 d/yr by 30 yrs out
- Wind 9/10 Extreme 99% chance of damaging wind over 30 yrs
- Air quality 2/10 Low 0 unhealthy d/yr today · 1 by 30 yrs out
Nearby sold comps map
Loading sold comps map…
Walkable amenities ~0.75 mi
Loading nearby amenities…
Taxation est. · year 1
- Rental income
- $39,881
- − Mortgage interest
- −$8,122
- − Property taxes
- −$2,175
- − Insurance
- −$5,844
- − Repairs & maintenance
- −$3,190
- − Management
- −$3,190
- − HOA
- −$6,000
- − Depreciation
- −$4,218
- Taxable income
- $7,141
- Est. tax owed @ 24.0%
- −$1,714
- After-tax cash flow
- $6,649/yr
For passive investors: Depreciation is non-cash, so a rental often shows a tax loss while cash-flowing — sheltering income. Rental losses are passive: they offset passive income freely, and up to $25,000/yr can offset ordinary (W-2) income if you actively participate and your MAGI is under $100k (phasing out to $0 by $150k); unused losses carry forward. On sale, claimed depreciation is recaptured at up to 25%, and gains may owe capital-gains tax (a 1031 exchange can defer both). Figures are a year-1 estimate at your 24.0% rate — not tax advice; consult a CPA.
Condition & rehab AI · 13 photos
This beachfront home offers a good condition with a good condition score of 75. It is in a cosmetic rehab level and requires minor maintenance and cosmetic updates to enhance its curb appeal and value.
Value-add opportunities
- Both Paint exterior siding — Enhances curb appeal and value
- Both Trim landscaping — Improves curb appeal and enhances property value
Renovation cost estimate screening
Value-add ROI direction
- Both Paint exterior siding — Enhances curb appeal and value ↑
- Both Trim landscaping — Improves curb appeal and enhances property value ↑
ⓘ Cost ranges are severity-bucket heuristics (US national rule-of-thumb). Get contractor quotes + a written scope before underwriting a rehab budget.
Schools (NCES district)
- District
- Georgetown 01
- NCES district ID
- 4502280
- Math proficiency
- 26% ▼ -11.00%
- Reading proficiency
- 38% ▼ -5.00%
- Median HH income
- $43,045
- Composite
- 27.15/100
- National rank
- #7030
- State rank
- #51 of 80 in SC
Livability — Litchfield Beach
No livability data for this city. (Only ~50 U.S. cities are tracked.)
Census & demographics
- Census place
- Litchfield Beach, SC
- Population (ZIP)
- 17,346
Population outlook (Georgetown County) Hauer SSP2
- Today (2025)
- 63,275 people
- By 2030
- 63,630 · +0.6%
- By 2040
- 63,130 · -0.2%
- By 2050
- 61,904 · -2.2%
- By 2075
- 59,305 · -6.3%
- By 2100
- 53,852 · -14.9%
Race, ethnicity, and origin ACS 2023
- Neighborhood character
- Predominantly White (86%)
- Race & ethnicity
- White 86% Black 7% Two or more races 4% Hispanic / Latino 3%
- Common ancestry
- Slovak 4% Romanian 3% Italian 3%
- Foreign-born
- 2% · Canada
- Languages at home
- 98% English-only · Spanish 1%
Political lean MEDSL · Georgetown
- 2024 margin
- R (+19.5) · D 39.6% · R 59.1% · Other 1.2%
- 2008→2024 swing
- -14.2pp toward R · 2008: -5.2pp · 2024: -19.5pp
- All cycles
- 2024: R+19.5 2020: R+12.7 2016: R+13.0 2012: R+7.6 2008: R+5.2
Not yet ingested
- Civics
- —
Market trends
- HPI YoY
- ▼ -86.24%
- Current HPI
- 211.3537
- Rent YoY
- —
- Metro
- —
- State GDP YoY
- ▲ 4.51%
- F500 in state
- 2
Industry mix (Fortune 500 HQ in SC)
| Industry | F500 HQs | Revenue |
|---|---|---|
| Packaging | 1 | $7B |
|
||
Price history
2 events — show timeline
- 2026-04-27 Contingent — CCAR
- 2026-04-10 Listed $145,000 CCAR
Cash-flow waterfall
monthlySold comps — $/sqft
last 12 mo · ≤1 miLoading sold comps…