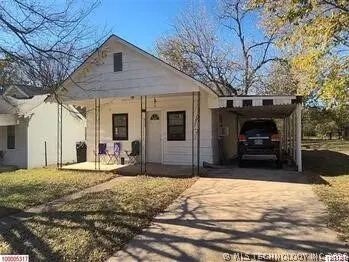
825 SE B St · Ardmore, OK
Flood risk 1/10 · Minimal
- FEMA flood zone
- X (unshaded)
- Chance of flooding over 30 yrs
- 0.0%
- Est. flood insurance / yr
- $507 – $1,088
Fire risk 5/10 · Moderate
- Est. fire insurance / yr
- $2,463 – $4,575
Heat risk 6/10 · Moderate
- Hot days now (above 112°F)
- 7 days/yr
- Hot days in 30 yrs
- 20 days/yr
Wind risk 4/10 · Minor
- Chance of severe wind over 30 yrs
- 12.0%
Air-quality risk 3/10 · Minor
- Unhealthy air days now
- 2 days/yr
- Unhealthy air days in 30 yrs
- 3 days/yr
Risk factors via First Street. Map © Google.
Why this score? — see what drove the B- grade
The composite is a weighted blend of 9 inputs, each scored 0–100. Each bar is that input's sub-score; the figure is the points it added to the 100-point composite (weight × sub-score).
- Cash flow +30.0/30.0
- 1% rule +10.0/10.0
- DSCR +10.0/10.0
- ARV discount +7.5/15.0
- Rent growth +4.3/5.0
- Livability +2.9/5.0
- Condition / age +2.5/5.0
- Schools +1.1/10.0
- Appreciation +0.0/10.0
$50,880
🖨 Deal sheet 📄 Offer letter ✓ Due diligence
Listing remarks
Charming 2-bed, 1-bath 1932 home on a spacious lot in Ardmore. This property features a welcoming covered front porch, classic wood exterior, and a solid concrete block foundation. The lot offers mature trees, a storage building, and carport + garage parking for added convenience. Located near Jefferson Elementary, Ardmore Middle School, and Ardmore High School. Great opportunity for a starter home, rental, or renovation project.
Key facts
- Covered front porch
- Storage building
- Carport
Tags
Property features AI
Finance
- Other: Lot size approximately 0.24 acres
- Financial info: Annual tax amount listed (details excluded per instructions)
- HOA & community: No HOA information provided
Exterior
- Parking: Attached garage (1 car)
- Security: No safety shelter
- Utilities: Public water; Public sewer; Utilities: Unknown
- Home design: Single-story home; Faces north
- Construction: Wood siding; Wood frame construction; Year built source: public records
- Exterior features: Covered patio
Interior
- Kitchen: Kitchen details not provided
- Bedrooms: Bedroom details not provided
- Flooring: Flooring details not provided
- Bathrooms: One full bathroom
- Heating & cooling: Central heating (electric); Central air conditioning
- Interior features: No notable interior features listed
- Laundry & utility: Laundry details not provided
Neighborhood map
What this means for you Summary
Snapshot
- This is a 2-bed/1.0-bath single-family listed at $51k.
Deal economics
- At list price, monthly cash flow is $603 ($7k/yr) — positive.
- The deal already cash-flows at list — no discount required.
- Meets the 1% rule at list price ($1k rent vs $51k).
- Recommended offer: $49k (3.0% below list) — sets the bar for market timing.
- Cap rate 20.5% vs local median 4.6% in Ardmore — top-decile yield for the area; either an underpriced asset or a hidden risk that comps aren't pricing in. Stress-test before assuming the spread holds.
Location & tenants
- Location reads 58/100 on livability (#447 in OK) — a working-class tenant base; expect higher turnover. Strengths: cost of living A+, housing A+; Watch: schools F, crime F, amenities F.
- Ardmore (town): math 12% / reading 15% proficiency, ranked #241 of 270 in OK (top 89%) — low school quality limits family demand, transient renter base, plan for 1-2y turnover; 73% free/reduced lunch — lower-income household profile, screen leases tightly.
- Market conditions: Rents rising fast (+7.4%/yr); 379 active listings in the ZIP; 73 units permitted in Carter County in 2024 (0 in 5+ unit buildings).
Forward outlook
- Local home prices are declining (-3.0%/yr); year-one equity from $352 of loan paydown is wiped out by about $2k of value loss. Plan a longer hold.
- Carter County population projected at +9% by 2050 — modest demand growth; plan on rents tracking national, not racing it.
- At projected returns (-3.0% appreciation + 7.4% rent growth), your $14k cash investment doubles in ~3 years — after that, you're playing with house money.
Negotiation context
- It's been on market 37 days — a 3% lower offer ($49k) is reasonable based on typical stale-listing flexibility.
Risks & watch-outs
- Watch-outs: built in 1932 — expect roof / HVAC / electrical / plumbing capex.
- Climate carrying-cost: moderate wildfire risk; extreme-heat days projected 7→20/yr by 2055 (HVAC capex compounding) — expect insurance premiums to compound above CPI over the hold.
Questions for the listing agent
- It's been on market 37 days. Have you received any prior offers? Is the seller open to a 3% concession, seller financing, or rate buy-down credit?
- Built in 1932 — when were the roof, HVAC, electrical panel, plumbing, and water heater last replaced?
- Is there a deadline driving the sale (1031 exchange, divorce, estate, relocation)? That informs how much negotiation room exists.
- Schools are F-rated, which usually means shorter tenancies and higher turnover. Who's the typical renter profile here, and what's been the actual vacancy rate?
- Crime grade is F in this area — have there been break-ins, vandalism, or insurance claims at this property in the last 3 years? What carrier currently insures it and at what premium?
- What's the average days-on-market for RENTAL listings here right now (not sales)? A rising rental-DOM trend means longer vacancies and softer asking-rent achievability than the comps imply.
- What's the recent tenant-quality profile in this submarket — average credit score on applications, eviction rate, late-payment / NSF rate, and stable-employment percentage? A property-management company in the area should have these aggregated.
- How much new for-sale + rental construction is in the pipeline within 1–3 miles? Heavy new supply typically softens prices + rents 12–24 months out; constrained supply supports both.
Investment metrics
- 1% rule
- 2.31% ✓
- Cap rate
- 20.52%
- Cash-on-cash
- 50.80%
- DSCR
- 3.26
- GRM
- 3.6
CMA / ARV
- ARV (on-the-fly)
- $109,158
- Comps found
- 12
Show comp detail 12 sales within ~0.75 mi
| Address | Dist | Beds/Ba | Sqft | Sold | Price | $/sf | Match |
|---|---|---|---|---|---|---|---|
| 808 B St SE | 0.03mi | 3/1.0 (+1) | 936 (-3%) | 2mo | $75,000 | $80 | 87 |
| 1000 Hugo SE | 0.16mi | 3/1.0 (+1) | 972 (+1%) | 1mo | $110,000 | $113 | 85 |
| 613 F St SW | 0.39mi | 3/1.0 (+1) | 990 (+2%) | 4mo | $90,000 | $91 | 69 |
| 441 Carter St SE | 0.40mi | 2/1.0 | 1,025 (+6%) | 3mo | $92,000 | $90 | 69 |
| 1104 Potter SE | 0.24mi | 3/1.0 (+1) | 1,023 (+6%) | 7mo | $134,000 | $131 | 68 |
| 1002 SW Howard St | 0.35mi | 2/1.0 | 1,056 (+9%) | 0mo | $125,000 | $118 | 68 |
| 402 E St NW | 0.54mi | 2/1.0 | 996 (+3%) | 5mo | $102,000 | $102 | 65 |
| 827 SE A | 0.08mi | 2/2.0 | 852 (-12%) | 12mo | $129,900 | $152 | 62 |
| 426 E St SE | 0.51mi | 2/1.0 | 1,044 (+8%) | 6mo | $85,000 | $81 | 58 |
| 1118 Heath SE | 0.42mi | 3/1.0 (+1) | 1,053 (+9%) | 4mo | $90,000 | $85 | 58 |
| 528 E Lake Murray Dr | 0.46mi | 2/2.0 | 920 (-5%) | 13mo | $129,900 | $141 | 55 |
| 306 G St SE | 0.70mi | 3/2.0 (+1) | 1,032 (+7%) | 9mo | $129,000 | $125 | 40 |
Match score weights: distance 35% · size 25% · config 20% · recency 20%. Top-matched comps best support the ARV.
Projected returns pro-forma
-3.0% appreciation · 7.38% rent growth · sell at horizon
- IRR
- 53.4%
- Equity multiple
- 3.50×
- Total profit
- $35,570
- Equity at exit
- $7,586
- IRR
- 60.2%
- Equity multiple
- 8.35×
- Total profit
- $104,694
- Equity at exit
- $4,399
Cash invested: $14,246 (down + closing). Projections, not guarantees.
Landlord ↔ Tenant lean methodology
- Overall (STATE)
- 83 Strongly Landlord-Friendly
- State Oklahoma
- 83 Strongly Landlord-Friendly · R+20
- County
- — inherits STATE
- City
- — inherits STATE
ZIP-level market 73401
- Home prices YoY
- -21.7%
- Rents YoY
- 7.4%
- Active inventory
- 379
- Price-to-rent
- 3.6×
Monthly cashflow live
- Estimated rent
- $1,173 medium interval (Pro) →
- Mortgage (P&I)
- −$267
- Tax from tax record
- −$36 /mo · $429/yr
- Insurance
- −$21
- HOA
- −$0
- Vacancy / Maint / Mgmt
- −$246
- Net cashflow
- $603
Break-even live
UW: 25.0% down · 7.5% · 30yr · 1.5% tax · 5.0% vac · 8.0% maint · 8.0% mgmt
Financing live
Cash to close
- Down payment
- $12,720
- Closing costs
- $1,526
- Reserves months
- —
- Total cash needed
- —
Loan-product check · same deal, 3 products live
Conventional
25% down · 7.5% · 30yr
- Down + closing
- —
- Monthly P&I
- —
- Monthly cashflow
- —
- DSCR
- —
- Eligible?
- —
Personal DTI + credit; lowest rate.
DSCR
20% down · 8.5% · 30yr
- Down + closing
- —
- Monthly P&I
- —
- Monthly cashflow
- —
- DSCR
- —
- Eligible?
- —
No personal income docs; deal must DSCR.
Hard money
10% down · 12.0% · 12mo
- Down + closing
- —
- Monthly P&I
- —
- Monthly cashflow
- —
- DSCR
- —
- Eligible?
- —
Short-term bridge; refi at stabilization.
Listing history 1 events
-
2026-04-20$50,880 Active
ⓘ Source: listings_history table (triggers on properties + properties_extension) + one-shot
backfill from property_details.listing_events for pre-trigger history.
Tax reassessment forecast OK · Resets to sale price
- Current annual tax
- $429 · $36/mo
- Projected year-2 tax
- $458 · $38/mo
- Expected delta
- +$29/yr (+$2/mo · 6.7%)
ⓘ Screening estimate from a state-policy table — verify with the county assessor before closing.
Climate risk First Street
- Flood 1/10 Low FEMA zone X (unshaded) · 0% chance over 30 yrs
- Wildfire 5/10 Major
- Heat 6/10 Major 7 d/yr ≥112°F today · 20 d/yr by 30 yrs out
- Wind 4/10 Moderate 12% chance of damaging wind over 30 yrs
- Air quality 3/10 Moderate 2 unhealthy d/yr today · 3 by 30 yrs out
Nearby sold comps map
Loading sold comps map…
Walkable amenities ~0.75 mi
Loading nearby amenities…
Taxation est. · year 1
- Rental income
- $14,080
- − Mortgage interest
- −$2,850
- − Property taxes
- −$429
- − Insurance
- −$254
- − Repairs & maintenance
- −$1,126
- − Management
- −$1,126
- − Depreciation
- −$1,480
- Taxable income
- $6,813
- Est. tax owed @ 24.0%
- −$1,635
- After-tax cash flow
- $5,603/yr
For passive investors: Depreciation is non-cash, so a rental often shows a tax loss while cash-flowing — sheltering income. Rental losses are passive: they offset passive income freely, and up to $25,000/yr can offset ordinary (W-2) income if you actively participate and your MAGI is under $100k (phasing out to $0 by $150k); unused losses carry forward. On sale, claimed depreciation is recaptured at up to 25%, and gains may owe capital-gains tax (a 1031 exchange can defer both). Figures are a year-1 estimate at your 24.0% rate — not tax advice; consult a CPA.
Schools (NCES district)
- District
- Ardmore
- NCES district ID
- 4003180
- Math proficiency
- 12% ▼ -7.00%
- Reading proficiency
- 15% ▼ -6.00%
- Median HH income
- $35,194
- Composite
- 11.1/100
- National rank
- #9733
- State rank
- #241 of 270 in OK
Livability — Ardmore
- Score
- 58/100
- State rank
- #447
- US rank
- #21387
Category grades
Schools grade is shown separately in the Schools card above.
Census & demographics
- Census place
- Ardmore, OK
- County
- Carter County · 36,833 people
- City population
- 36,833
- Metro
- Ardmore, OK
- Population (ZIP)
- 36,833
- Household income
- $61,989
- Rent vs Own
- Severe rent burden
- 1026.0
Population outlook (Carter County) Hauer SSP2
- Today (2025)
- 50,892 people
- By 2030
- 51,913 · +2.0%
- By 2040
- 53,857 · +5.8%
- By 2050
- 55,604 · +9.3%
- By 2075
- 60,670 · +19.2%
- By 2100
- 62,366 · +22.5%
Race, ethnicity, and origin ACS 2023
- Neighborhood character
- Diverse neighborhood (Simpson 0.57)
- Race & ethnicity
- White 65% Two or more races 14% Hispanic / Latino 9% Native American 8% Black 7% Asian 1%
- Hispanic origin (detail)
- Mexican 7%
- Common ancestry
- Slovak 2% Lithuanian 1% Italian 1%
- Foreign-born
- 4% · Canada
- Languages at home
- 92% English-only · Spanish 5%
Political lean MEDSL · Carter
- 2024 margin
- Solid R (+54.7) · D 21.9% · R 76.7% · Other 1.4%
- 2008→2024 swing
- -14.2pp toward R · 2008: -40.5pp · 2024: -54.7pp
- All cycles
- 2024: R+54.7 2020: R+52.5 2016: R+52.6 2012: R+42.7 2008: R+40.5
Not yet ingested
- Civics
- —
Market trends
- HPI YoY
- ▼ -74.93%
- Current HPI
- 269.7381
- Rent YoY
- ▲ 7.38%
- Metro
- Ardmore, OK
- State GDP YoY
- ▲ 1.55%
- F500 in state
- 6
Industry mix (Fortune 500 HQ in OK)
| Industry | F500 HQs | Revenue |
|---|---|---|
| Energy | 3 | $48B |
|
||
Price history
1 event — show timeline
- 2026-04-20 Listed $50,880 MLS Technology, Inc.
Property tax history
+7.5%/yrLatest (2025): $429 · +4.9% YoY. Source: county tax records.
Cash-flow waterfall
monthlySold comps — $/sqft
last 12 mo · ≤1 miLoading sold comps…