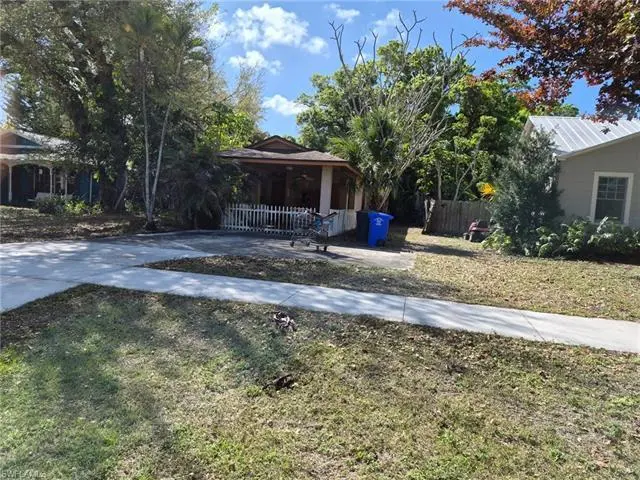
1826 Sunset Pl · Fort Myers, FL
Flood risk 3/10 · Minor
- FEMA flood zone
- X (unshaded)
- Chance of flooding over 30 yrs
- 0.09%
- Est. flood insurance / yr
- $507 – $1,088
Fire risk 1/10 · Minimal
- Est. fire insurance / yr
- $947 – $1,759
Heat risk 10/10 · Severe
- Hot days now (above 107°F)
- 7 days/yr
- Hot days in 30 yrs
- 30 days/yr
Wind risk 10/10 · Severe
- Chance of severe wind over 30 yrs
- 99.0%
Air-quality risk 2/10 · Minimal
- Unhealthy air days now
- 1 days/yr
- Unhealthy air days in 30 yrs
- 1 days/yr
Risk factors via First Street. Map © Google.
Why this score? — see what drove the B- grade
The composite is a weighted blend of 9 inputs, each scored 0–100. Each bar is that input's sub-score; the figure is the points it added to the 100-point composite (weight × sub-score).
- Cash flow +24.7/30.0
- ARV discount +15.0/15.0
- DSCR +8.0/10.0
- 1% rule +5.2/10.0
- Livability +4.3/5.0
- Schools +4.1/10.0
- Condition / age +2.5/5.0
- Rent growth +1.7/5.0
- Appreciation +0.0/10.0
$199,900
🖨 Deal sheet (PDF) 📄 Offer letter ✓ Due diligence
Listing remarks
Motivated seller—priced for a quick sale! This handyman special is a prime value-add opportunity perfect for investors, flippers, or buyers looking to build instant equity. Featuring a roof replaced in 2017, you can focus on cosmetic upgrades and maximize your ROI. Situated on regular lot with mature tree and room for outdoor living. Located in a high-demand Southwest Florida area with strong rental income and resale potential. Sold as-is.
Key facts
- 6,490 sq ft lot
- Garage
- Built 1976
Neighborhood map
What this means for you Summary
Snapshot
- This is a 3-bed/2.0-bath single-family listed at $200k.
Deal economics
- At list price, monthly cash flow is $418 ($5k/yr) — positive.
- The deal already cash-flows at list — no discount required.
- Meets the 1% rule at list price ($2k rent vs $200k).
- Recommended offer: $197k (1.5% below list) — sets the bar for market timing.
- Cap rate 8.8% vs local median 3.0% in Fort Myers — top-decile yield for the area; either an underpriced asset or a hidden risk that comps aren't pricing in. Stress-test before assuming the spread holds.
Location & tenants
- Location reads 86/100 on livability (#14 in FL, #383 nationally) — a professional / high-income tenant draw. Strengths: amenities A+, commute A+, housing A+.
- Lee (suburban): math 47% / reading 50% proficiency, ranked #42 of 73 in FL (top 58%) — families likely to look elsewhere, expect single-tenant / working-renter base with shorter leases.
- Market conditions: Rents falling (-3.2%/yr); 286 active listings in the ZIP; 40 comparable units currently listed for rent nearby; rentals at typical pace (median 25d on market — plan ~3-4 weeks tenant-placement turnaround); 15,411 units permitted in Lee County in 2024 (4,686 in 5+ unit buildings).
- At $2,048/mo this rent would consume 47% of the median local household income ($52k/yr) (locally 1782% of renters already pay >50% of income on rent) — very limited rent-growth headroom before tenants either downsize or default.
Forward outlook
- Local home prices are declining (-3.0%/yr); year-one equity from $1k of loan paydown is wiped out by about $6k of value loss. Plan a longer hold.
- Lee County population projected at +44% by 2050 — long-run rental-demand tailwind backs the buy-and-hold thesis.
Negotiation context
- It's been on market 18 days — a 2% lower offer ($197k) is reasonable based on typical stale-listing flexibility.
- Current owner paid $63k; list at $200k implies a 217% gain — meaningful room to come down on a strong offer.
Risks & watch-outs
- Climate carrying-cost: severe wind risk, 99% chance of damaging wind over 30y; extreme-heat days projected 7→30/yr by 2055 (HVAC capex compounding) — expect insurance premiums to compound above CPI over the hold.
Questions for the listing agent
- Built in 1976 — when were the roof, HVAC, electrical panel, plumbing, and water heater last replaced?
- Is there a deadline driving the sale (1031 exchange, divorce, estate, relocation)? That informs how much negotiation room exists.
- What's the average days-on-market for RENTAL listings here right now (not sales)? A rising rental-DOM trend means longer vacancies and softer asking-rent achievability than the comps imply.
- What's the recent tenant-quality profile in this submarket — average credit score on applications, eviction rate, late-payment / NSF rate, and stable-employment percentage? A property-management company in the area should have these aggregated.
- How much new for-sale + rental construction is in the pipeline within 1–3 miles? Heavy new supply typically softens prices + rents 12–24 months out; constrained supply supports both.
Investment metrics
- 1% rule
- 1.02% ✓
- Cap rate
- 8.80%
- Cash-on-cash
- 8.96%
- DSCR
- 1.40
- GRM
- 8.1
CMA / ARV
- ARV (on-the-fly)
- $344,430
- Comps found
- 12
Show comp detail 12 sales within ~0.75 mi
| Address | Dist | Beds/Ba | Sqft | Sold | Price | $/sf | Match |
|---|---|---|---|---|---|---|---|
| 3018 Sunset Rd | 0.06mi | 3/1.5 | 1,334 (-0%) | 10mo | $265,000 | $199 | 86 |
| 2930 Mccann St | 0.25mi | 3/2.0 | 1,323 (-1%) | 11mo | $379,590 | $287 | 78 |
| 1735 Sunset Pl | 0.11mi | 3/2.0 | 1,383 (+4%) | 19mo | $372,500 | $269 | 73 |
| 1640 Hanson St | 0.23mi | 3/2.0 | 1,398 (+5%) | 12mo | $375,000 | $268 | 71 |
| 1541 Grace | 0.44mi | 3/2.0 | 1,290 (-3%) | 9mo | $260,000 | $202 | 66 |
| 1557 Moreno Ave | 0.38mi | 3/2.0 | 1,482 (+11%) | 2mo | $316,000 | $213 | 62 |
| 1575 Grace Ave | 0.40mi | 3/1.5 | 1,281 (-4%) | 14mo | $355,400 | $277 | 61 |
| 1446 Poinciana Ave | 0.61mi | 3/1.0 | 1,412 (+6%) | 1mo | $365,000 | $258 | 57 |
| 1844 Passaic Ave | 0.31mi | 3/2.0 | 1,494 (+12%) | 16mo | $320,000 | $214 | 52 |
| 1465 Linhart Ave | 0.52mi | 2/1.5 (-1) | 1,453 (+9%) | 4mo | $260,500 | $179 | 51 |
| 3347 Cortez Blvd | 0.48mi | 3/2.5 | 1,504 (+13%) | 15mo | $300,000 | $199 | 42 |
| 1481 Cordova Ave | 0.52mi | 3/2.0 | 1,466 (+10%) | 21mo | $534,500 | $365 | 42 |
Match score weights: distance 35% · size 25% · config 20% · recency 20%. Top-matched comps best support the ARV.
Projected returns pro-forma
-3.0% appreciation · 0.0% rent growth · sell at horizon
- IRR
- -5.9%
- Equity multiple
- 0.79×
- Total profit
- $-11,851
- Equity at exit
- $29,806
- IRR
- 0.1%
- Equity multiple
- 1.01×
- Total profit
- $439
- Equity at exit
- $17,284
Cash invested: $55,972 (down + closing). Projections, not guarantees.
Landlord ↔ Tenant lean methodology
- Overall (STATE)
- 87 Strongly Landlord-Friendly
- State Florida
- 87 Strongly Landlord-Friendly · R+3
- County
- — inherits STATE
- City
- — inherits STATE
ZIP-level market 33901
- Home prices YoY
- -25.9%
- Rents YoY
- -3.2%
- Active inventory
- 286
- Price-to-rent
- 8.1×
Monthly cashflow live
- Estimated rent
- $2,048 high interval (Pro) →
- Mortgage (P&I)
- −$1,048
- Tax from tax record
- −$69 /mo · $822/yr
- Insurance
- −$83
- HOA
- −$0
- Vacancy / Maint / Mgmt
- −$430
- Net cashflow
- $418
Break-even live
Sensitivity live
| Price | -10% $531 | -5% $475 | +0% $418 | +5% $361 | +10% $305 |
|---|---|---|---|---|---|
| Rent | -10% $256 | -5% $337 | +0% $418 | +5% $499 | +10% $580 |
| Rate | -1.0pp $519 | -0.5pp $469 | base $418 | +0.5pp $366 | +1.0pp $314 |
UW: 25.0% down · 7.5% · 30yr · 1.5% tax · 5.0% vac · 8.0% maint · 8.0% mgmt
Financing live
Cash to close
- Down payment
- $49,975
- Closing costs
- $5,997
- Reserves months
- —
- Total cash needed
- —
Loan-product check · same deal, 3 products live
Conventional
25% down · 7.5% · 30yr
- Down + closing
- —
- Monthly P&I
- —
- Monthly cashflow
- —
- DSCR
- —
- Eligible?
- —
Personal DTI + credit; lowest rate.
DSCR
20% down · 8.5% · 30yr
- Down + closing
- —
- Monthly P&I
- —
- Monthly cashflow
- —
- DSCR
- —
- Eligible?
- —
No personal income docs; deal must DSCR.
Hard money
10% down · 12.0% · 12mo
- Down + closing
- —
- Monthly P&I
- —
- Monthly cashflow
- —
- DSCR
- —
- Eligible?
- —
Short-term bridge; refi at stabilization.
Rent comps 40 comps
| Address | Beds | Baths | Sqft | Rent | $/sqft | DOM | Units | Dist |
|---|---|---|---|---|---|---|---|---|
| 1661 Coronado Rd Fort Myers, FL | 3.0 | 2.0 | 1144 | $3,000 | $2.62 | 24d | 1 | 0.22mi |
| 2922 McCann St Fort Myers, FL | 3.0 | 2.0 | 1323 | $2,550 | $1.93 | 24d | 1 | 0.30mi |
| 1849 Maravilla Ave Fort Myers, FL | 2.0 | 2.0 | 956 | $1,375 | $1.44 | 2d | 2 | 0.37mi |
| 1535 Ransom St Fort Myers, FL | 3.0 | 2.0 | 1104 | $2,400 | $2.17 | 24d | 1 | 0.39mi |
| 2103 Unity Ave Fort Myers, FL | 4.0 | 2.0 | 1456 | $1,900 | $1.30 | 24d | 1 | 0.41mi |
| 1830 Maravilla Ave Fort Myers, FL | 1.0–2.0 | 1.0–2.0 | 785 | $1,290 | $1.64 | 3d | 8 | 0.41mi |
| 1830 Maravilla Ave Fort Myers, FL | 1.0–2.0 | 1.0–2.0 | 809 | $1,290 | $1.59 | 15d | 9 | 0.41mi |
| 1449 Braman Ave Fort Myers, FL | 2.0 | 1.0 | 1332 | $3,000 | $2.25 | 4d | 1 | 0.50mi |
| 1449 Braman Ave Fort Myers, FL | 2.0 | 1.0 | 1339 | $2,800 | $2.09 | 24d | 1 | 0.50mi |
| 2920 Jackson St Fort Myers, FL | 2.0 | 1.5 | 980 | $1,200 | $1.22 | 4d | 1 | 0.58mi |
| 2828 Jackson St Fort Myers, FL | 2.0 | 2.0 | 1159 | $1,438 | $1.24 | 4d | 5 | 0.58mi |
| 1350 Miracle Ln Fort Myers, FL | 3.0 | 1.5 | 1350 | $2,800 | $2.07 | 14d | 1 | 0.64mi |
| 2817 Jackson St Fort Myers, FL | 3.0 | 2.0 | 1200 | $2,200 | $1.83 | 24d | 1 | 0.65mi |
| 2524 Congress St Unit 7 Fort Myers, FL | 2.0 | 1.0 | 928 | $1,400 | $1.51 | 24d | 1 | 0.67mi |
| 2405 Hanson St Fort Myers, FL | 2.0 | 1.0 | 882 | $1,125 | $1.28 | 2d | 2 | 0.70mi |
| 1442 Olmeda Way Fort Myers, FL | 2.0 | 2.0 | 1311 | $2,400 | $1.83 | 4d | 1 | 0.73mi |
| 2822 Central Ave Fort Myers, FL | 3.0 | 2.0 | 1641 | $1,100 | $0.67 | 24d | 1 | 0.73mi |
| 2710 McGregor Blvd Fort Myers, FL | 2.0 | 2.0 | 1680 | $4,500 | $2.68 | 2d | 1 | 0.74mi |
| 2148 Dora St Unit 12 Fort Myers, FL | 2.0 | 1.0 | 912 | $1,350 | $1.48 | 24d | 1 | 0.74mi |
| 1927 Hill Ave Unit 8 Fort Myers, FL | 2.0 | 2.0 | 880 | $1,150 | $1.31 | 24d | 1 | 0.76mi |
| 2408 Euclid Ave Fort Myers, FL | 3.0 | 2.0 | 1347 | $3,975 | $2.95 | 24d | 1 | 0.80mi |
| 33 Broadway Cir Fort Myers, FL | 3.0 | 2.0 | 1122 | $1,800 | $1.60 | 17d | 1 | 0.84mi |
| 2121 Collier Ave Fort Myers, FL | 2.0 | 2.0 | 958 | $1,375 | $1.44 | 12d | 4 | 0.91mi |
| 2121 Collier Ave Fort Myers, FL | 2.0 | 2.0 | 958 | $1,448 | $1.51 | 4d | 3 | 0.91mi |
| 3736 Luzon St Fort Myers, FL | 3.0 | 2.0 | 1372 | $1,801 | $1.31 | 4d | 1 | 0.94mi |
| 3704 Broadway #101 Fort Myers, FL | 2.0 | 1.0 | 910 | $1,100 | $1.21 | 24d | 1 | 0.96mi |
| 3706 Broadway Unit A29 Fort Myers, FL | 2.0 | 2.0 | 949 | $1,250 | $1.32 | 24d | 1 | 0.98mi |
| 3706 Broadway #30 Fort Myers, FL | 2.0 | 2.0 | 962 | $1,100 | $1.14 | 24d | 1 | 0.98mi |
| 3706 Broadway #29 Fort Myers, FL | 2.0 | 2.0 | 949 | $1,150 | $1.21 | 4d | 1 | 0.98mi |
| 3585 Central Ave Fort Myers, FL | 1.0–2.0 | 1.0–2.0 | 1000 | $1,450 | $1.45 | 24d | 1 | 0.99mi |
| 2135 Virginia Ave #11 Fort Myers, FL | 2.0 | 1.5 | 924 | $1,500 | $1.62 | 24d | 1 | 1.00mi |
| 2525 Royal Palm Ave Fort Myers, FL | 2.0 | 1.0 | 900 | $1,550 | $1.72 | 24d | 1 | 1.02mi |
| 2243 Euclid Ave Fort Myers, FL | 2.0 | 1.0 | 1000 | $1,500 | $1.50 | 24d | 1 | 1.02mi |
| 3835 Lake St Fort Myers, FL | 3.0 | 1.0 | 976 | $1,350 | $1.38 | 12d | 1 | 1.03mi |
| 3835 Arlington St Fort Myers, FL | 2.0 | 1.0 | 1062 | $1,850 | $1.74 | 24d | 1 | 1.07mi |
| 1905 Winkler Ave Unit 7 Fort Myers, FL | 2.0 | 1.0 | 1000 | $1,400 | $1.40 | 24d | 1 | 1.11mi |
| 2250 McGregor Blvd Fort Myers, FL | 2.0 | 1.0–2.0 | 927 | $2,145 | $2.31 | 2d | 18 | 1.11mi |
| 2350 W First St Fort Myers, FL | 1.0–4.0 | 1.0–2.0 | 1344 | $1,490 | $1.11 | 22d | 2 | 1.12mi |
| 3726 Central Ave Fort Myers, FL | 1.0–2.0 | 1.0–2.0 | 907 | $1,700 | $1.87 | 24d | 1 | 1.13mi |
| 2330 Hoople St Fort Myers, FL | 3.0 | 2.0 | 1250 | $1,750 | $1.40 | 17d | 1 | 1.18mi |
Listing history 13 events
-
2026-06-13statusdays on market $199,900 Pending 18 DOM
-
2026-06-10days on market $199,900 Active 17 DOM
-
2026-06-09days on market $199,900 Active 16 DOM
-
2026-06-08days on market $199,900 Active 15 DOM
-
2026-06-07days on market $199,900 Active 14 DOM
-
2026-06-03days on market $199,900 Active 10 DOM
-
2026-06-02days on market $199,900 Active 9 DOM
-
2026-06-01days on market $199,900 Active 8 DOM
-
2026-05-31statusdays on market $199,900 Active 7 DOM
-
2026-04-23price $199,900
-
2026-04-13status Pending
-
2026-04-07$199,000 Active
-
1994-11-01soldstatus $63,100
ⓘ Source: listings_history table (triggers on properties + properties_extension) + one-shot
backfill from property_details.listing_events for pre-trigger history.
Tax reassessment forecast FL · Resets to sale price
- Current annual tax
- $822 · $69/mo
- Projected year-2 tax
- $1,659 · $138/mo
- Expected delta
- +$837/yr (+$70/mo · 101.8%)
ⓘ Screening estimate from a state-policy table — verify with the county assessor before closing.
Climate risk First Street
- Flood 3/10 Moderate FEMA zone X (unshaded) · 9% chance over 30 yrs
- Wildfire 1/10 Low
- Heat 10/10 Extreme 7 d/yr ≥107°F today · 30 d/yr by 30 yrs out
- Wind 10/10 Extreme 99% chance of damaging wind over 30 yrs
- Air quality 2/10 Low 1 unhealthy d/yr today · 1 by 30 yrs out
Nearby sold comps map
Loading sold comps map…
Walkable amenities ~0.75 mi
Loading nearby amenities…
Taxation est. · year 1
- Rental income
- $24,579
- − Mortgage interest
- −$11,198
- − Property taxes
- −$822
- − Insurance
- −$1,000
- − Repairs & maintenance
- −$1,966
- − Management
- −$1,966
- − Depreciation
- −$5,815
- Taxable income
- $1,812
- Est. tax owed @ 24.0%
- −$435
- After-tax cash flow
- $4,581/yr
For passive investors: Depreciation is non-cash, so a rental often shows a tax loss while cash-flowing — sheltering income. Rental losses are passive: they offset passive income freely, and up to $25,000/yr can offset ordinary (W-2) income if you actively participate and your MAGI is under $100k (phasing out to $0 by $150k); unused losses carry forward. On sale, claimed depreciation is recaptured at up to 25%, and gains may owe capital-gains tax (a 1031 exchange can defer both). Figures are a year-1 estimate at your 24.0% rate — not tax advice; consult a CPA.
Schools (NCES district)
- District
- Lee
- NCES district ID
- 1201080
- Math proficiency
- 47% ▼ -11.00%
- Reading proficiency
- 50% ▼ -4.00%
- Median HH income
- $49,518
- Composite
- 41.49/100
- National rank
- #3458
- State rank
- #42 of 73 in FL
Livability — Fort Myers
- Score
- 86/100
- State rank
- #14
- US rank
- #383
Category grades
Schools grade is shown separately in the Schools card above.
Census & demographics
- Census place
- Fort Myers, FL
- County
- Lee County · 788,662 people
- City population
- 278,598
- Metro
- Cape Coral-Fort Myers, FL
- Population (ZIP)
- 24,481
- Household income
- $51,816
- Rent vs Own
- Severe rent burden
- 1782.0
Population outlook (Lee County) Hauer SSP2
- Today (2025)
- 871,946 people
- By 2030
- 955,468 · +9.6%
- By 2040
- 1,113,587 · +27.7%
- By 2050
- 1,256,891 · +44.1%
- By 2075
- 1,560,270 · +78.9%
- By 2100
- 1,726,848 · +98.0%
Race, ethnicity, and origin ACS 2023
- Neighborhood character
- Diverse neighborhood (Simpson 0.65)
- Race & ethnicity
- White 50% Hispanic / Latino 23% Black 22% Two or more races 15% Asian 1%
- Hispanic origin (detail)
- Mexican 6% Puerto Rican 4% Cuban 4%
- Common ancestry
- Hispanic 7% Estonian 2% Lithuanian 2%
- Foreign-born
- 22% · Canada, Jamaica
- Languages at home
- 68% English-only · Spanish 18% French/Haitian/Cajun 8% Other Indo-European 4%
Political lean MEDSL · Lee
- 2024 margin
- Strong R (+28.4) · D 35.5% · R 63.9%
- 2008→2024 swing
- -18.0pp toward R · 2008: -10.4pp · 2024: -28.4pp
- All cycles
- 2024: R+28.4 2020: R+19.2 2016: R+20.4 2012: R+16.6 2008: R+10.4
Not yet ingested
- Civics
- —
Market trends
- HPI YoY
- ▼ -108.70%
- Current HPI
- 311.8283
- Rent YoY
- ▼ -3.23%
- Metro
- Cape Coral-Fort Myers, FL
- State GDP YoY
- ▲ 3.28%
- F500 in state
- 36
Industry mix (Fortune 500 HQ in FL)
| Industry | F500 HQs | Revenue |
|---|---|---|
| Industrial Technology | 2 | $29B |
|
||
| Insurance | 2 | $17B |
|
||
| Retail | 1 | $60B |
|
||
| Technology Distribution | 1 | $58B |
|
||
| Homebuilding | 1 | $35B |
|
||
| Technology Manufacturing | 1 | $35B |
|
||
Price history
+216.8% since first listed4 events — show timeline
- 2026-04-23 Price Changed $199,900 NAPLESMLS
- 2026-04-13 Pending — NAPLESMLS
- 2026-04-07 Listed $199,000 NAPLESMLS
- 1994-11-01 Sold (Public Records) $63,100 Public Records
Property tax history
+1.0%/yrLatest (2025): $822 · -0.3% YoY. Source: county tax records.
Cash-flow waterfall
monthlySold comps — $/sqft
last 12 mo · ≤1 miLoading sold comps…