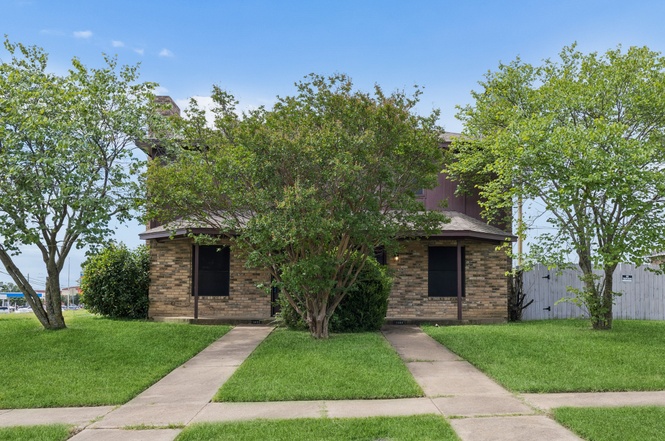
 Duplex
1401 Brook Meadow Cir · Lancaster, TX
Flood risk 1/10 · Minimal
- FEMA flood zone
- X (unshaded)
- Chance of flooding over 30 yrs
- 0.0%
- Est. flood insurance / yr
- $507 – $1,088
Fire risk 4/10 · Minor
- Est. fire insurance / yr
- $1,222 – $2,270
Heat risk 7/10 · Major
- Hot days now (above 110°F)
- 7 days/yr
- Hot days in 30 yrs
- 24 days/yr
Wind risk 6/10 · Moderate
- Chance of severe wind over 30 yrs
- 27.0%
Air-quality risk 2/10 · Minimal
- Unhealthy air days now
- 2 days/yr
- Unhealthy air days in 30 yrs
- 2 days/yr
Risk factors via First Street. Map © Google.
Why this score? — see what drove the D grade
The composite is a weighted blend of 9 inputs, each scored 0–100. Each bar is that input's sub-score; the figure is the points it added to the 100-point composite (weight × sub-score).
- Cash flow +14.5/30.0
- ARV discount +7.5/15.0
- DSCR +4.4/10.0
- 1% rule +4.2/10.0
- Livability +3.1/5.0
- Rent growth +2.6/5.0
- Condition / age +2.5/5.0
- Schools +2.1/10.0
- Appreciation +0.0/10.0
$410,000
🖨 Deal sheet (PDF) 📄 Offer letter ✓ Due diligence
Multi-family units
County records classify this as Multi-Family (2-4 Unit). Listing-text estimate: 2 units. confirmed
Listing remarks
Exceptional investment opportunity with this well-maintained full duplex situated on a desirable corner lot. Whether you're looking to expand your investment portfolio or occupy one side while generating rental income from the other, this property offers incredible flexibility and value. One unit is currently leased on a month-to-month basis, providing immediate income potential, while the vacant unit is move-in ready and showcases pride of ownership throughout. The vacant side features a bright, open floorplan enhanced by a light, neutral color palette and an abundance of windows that fill the home with natural light. The inviting living room offers a cozy fireplace, creating the perfect g
Key facts
- 0.24 acre lot
- 2 garage spots
- Built 1985
Property features AI
Finance
- Other: Property type: Residential income (Duplex); Number of buildings: 1; Total units: 2; Building area reported from public records; Lot is approximately 0.24 acres; Dock and horses not permitted
- Financial info: Month-to-month tenancy; Listed for cash; Loan payment type: principal & interest; No second mortgage indicated; Gross annual income/expenses and NOI reported as 0 for multi-unit info
- HOA & community: No association; Community sidewalks
Exterior
- Parking: Attached garage; 2 covered parking spaces; 2 garage spaces; Garage faces rear; Private, secured parking with storage; Garage approximately 16 ft wide by 21 ft deep
- Security: Smoke detector(s)
- Utilities: City water; City sewer; Electricity connected; Cable available
- Home design: Duplex (residential income); 2 stories; Built in 1985; Brook Meadow subdivision; Smoke detectors installed
- Construction: Brick construction; Composition roof; Slab foundation
- Exterior features: Corner lot; Few trees; Landscaped yard; Large backyard with grass; Patio/porch: Other
Interior
- Kitchen: Dishwasher; Electric oven; Electric range
- Bedrooms: 4 bedrooms; Two-level home
- Flooring: Carpet; Ceramic tile; Laminate; Tile; Wood
- Bathrooms: 5 bathrooms
- Heating & cooling: Central heating; Electric heating; Fireplace(s) for heating; Central air conditioning; Electric cooling; Ceiling fans
- Interior features: Cable TV available; High-speed internet available; Window coverings
Neighborhood map
What this means for you Summary
Snapshot
- This is a 2 × 2-bed/2.5-bath units multifamily listed at $410k.
Deal economics
- At list price, monthly cash flow is $91 ($1k/yr) — positive. Per door: $45/mo.
- The deal already cash-flows at list — no discount required.
- To meet the 1% rule (rent ≥ 1% of price), the offer needs to be $378k (7.7% below list).
- Recommended offer: $378k (7.7% below list) — sets the bar for 1% rule.
- Cap rate 6.6% vs local median 4.8% in Lancaster — top-decile yield for the area; either an underpriced asset or a hidden risk that comps aren't pricing in. Stress-test before assuming the spread holds.
Location & tenants
- Location reads 62/100 on livability (#926 in TX) — a middle-class / working-renter tenant base. Strengths: cost of living A+, housing A+; Watch: employment C-, crime F, amenities F.
- Lancaster ISD (suburban): math 19% / reading 29% proficiency, ranked #714 of 826 in TX (top 86%) — low school quality limits family demand, transient renter base, plan for 1-2y turnover; 78% free/reduced lunch — lower-income household profile, screen leases tightly.
- Zoned schools: Houston El (math 25% / reading 32%, grade F, #2,706 of 4,322 statewide, top 63%, 674 students, 89% FRL); Lancaster Middle (math 20% / reading 32%, grade F, #1,222 of 1,662 statewide, top 74%, 1,007 students, 84% FRL); Lancaster H S (math 14% / reading 34%, grade F, #1,333 of 1,632 statewide, top 82%, 2,250 students, 84% FRL).
- Market conditions: Rents flat; 102 active listings in the ZIP; 40 comparable units currently listed for rent nearby; rentals at typical pace (median 19d on market — plan ~3-4 weeks tenant-placement turnaround); 12,577 units permitted in Dallas County in 2024 (6,829 in 5+ unit buildings).
- At $3,785/mo this rent would consume 65% of the median local household income ($70k/yr) (locally 399% of renters already pay >50% of income on rent) — very limited rent-growth headroom before tenants either downsize or default.
Forward outlook
- Local home prices are declining (-3.0%/yr); year-one equity from $3k of loan paydown is wiped out by about $12k of value loss. Plan a longer hold.
- Dallas County population projected at +35% by 2050 — long-run rental-demand tailwind backs the buy-and-hold thesis.
Negotiation context
- Only 6 days on market — expect competitive offers; lowballing is unlikely to land.
- 4 sale attempts since 19y ago with the ask held roughly flat each time — persistent listings suggest the price (not the market) is what's stuck; bring a comps-based counter.
- Current owner paid $104k; list at $410k implies a 294% gain — meaningful room to come down on a strong offer.
Risks & watch-outs
- Climate carrying-cost: major wind risk, 27% chance of damaging wind over 30y; extreme-heat days projected 7→24/yr by 2055 (HVAC capex compounding) — expect insurance premiums to compound above CPI over the hold.
Questions for the listing agent
- Can we see the unit-by-unit rent roll, current vacancy, and any below-market leases? What's the average tenancy length?
- What capital expenditures (roof, boiler, parking lot, exteriors) have been made in the last 5 years, and what's planned in the next 2?
- Is there a deadline driving the sale (1031 exchange, divorce, estate, relocation)? That informs how much negotiation room exists.
- Schools are D-rated, which usually means shorter tenancies and higher turnover. Who's the typical renter profile here, and what's been the actual vacancy rate?
- Crime grade is F in this area — have there been break-ins, vandalism, or insurance claims at this property in the last 3 years? What carrier currently insures it and at what premium?
- The area grade is low — what's the realistic commute time and amenity access for the typical tenant pool here? Any planned neighborhood developments (good or bad) we should know about?
- What's the average days-on-market for RENTAL listings here right now (not sales)? A rising rental-DOM trend means longer vacancies and softer asking-rent achievability than the comps imply.
- What's the recent tenant-quality profile in this submarket — average credit score on applications, eviction rate, late-payment / NSF rate, and stable-employment percentage? A property-management company in the area should have these aggregated.
- How much new apartment / multifamily construction is in the pipeline within 1–3 miles? Heavy new supply (>2% of stock underway) typically softens rents 12–24 months out; light construction supports rent growth.
Investment metrics
- 1% rule
- 0.92% ✗
- Cap rate
- 6.56%
- Cash-on-cash
- 0.95%
- DSCR
- 1.04
- GRM
- 9.0
CMA / ARV
No comps found within radius.
Projected returns pro-forma
-3.0% appreciation · 0.33% rent growth · sell at horizon
- IRR
- -17.9%
- Equity multiple
- 0.39×
- Total profit
- $-70,476
- Equity at exit
- $61,132
- IRR
- -16.4%
- Equity multiple
- 0.20×
- Total profit
- $-92,071
- Equity at exit
- $35,449
Cash invested: $114,800 (down + closing). Projections, not guarantees.
Landlord ↔ Tenant lean methodology
- Overall (STATE)
- 87 Strongly Landlord-Friendly
- State Texas
- 87 Strongly Landlord-Friendly · R+5
- County
- — inherits STATE
- City
- — inherits STATE
ZIP-level market 75134
- Home prices YoY
- -17.1%
- Rents YoY
- 0.3%
- Active inventory
- 102
- Price-to-rent
- 18.1×
Monthly cashflow live
- Estimated rent
- $3,785 high interval (Pro) →
- Mortgage (P&I)
- −$2,150
- Tax from tax record
- −$579 /mo · $6,944/yr
- Insurance
- −$171
- HOA
- −$0
- Vacancy / Maint / Mgmt
- −$795
- Net cashflow
- $91
Break-even live
Sensitivity live
| Price | -10% $323 | -5% $207 | +0% $91 | +5% $-25 | +10% $-142 |
|---|---|---|---|---|---|
| Rent | -10% $-208 | -5% $-59 | +0% $91 | +5% $240 | +10% $390 |
| Rate | -1.0pp $297 | -0.5pp $195 | base $91 | +0.5pp $-16 | +1.0pp $-124 |
2-unit breakdown (identical units grouped — click to expand)
| Units | Beds | Baths | Est. rent |
|---|---|---|---|
| 2× units | 2 | 2.5 | $3,784 |
| #1 | 2 | 2.5 | $1,892 |
| #2 | 2 | 2.5 | $1,892 |
| Total (2 units) | $3,785 | ||
UW: 25.0% down · 7.5% · 30yr · 1.5% tax · 5.0% vac · 8.0% maint · 8.0% mgmt
Financing live
Cash to close
- Down payment
- $102,500
- Closing costs
- $12,300
- Reserves months
- —
- Total cash needed
- —
Loan-product check · same deal, 3 products live
Conventional
25% down · 7.5% · 30yr
- Down + closing
- —
- Monthly P&I
- —
- Monthly cashflow
- —
- DSCR
- —
- Eligible?
- —
Personal DTI + credit; lowest rate.
DSCR
20% down · 8.5% · 30yr
- Down + closing
- —
- Monthly P&I
- —
- Monthly cashflow
- —
- DSCR
- —
- Eligible?
- —
No personal income docs; deal must DSCR.
Hard money
10% down · 12.0% · 12mo
- Down + closing
- —
- Monthly P&I
- —
- Monthly cashflow
- —
- DSCR
- —
- Eligible?
- —
Short-term bridge; refi at stabilization.
Rent comps 40 comps
| Address | Beds | Baths | Sqft | Rent | $/sqft | DOM | Units | Dist |
|---|---|---|---|---|---|---|---|---|
| 1623 Venus Dr E Lancaster, TX | 3.0 | 2.5 | 2339 | $2,345 | $1.00 | 14d | 1 | 0.26mi |
| 1424 Chapman Dr Lancaster, TX | 3.0 | 2.0 | 1820 | $2,099 | $1.15 | 26d | 1 | 0.31mi |
| 1811 Kings Cross Dr Lancaster, TX | 4.0 | 2.0 | 1812 | $2,200 | $1.21 | 26d | 1 | 0.45mi |
| 1217 Meadow Creek Dr Lancaster, TX | 3.0 | 2.0 | 2088 | $1,905 | $0.91 | 9d | 1 | 0.46mi |
| 1217 Meadow Creek Dr Lancaster, TX | 3.0 | 2.0 | 2088 | $1,971 | $0.94 | 14d | 1 | 0.46mi |
| 1534 Chapman Dr Lancaster, TX | 4.0 | 2.5 | 2612 | $2,700 | $1.03 | 45d | 1 | 0.53mi |
| 1534 Chapman Dr Lancaster, TX | 4.0 | 2.0 | 2612 | $2,700 | $1.03 | 21d | 1 | 0.53mi |
| 1109 Harvest Hill Ln Lancaster, TX | 3.0 | 2.5 | 2006 | $2,350 | $1.17 | 9d | 1 | 0.61mi |
| 1942 Ryder Dr Lancaster, TX | 4.0 | 2.0 | 1824 | $2,200 | $1.21 | 0d | 1 | 0.63mi |
| 1125 Greenbriar Ln Lancaster, TX | 3.0 | 2.0 | 1744 | $1,825 | $1.05 | 9d | 1 | 0.66mi |
| 711 Lentisco Dr Lancaster, TX | 4.0 | 2.0 | 2425 | $2,249 | $0.93 | 45d | 1 | 0.68mi |
| 1748 Cansler Ln Lancaster, TX | 4.0 | 2.0 | 1806 | $2,195 | $1.22 | 45d | 1 | 0.69mi |
| 1934 Mosley Dr Lancaster, TX | 4.0 | 2.0 | 1754 | $2,099 | $1.20 | 26d | 1 | 0.73mi |
| 1450 Waldrop Dr Lancaster, TX | 4.0 | 2.0 | 1946 | $2,291 | $1.18 | 45d | 1 | 0.81mi |
| 1450 Waldrop Dr Lancaster, TX | 4.0 | 2.0 | 1946 | $2,105 | $1.08 | 22d | 1 | 0.81mi |
| 1910 Jasmine Dr Lancaster, TX | 3.0 | 2.5 | 2183 | $2,480 | $1.14 | 26d | 1 | 0.85mi |
| 1861 Serena Dr Lancaster, TX | 3.0 | 2.0 | 1731 | $2,350 | $1.36 | 3d | 1 | 0.87mi |
| 1305 Cypress Ln Lancaster, TX | 4.0 | 2.0 | 1877 | $2,200 | $1.17 | 0d | 1 | 0.95mi |
| 1314 Roan Dr Lancaster, TX | 4.0 | 2.5 | 1913 | $2,375 | $1.24 | 45d | 1 | 0.95mi |
| 610 Canvas Ct Lancaster, TX | 4.0 | 2.0 | 1859 | $2,210 | $1.19 | 3d | 1 | 0.98mi |
| 610 Canvas Ct Lancaster, TX | 4.0 | 2.0 | 1859 | $2,276 | $1.22 | 9d | 1 | 0.98mi |
| 1218 Jewell Ln Lancaster, TX | 4.0 | 2.0 | 1854 | $2,071 | $1.12 | 9d | 1 | 0.98mi |
| 1215 Jessie Ln Lancaster, TX | 4.0 | 2.5 | 2279 | $2,296 | $1.01 | 14d | 1 | 1.00mi |
| 1252 Payne Dr Lancaster, TX | 4.0 | 2.0 | 1577 | $2,239 | $1.42 | 4d | 1 | 1.01mi |
| 2904 Crimson Clover Dr Lancaster, TX | 4.0 | 2.5 | 2512 | $2,359 | $0.94 | 18d | 1 | 1.12mi |
| 2912 Crimson Clover Dr Lancaster, TX | 3.0 | 2.0 | 1735 | $2,075 | $1.20 | 9d | 1 | 1.14mi |
| 2628 Loch Wood Dr Lancaster, TX | 4.0 | 2.5 | 2794 | $3,030 | $1.08 | 18d | 1 | 1.15mi |
| 721 Lindenwood Dr Lancaster, TX | 3.0 | 2.0 | 1606 | $1,895 | $1.18 | 17d | 1 | 1.19mi |
| 721 Lindenwood Dr Lancaster, TX | 3.0 | 2.0 | 1606 | $1,895 | $1.18 | 9d | 1 | 1.19mi |
| 1447 Gentle Rain Dr Lancaster, TX | 3.0 | 2.0 | 1735 | $2,200 | $1.27 | 9d | 1 | 1.23mi |
| 422 Ash Ln Lancaster, TX | 3.0 | 2.0 | 1651 | $1,995 | $1.21 | 26d | 1 | 1.25mi |
| 3032 Picket Fence Dr Lancaster, TX | 4.0 | 2.5 | 2667 | $2,705 | $1.01 | 0d | 1 | 1.26mi |
| 830 Bordner Dr Lancaster, TX | 3.0 | 2.0 | 1821 | $2,300 | $1.26 | 14d | 1 | 1.26mi |
| 2206 Midbury Dr Lancaster, TX | 3.0 | 2.5 | 2140 | $2,235 | $1.04 | 0d | 1 | 1.26mi |
| 2654 Hartford Ln Lancaster, TX | 4.0 | 2.0 | 1657 | $2,015 | $1.22 | 45d | 1 | 1.30mi |
| 2246 Midbury Dr Lancaster, TX | 3.0 | 2.5 | 2010 | $2,185 | $1.09 | 45d | 1 | 1.30mi |
| 2217 Midbury Dr Lancaster, TX | 3.0 | 2.0 | 1603 | $2,150 | $1.34 | 19d | 1 | 1.31mi |
| 1244 Flower Ridge Dr Lancaster, TX | 3.0 | 2.0 | 1818 | $2,099 | $1.15 | 45d | 1 | 1.32mi |
| 2720 Wild Grove Ln Unit 1340976P Lancaster, TX | 4.0 | 2.0 | 1732 | $15,834 | $9.14 | 24d | 1 | 1.32mi |
| 2720 Wild Grove Ln Lancaster, TX | 4.0 | 2.0 | 1733 | $8,750 | $5.05 | 45d | 1 | 1.32mi |
Listing history 5 events
-
2026-06-21days on market $410,000 Active 6 DOM
-
2026-06-18days on market $410,000 Active 3 DOM
-
2026-06-17days on market $410,000 Active 2 DOM
-
2026-06-15remarks 699-char remark
-
2026-06-15$410,000 Active 1 DOM
ⓘ Source: listings_history table (triggers on properties + properties_extension) + one-shot
backfill from property_details.listing_events for pre-trigger history.
Tax reassessment forecast TX · Resets to sale price
- Current annual tax
- $6,944 · $579/mo
- Projected year-2 tax
- $7,503 · $625/mo
- Expected delta
- +$559/yr (+$47/mo · 8.1%)
ⓘ Screening estimate from a state-policy table — verify with the county assessor before closing.
Climate risk First Street
- Flood 1/10 Low FEMA zone X (unshaded) · 0% chance over 30 yrs
- Wildfire 4/10 Moderate
- Heat 7/10 Severe 7 d/yr ≥110°F today · 24 d/yr by 30 yrs out
- Wind 6/10 Major 27% chance of damaging wind over 30 yrs
- Air quality 2/10 Low 2 unhealthy d/yr today · 2 by 30 yrs out
Nearby sold comps map
Loading sold comps map…
Walkable amenities ~0.75 mi
Loading nearby amenities…
Taxation est. · year 1
- Rental income
- $45,420
- − Mortgage interest
- −$22,966
- − Property taxes
- −$6,944
- − Insurance
- −$2,050
- − Repairs & maintenance
- −$3,634
- − Management
- −$3,634
- − Depreciation
- −$11,927
- Taxable loss
- −$5,735
- Est. tax savings @ 24.0%
- +$1,376
- After-tax cash flow
- $2,463/yr
For passive investors: Depreciation is non-cash, so a rental often shows a tax loss while cash-flowing — sheltering income. Rental losses are passive: they offset passive income freely, and up to $25,000/yr can offset ordinary (W-2) income if you actively participate and your MAGI is under $100k (phasing out to $0 by $150k); unused losses carry forward. On sale, claimed depreciation is recaptured at up to 25%, and gains may owe capital-gains tax (a 1031 exchange can defer both). Figures are a year-1 estimate at your 24.0% rate — not tax advice; consult a CPA.
Schools (NCES district)
- District
- Lancaster ISD
- NCES district ID
- 4826670
- Math proficiency
- 19% ▼ -29.00%
- Reading proficiency
- 29% ▼ -11.00%
- Median HH income
- $52,275
- Composite
- 21.41/100
- National rank
- #8349
- State rank
- #714 of 826 in TX
Livability — Lancaster
- Score
- 62/100
- State rank
- #926
- US rank
- #16461
Category grades
Schools grade is shown separately in the Schools card above.
Census & demographics
- Census place
- Lancaster, TX
- County
- Dallas County · 2,612,404 people
- City population
- 44,142
- Metro
- Dallas-Fort Worth-Arlington, TX
- Population (ZIP)
- 19,045
- Household income
- $69,778
- Rent vs Own
- Severe rent burden
- 399.0
Population outlook (Dallas County) Hauer SSP2
- Today (2025)
- 2,979,839 people
- By 2030
- 3,191,823 · +7.1%
- By 2040
- 3,619,611 · +21.5%
- By 2050
- 4,026,915 · +35.1%
- By 2075
- 4,957,073 · +66.4%
- By 2100
- 5,508,725 · +84.9%
Race, ethnicity, and origin ACS 2023
- Neighborhood character
- Predominantly Black (68%)
- Race & ethnicity
- Black 68% Hispanic / Latino 22% Two or more races 9% White 8%
- Hispanic origin (detail)
- Mexican 20%
- Common ancestry
- Slovak 1%
- Foreign-born
- 9% · Canada
- Languages at home
- 79% English-only · Spanish 20%
Political lean MEDSL · Dallas
- 2024 margin
- Strong D (+22.2) · D 60.2% · R 38.0% · Other 1.8%
- 2008→2024 swing
- +6.9pp toward D · 2008: 15.3pp · 2024: 22.2pp
- All cycles
- 2024: D+22.2 2020: D+31.6 2016: D+26.2 2012: D+15.4 2008: D+15.3
Not yet ingested
- Civics
- —
Market trends
- HPI YoY
- ▼ -66.51%
- Current HPI
- 323.4396
- Rent YoY
- ▲ 0.33%
- Metro
- Dallas-Fort Worth-Arlington, TX
- State GDP YoY
- ▲ 3.95%
- F500 in state
- 110
Industry mix (Fortune 500 HQ in TX)
| Industry | F500 HQs | Revenue |
|---|---|---|
| Energy | 16 | $1,198B |
|
||
| Technology | 5 | $198B |
|
||
| Engineering / Construction | 4 | $72B |
|
||
| Energy Services | 3 | $60B |
|
||
| Utilities | 3 | $41B |
|
||
| Healthcare | 2 | $330B |
|
||
Price history
+294.3% since first listed10 events — show timeline
- 2026-06-15 Listed $410,000 NTREIS
- 2024-05-20 Rental Removed $1,500 NTREIS
- 2024-03-01 Listed for Rent $1,500 NTREIS
- 2024-03-01 Listing Removed — NTREIS
- 2024-02-27 Listed $1,500 NTREIS
- 2008-01-17 Sold (MLS) — NTREIS
- 2008-01-02 Listing Removed — NTREIS
- 2007-06-01 Listed $128,000 NTREIS
- 2007-02-12 Sold (Public Records) $103,994 Public Records
- 2000-12-08 Sold (Public Records) — Public Records
Property tax history
+4.1%/yrLatest (2025): $6,944 · -0.1% YoY. Source: county tax records.
Cash-flow waterfall
monthlySold comps — $/sqft
last 12 mo · ≤1 miLoading sold comps…